Independence Village of Rockford
Nursing Home & Independent Living · Rockford, IL
CMS overall rating Info CMS (the Centers for Medicare & Medicaid Services) is the federal agency that rates nursing home quality. Its Overall Rating runs from 1 to 5 stars, combining health inspections, staffing, and quality measures, with inspections weighted most heavily.

Independence Village of Rockford

Nursing Home & Independent Living · Rockford, IL
CMS overall rating Info CMS (the Centers for Medicare & Medicaid Services) is the federal agency that rates nursing home quality. Its Overall Rating runs from 1 to 5 stars, combining health inspections, staffing, and quality measures, with inspections weighted most heavily.
Calculator: See prices in your area
Independence Village of Rockford accepts Medicare, Medicaid, and private pay.

Overview of Independence Village of Rockford

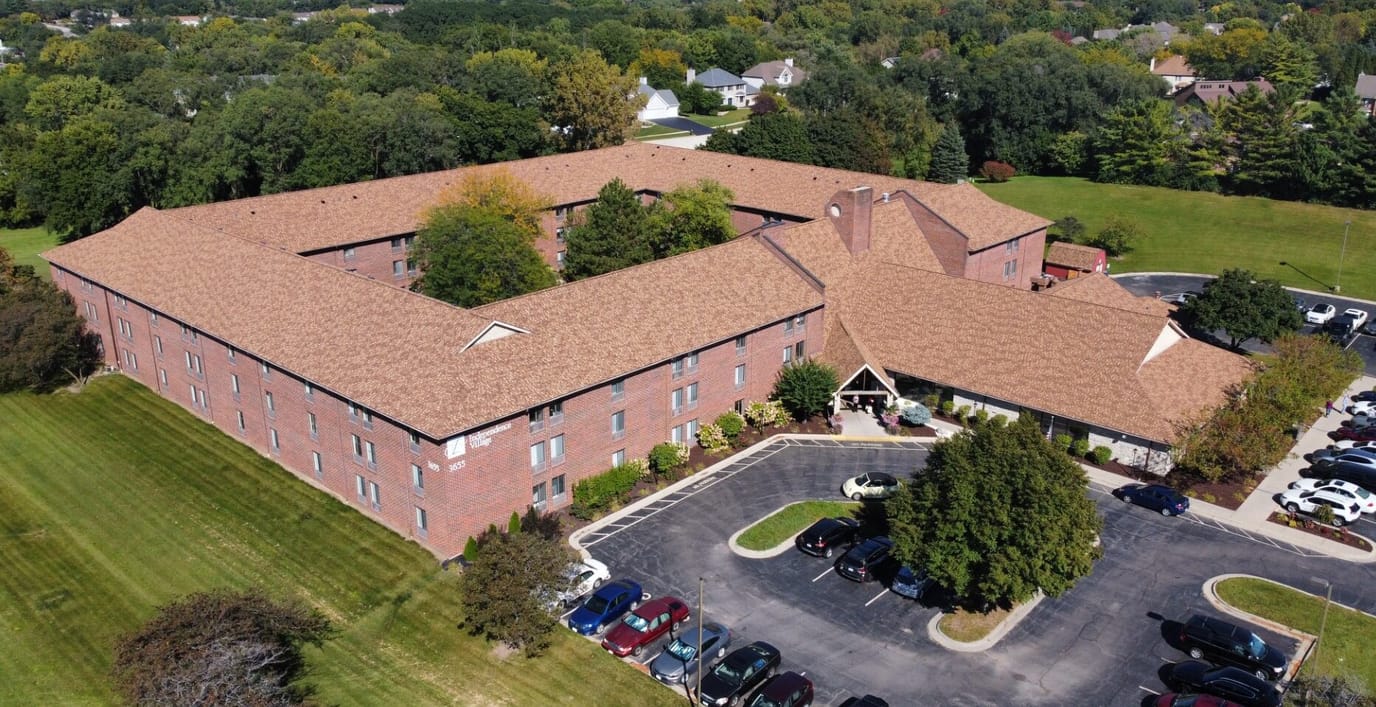
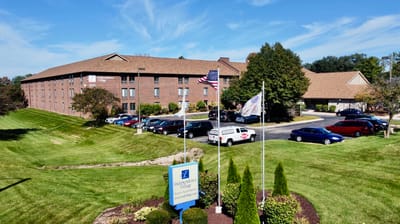
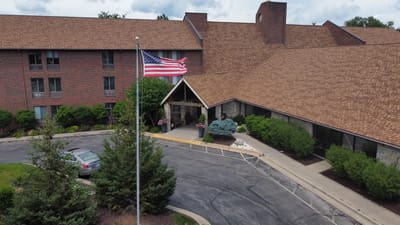
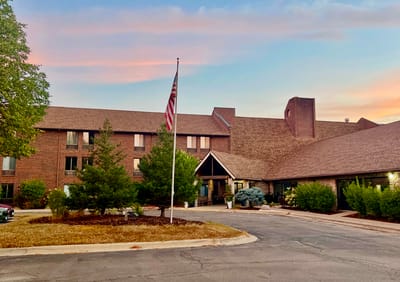
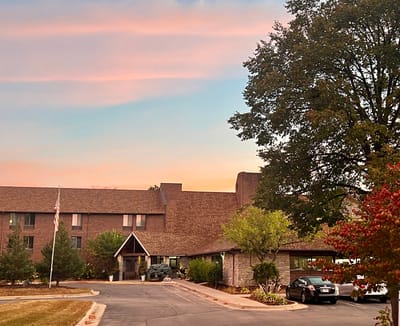
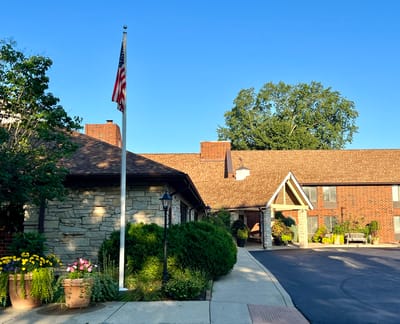
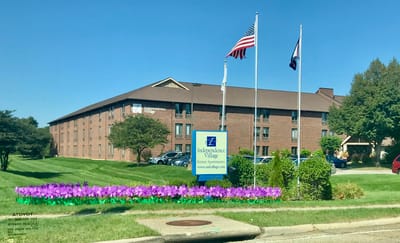
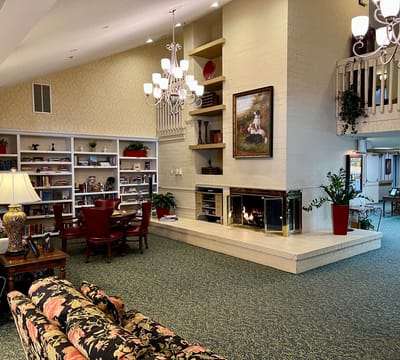
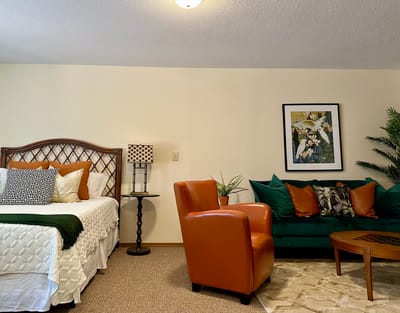
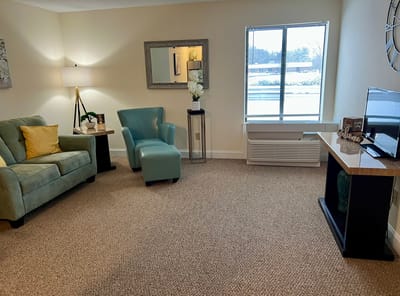
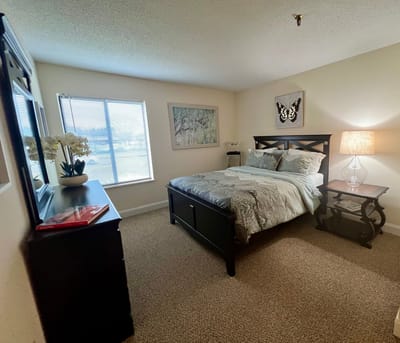
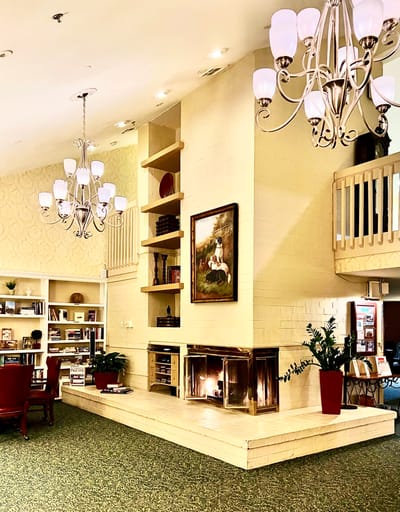
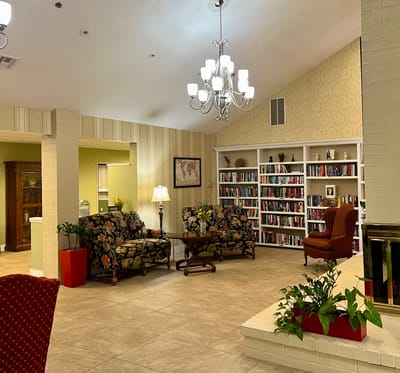
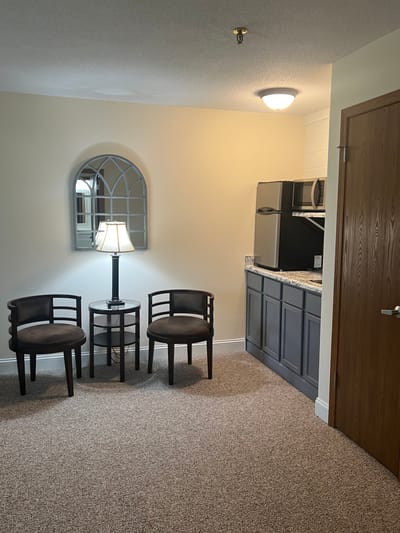
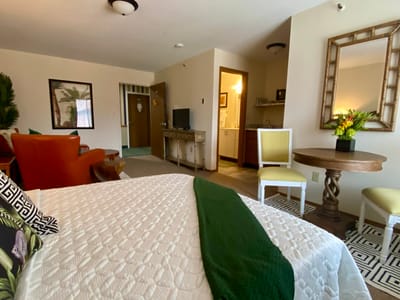
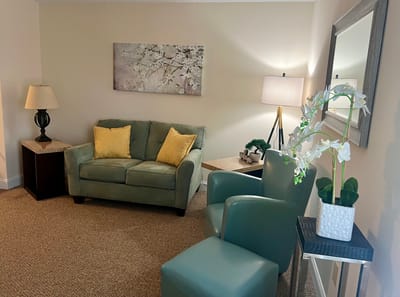
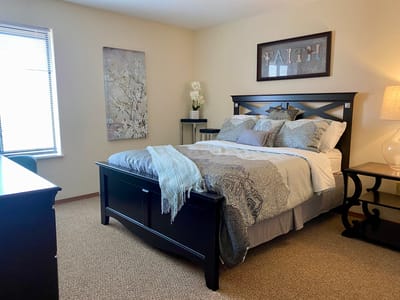
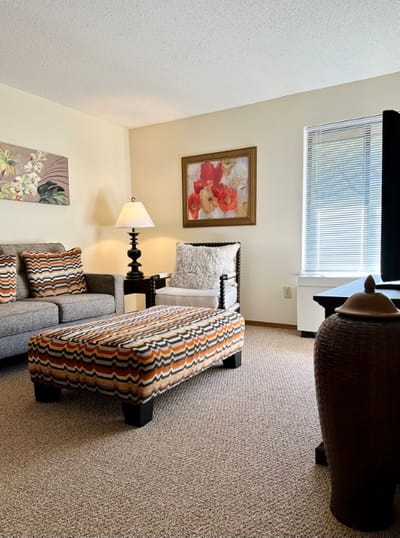
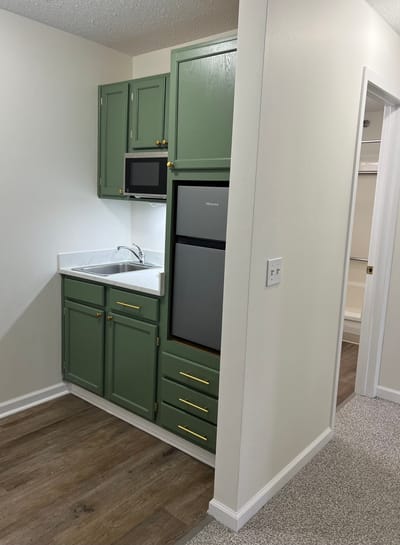
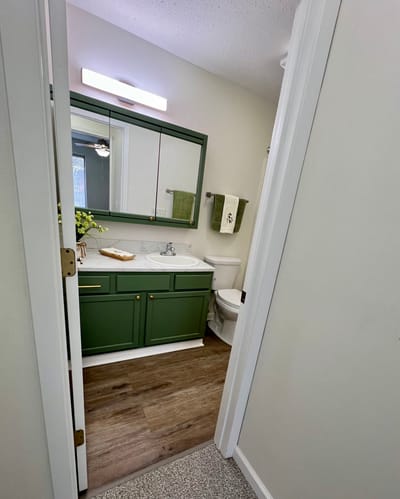
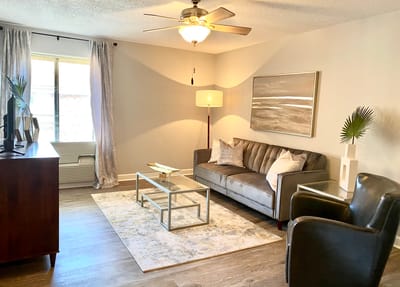
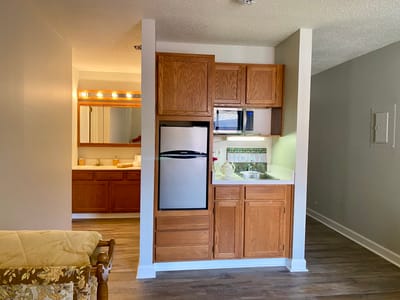
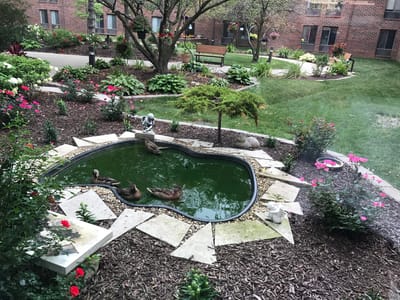
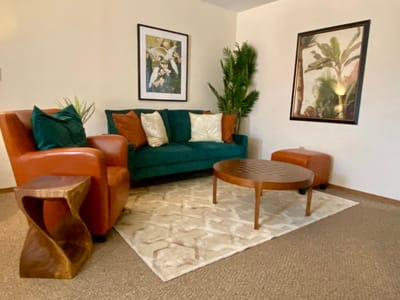
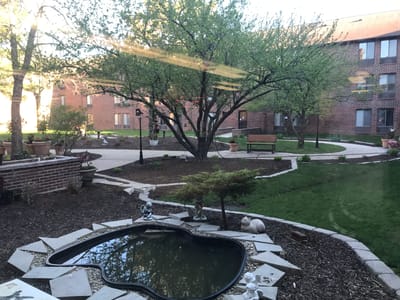
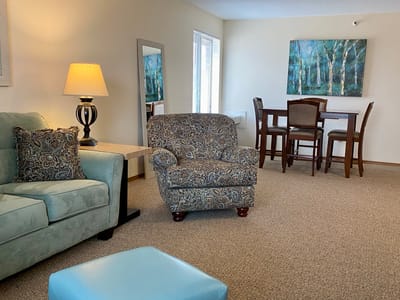
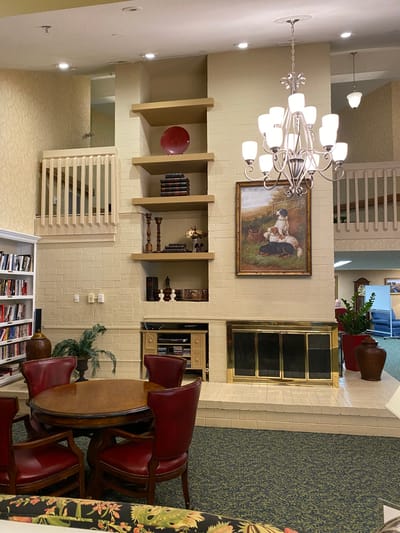
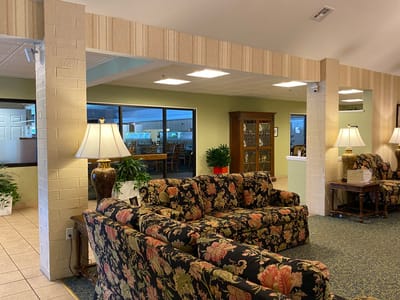
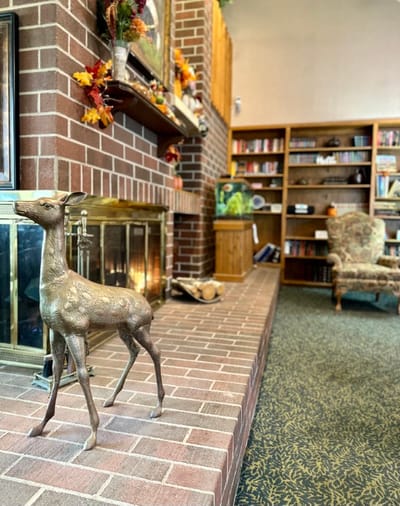
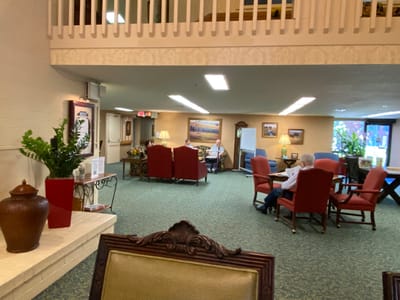
Spend your best years at Independence Village of Rockford, an award-winning community in Rockford, IL, offering independent living. With thoughtfully designed and spacious accommodations, residents are guaranteed the utmost comfort. Weekly housekeeping and linen services are also provided, so residents have more time to do the things they love.

Recreational activities and wellness programs are also conducted, encouraging residents to live actively and maintain social connections. Three delicious and healthy meals are also served to satisfy residents’ dietary needs and preferences. Residents also have easy access to thriving local amenities and leisure sites. The community is a great option for those looking to live independently in retirement.

Quality ratings

Measured by Centers for Medicare & Medicaid Services (CMS)

Overall rating Info The Overall CMS Rating combines results from health inspections, staffing levels and quality measures. Health inspections carry the most weight. Staffing and quality scores can increase or decrease the final rating based on performance compared to state and national standards.
▲ 19.0% Above IL avg. ▲ 19.0% Above IL avg.IL average: 2.5Click the badge to see the full State ranking.Click here to see the full State ranking.
Health Inspection Info Based on the results of the facility's three most recent standard inspections and any complaint investigations. CMS reviews the number, scope, and severity of deficiencies, with more recent findings weighted more heavily.
▲ 8.1% Above IL avg. ▲ 8.1% Above IL avg.IL average: 2.8Click the badge to see the full State ranking.Click here to see the full State ranking.
Staffing Info Measures average nursing staff hours per resident per day, including Registered Nurses (RNs) and total nursing staff. Ratings are adjusted based on the level of care residents require and are compared to state and national benchmarks.
▲ 133.9% Above IL avg. ▲ 133.9% Above IL avg.IL average: 2.1Click the badge to see the full State ranking.Click here to see the full State ranking.
Quality Measures Info Based on clinical and physical health indicators reported to CMS, such as hospital readmissions, falls, pressure ulcers, and improvements in mobility. These measures reflect how well residents' health needs are being managed.
▼ 64.5% Below IL avg. ▼ 64.5% Below IL avg.IL average: 2.8Click the badge to see the full State ranking.Click here to see the full State ranking.

Staffing hours breakdown

Info Daily nursing hours per resident by staff type, reported to CMS. Higher is generally better — compare this facility to state and national averages to see where staffing stands.

Hours per resident per day — compared to Illinois state averages

Staff type Hours / Day / Resident vs state avg
Registered Nurse (RN) Info RNs hold the highest nursing license and can assess residents, interpret test results, and direct care plans. More RN hours per day often signals stronger clinical oversight and faster response to health changes. 51m per day ▲ 18% State avg: 43m per day · National avg: 41m per day
LPN / LVN Info Licensed Practical Nurses (LPNs) or Licensed Vocational Nurses (LVNs) deliver routine hands-on care — medication administration, wound dressing, and monitoring vital signs. They work under RN supervision and make up a large share of daily bedside care. 39m per day ■ Avg State avg: 39m per day · National avg: 52m per day
Nurse Aide Info Certified Nurse Aides (CNAs) provide the most direct day-to-day assistance: bathing, dressing, feeding, and mobility. Nurse aide hours are typically the largest staffing category and directly affect residents' quality of life. 3h 25m per day ▲ 61% State avg: 2h 7m per day · National avg: 2h 20m per day
Weekend Total Nursing Info Combined nursing hours (RN + LPN + Nurse Aide) per resident per day on weekends. Staffing often drops on weekends — this figure reveals whether the facility maintains adequate coverage outside of weekday hours. 4h 36m per day ▲ 48% State avg: 3h 6m per day · National avg: 3h 27m per day
Physical Therapist Info Hours per resident per day provided by licensed Physical Therapists (PTs) or PT Assistants. PT services help residents recover mobility after injury or illness and are especially important for post-acute (short-stay) rehabilitation. 10m per day ▲ 231% State avg: 3m per day · National avg: 4m per day
Weekend RN Info Registered nurse hours specifically on weekends. Facilities sometimes reduce RN presence on Saturdays and Sundays — a low weekend RN figure compared to weekday hours can indicate reduced clinical oversight when most administrative staff are absent. 47m per day ▲ 41% State avg: 33m per day · National avg: 29m per day

Capacity and availability

This home usually has availability

Lower occupancy than the Illinois average: 69.3%
Occupancy rate
58.1% Rank #158 / 204Occupancy rate — State benchmarkedThis home is ranked 158th out of 204 homes in Illinois. Shows this facility's occupancy rate versus the Illinois average, with its Statewide rank out of 204. Higher occupancy signals strong local demand and financial stability.Rankings are based only on facilities in Illinois that report data for that category. Facilities without available data are excluded from the ranking.Click the rank badge to see the full State ranking.Click here to see the full State ranking.
Avg. Length of Stay Info Average number of days residents stay at this facility, based on CMS cost report data. Shorter stays often reflect post-acute or rehab care; longer stays reflect long-term care.
38 days
Bed community size
66-bed community Rank #222 / 426Bed count — State benchmarkedThis home is ranked 222nd out of 426 homes in Illinois. Shows this facility's certified or reported bed count compared to other Illinois facilities. Larger communities may offer more amenities, programs, and on-site services for residents and families.Rankings are based only on facilities in Illinois that report data for that category. Facilities without available data are excluded from the ranking.Click the rank badge to see the full State ranking.Click here to see the full State ranking.
A moderately sized community that may balance personal attention with shared amenities and social activities.
Years in operation
40 years in operation Rank #17 / 145Years in operation — State benchmarkedThis home is ranked 17th out of 145 homes in Illinois. Shows how long this facility has been in operation compared to other Illinois facilities. Longer operating histories may benefit residents, families, and staff.Rankings are based only on facilities in Illinois that report data for that category. Facilities without available data are excluded from the ranking.Click the rank badge to see the full State ranking.Click here to see the full State ranking.
A longer operating history, which may indicate experience navigating regulations and delivering ongoing care.
Walk Score
Walk Score: 43 / 100 Rank #399 / 648Walk Score — State benchmarkedThis home is ranked 399th out of 648 homes in Illinois. Shows how walkable this facility's neighborhood is compared to the average Walk Score across Illinois facilities. Higher scores benefit residents, families, and staff.Rankings are based only on facilities in Illinois that report data for that category. Facilities without available data are excluded from the ranking.Click the rank badge to see the full State ranking.Click here to see the full State ranking.
Somewhat walkable. A few nearby services may be reachable on foot, but most trips require transportation.
BBB Rating
BBB Rating: A+ (Accredited)
An independent rating from the Better Business Bureau based on factors such as complaint history, transparency, and business practices.
How BBB ratings work

Staffing

Key information about the people who lead and staff this community.

Leadership

ContactMs. Susan Tuthill, Owner/Director

Staff Details

Total Employees
23
Full-Time Employees
23

Therapy & Rehabilitation

1 service
Rehabilitation Services

Additional Services

1 service
Home Care

Additional Policies & Features

Pets Allowed
Minimum Age65+
HousekeepingYes
Linen ServiceYes

Amenities & Lifestyle

Restaurant
Transportation
Housekeeping
Wellness Center
Wellness Program
Branded ProgramsAssisted Independence™
Specific Programsphysical therapy, occupational therapy, speech therapy, vision care, hearing health, mental and emotional wellness, chiropractic care, Medicare home health services

Contact Independence Village of Rockford

Health Inspection History

Inspections since 2022
Total health inspections 4

Illinois average 10.4


Last Health inspection on Oct 2024

Total health citations
18 Rank #34 / 172Health citations — State benchmarkedThis home is ranked 34th out of 172 homes in Illinois. Shows this facility's total health deficiency citations benchmarked to the Illinois State average, with a ranking across all 172 IL facilities. Lower citation counts earn a better rank.Rankings are based only on facilities in Illinois that report data for that category. Facilities without available data are excluded from the ranking.Click the rank badge to see the full State ranking.Click here to see the full State ranking.

Illinois average 36.8

Citations per inspection
4.5 Rank #138 / 172Citations per inspection — State benchmarkedThis home is ranked 138th out of 172 homes in Illinois. Shows average deficiency citations per CMS inspection for this facility versus the Illinois mean across 172 facilities with citation data. Lower is better.Rankings are based only on facilities in Illinois that report data for that category. Facilities without available data are excluded from the ranking.Click the rank badge to see the full State ranking.Click here to see the full State ranking.

Illinois average 3.68


Health citations are formal notices following inspections when they fail to comply with safety and care standards.

16 of 18 citations resulted from standard inspections; and 2 of 18 resulted from complaint investigations.

Breakdown of citation severity (last 4 years)
Critical health citations
0
100% better than Illinois average

Illinois average: 0.7


Serious health citations
1
72% better than Illinois average

Illinois average: 3.6

0 critical citations Illinois average: 0.7

1 serious citation Illinois average: 3.6

17 moderate citations Illinois average: 32

0 minor citations Illinois average: 0.5
Citations history (last 4 years)
Infection Control moderate citation Oct 11, 2024
Corrected

Nutrition moderate citation Oct 11, 2024
Corrected

Quality of Care moderate citation Oct 11, 2024
Corrected

Quality of Care moderate citation Oct 11, 2024
Corrected

Staffing Data

Reporting period: October 1 – December 31, 2025 (Q4 2025). Source: CMS Payroll-Based Journal report.

Total staff 139
Employees 59
Contractors 80
Staff to resident ratio 3.56 : 1
98% more staff per resident than Illinois average
Illinois average ratio: 1.80 : 1 Illinois average ratio: 1.80 : 1See full Illinois ranking
Avg staff/day 37
Average shift 6.4 hours
16% worse than Illinois average
Illinois average: 7.6 hours Illinois average shift: 7.6 hoursSee full Illinois ranking
Total staff hours (quarter) 21,955

Nursing staff breakdown

Q4 2025 · Oct 1 – Dec 31 More info This data comes from the CMS Payroll-Based Journal report covering October 1 – December 31, 2025.
Registered Nurse

Manages medical care and health needs.

RN Staff Info 23 total: 4 full-time employees and 19 contractors. 23
Average shift length Info Average shift length. Calculated as total hours divided by days worked and average staff per day. 5.5 hours
Licensed Practical Nurse

Assists with medical care and medications.

LPN Staff Info 29 total: 4 full-time employees and 25 contractors. 29
Average shift length Info Average shift length. Calculated as total hours divided by days worked and average staff per day. 7 hours
Certified Nursing Assistant

Helps with daily care and mobility.

CNA Staff Info 52 total: 31 full-time employees and 21 contractors. 52
Average shift length Info Average shift length. Calculated as total hours divided by days worked and average staff per day. 6.8 hours

Contractor staffing

Q4 2025 · Oct 1 – Dec 31 More info This data comes from the CMS Payroll-Based Journal report covering October 1 – December 31, 2025.

Total hours from contractors

28.2%

6,198 contractor hours this quarter

Licensed Practical Nurse: 25 Certified Nursing Assistant: 21 Registered Nurse: 19 Physical Therapy Aide: 5 Speech Language Pathologist: 4 Qualified Social Worker: 2 Respiratory Therapy Technician: 2 Medical Director: 1 Physical Therapy Assistant: 1

Staff by category

Q4 2025 · Oct 1 – Dec 31 More info This data comes from the CMS Payroll-Based Journal report covering October 1 – December 31, 2025.
Certified Nursing Assistant 31 21 52 10,237 92 100% 6.8
Licensed Practical Nurse 4 25 29 2,025 92 100% 7
Dental Services Staff 6 0 6 1,608 77 84% 6.1
Registered Nurse 4 19 23 1,534 92 100% 5.5
Administrator 3 0 3 1,389 84 91% 6.3
Other Dietary Services Staff 3 0 3 778 72 78% 6.8
Nurse Practitioner 1 0 1 726 86 93% 8.4
Physical Therapy Aide 0 5 5 534 64 70% 6.8
Respiratory Therapy Technician 0 2 2 520 74 80% 5.2
Physical Therapy Assistant 0 1 1 499 64 70% 7.8
Speech Language Pathologist 0 4 4 498 62 67% 6.3
Qualified Social Worker 0 2 2 450 63 68% 7.1
Feeding Assistant 1 0 1 449 66 72% 6.8
Clinical Nurse Specialist 1 0 1 342 52 57% 6.6
Nurse Aide in Training 5 0 5 284 45 49% 2.9
Medical Director 0 1 1 84 14 15% 6
52 Certified Nursing Assistant
% of Days 100%
29 Licensed Practical Nurse
% of Days 100%
6 Dental Services Staff
% of Days 84%
23 Registered Nurse
% of Days 100%
3 Administrator
% of Days 91%
3 Other Dietary Services Staff
% of Days 78%
1 Nurse Practitioner
% of Days 93%
5 Physical Therapy Aide
% of Days 70%
2 Respiratory Therapy Technician
% of Days 80%
1 Physical Therapy Assistant
% of Days 70%
4 Speech Language Pathologist
% of Days 67%
2 Qualified Social Worker
% of Days 68%
1 Feeding Assistant
% of Days 72%
1 Clinical Nurse Specialist
% of Days 57%
5 Nurse Aide in Training
% of Days 49%
1 Medical Director
% of Days 15%

Penalties and fines

Federal penalties imposed by CMS for regulatory violations, including civil money penalties (fines) and denials of payment for new Medicare/Medicaid admissions.

Source: CMS Penalties Database

No penalties in the past 3 years

No civil money penalties or payment denials were reported in the last 3 years.

Quality of care over time

These measures show how residents usually do over time at this home, based on health outcomes and preventive care.

High-risk clinical events score Info A composite score based on pressure ulcers, falls with injury, weight loss, walking ability decline, and activities of daily living decline. 8.5
13% better than Illinois average

Illinois average: 9.7

Functional decline score Info A composite score based on activities of daily living decline, walking ability decline, and incontinence. 8.1
56% better than Illinois average

Illinois average: 18.6

Long-stay resident measures
Need for Help with Daily Activities Increased Info Percent of long-stay residents whose need for help with daily activities has increased 10.3%
33% better than Illinois average

Illinois average: 15.5%

Walking Ability Worsened Info Percent of long-stay residents whose ability to move independently worsened 9.1%
51% better than Illinois average

Illinois average: 18.4%

Low Risk Residents with Bowel/Bladder Incontinence Info Percent of low risk long-stay residents who lose control of their bowels or bladder 5.1%
77% better than Illinois average

Illinois average: 21.6%

Falls with Major Injury Info Percent of long-stay residents experiencing one or more falls with major injury 4.9%
47% worse than Illinois average

Illinois average: 3.4%

High Risk Residents with Pressure Ulcers Info Percent of long-stay high risk residents with pressure ulcers 15.1%
187% worse than Illinois average

Illinois average: 5.3%

Urinary Tract Infection Info Percent of long-stay residents with a urinary tract infection 5.1%
185% worse than Illinois average

Illinois average: 1.8%

Lost Too Much Weight Info Percent of long-stay residents who lose too much weight 2.9%
55% better than Illinois average

Illinois average: 6.5%

Depressive Symptoms Info Percent of long-stay residents who have depressive symptoms 2.8%
94% better than Illinois average

Illinois average: 48.1%

Antipsychotic Use Info Percent of long-stay residents who received an antipsychotic medication 41.3%
104% worse than Illinois average

Illinois average: 20.2%

Pneumococcal Vaccine Info Percent of long-stay residents assessed and appropriately given the pneumococcal vaccine 100.0%
12% better than Illinois average

Illinois average: 89.2%

Influenza Vaccine Info Percent of long-stay residents assessed and appropriately given the seasonal influenza vaccine 95.5%
In line with Illinois average

Illinois average: 91.6%

Short-stay resident measures
Pneumococcal Vaccine Info Percent of short-stay residents assessed and appropriately given the pneumococcal vaccine 99.7%
46% better than Illinois average

Illinois average: 68.3%

Antipsychotic medication increase Info Percent of short-stay residents who newly received an antipsychotic medication 1.9%
17% better than Illinois average

Illinois average: 2.3%

Influenza Vaccine Info Percent of short-stay residents assessed and appropriately given the seasonal influenza vaccine 92.2%
46% better than Illinois average

Illinois average: 63.0%

Breakdown by payment type

Medicare

82% of new residents, usually for short-term rehab.

Typical stay 1 - 2 months

Private pay

14% of new residents, often for short stays.

Typical stay 2 years

Medicaid

4% of new residents, often for long-term daily care.

Typical stay 1 - 2 years

Facility Characteristics

Source: CMS Long-Term Care Facility Characteristics (Data as of Jan 2026)

Total residents 39
Medicare
20
51.3% of residents
Medicaid
9
23.1% of residents
Private pay or other
10
25.6% of residents
Programs & Services
Residents Group

Residents meet regularly to discuss policies, care quality, and activities

Active Resident Council

Organized group of residents that meets regularly to discuss facility policies, quality of life, and activities.

Finances and operations

Based on CMS SNF Cost Report for fiscal year ending in 12/2023.

For-profit
Corporation
Net patient revenue Info Net patient revenue — what the home actually collects for resident care, after contractual allowances, bad debt and discounts are subtracted from its gross charges (CMS cost report, Worksheet G-3). It covers resident care only; money the home earns from other sources is shown separately as "Other income."
$6.6M
Net patient income Info Net patient income: net patient revenue minus the home's total operating expenses. A positive figure means it earns more from resident care than it spends to deliver it; a negative figure means the opposite. It excludes non-operating "other income."
-$502.0K
For-profit Corporation
Net patient revenue Info Net patient revenue — what the home actually collects for resident care, after contractual allowances, bad debt and discounts are subtracted from its gross charges (CMS cost report, Worksheet G-3). It covers resident care only; money the home earns from other sources is shown separately as "Other income."
$6.6M Rank #150 / 171Revenue — State benchmarkedThis home is ranked 150th out of 171 homes in Illinois. Shows this facility's annual revenue compared to the Illinois average. Higher revenue generally means more resources for staffing and capital — read alongside Payroll %.Rankings are based only on facilities in Illinois that report data for that category. Facilities without available data are excluded from the ranking.Click the rank badge to see the full State ranking.Click here to see the full State ranking.
Net patient income Info Net patient income: net patient revenue minus the home's total operating expenses. A positive figure means it earns more from resident care than it spends to deliver it; a negative figure means the opposite. It excludes non-operating "other income."
-$502.0K
Other income Info Money the home earns outside of resident care — such as investments, grants, rentals and other non-operating sources (CMS cost report, Worksheet G-3). It is tracked separately from net patient revenue: it is not part of that figure, and it is not included in net patient income.
$139.1K
Payroll costs Info Staff salaries plus wage-related costs — benefits such as payroll taxes, health insurance and retirement — from the home's own accounting records (CMS cost report, Worksheet A). Contract or agency labor is counted separately, under other operating costs. Rank #146 / 171Payroll — State benchmarkedThis home is ranked 146th out of 171 homes in Illinois. Shows total annual staff payroll benchmarked to the Illinois average. Higher payroll investment relative to peers often signals better staffing and less reliance on cheaper contract labor.Rankings are based only on facilities in Illinois that report data for that category. Facilities without available data are excluded from the ranking.Click the rank badge to see the full State ranking.Click here to see the full State ranking.
$2.8M 42.9% of net patient revenue Info Payroll as a share of revenue: staff salaries and wage-related benefits divided by net patient revenue. A higher figure means more of each revenue dollar goes to staff pay. Rank #43 / 171Payroll % — State benchmarkedThis home is ranked 43rd out of 171 homes in Illinois. Shows payroll as a percentage of revenue versus the Illinois average. Well-run Illinois facilities typically land around 54–67% — the top third Statewide. Below 25% may signal understaffing or heavy agency use — read with Staffing ratings.Rankings are based only on facilities in Illinois that report data for that category. Facilities without available data are excluded from the ranking.Click the rank badge to see the full State ranking.Click here to see the full State ranking.
Other operating costs Info Everything it costs to run the home apart from payroll — food, utilities, supplies, maintenance, contract labor and administration. Calculated as total operating expense minus payroll (staff salaries and wage-related benefits).
$4.3M
Total costs Info The home's total operating expense for the year — all the costs of running it, salaries included (CMS cost report, Worksheet G-3).
$7.1M

What does this home offer?

Housing options icon

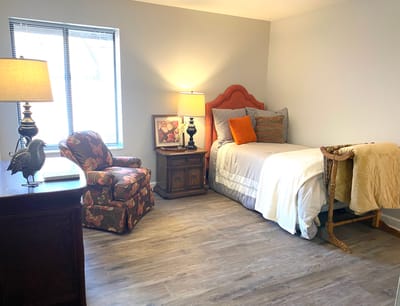
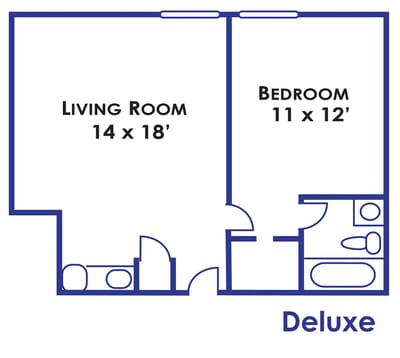
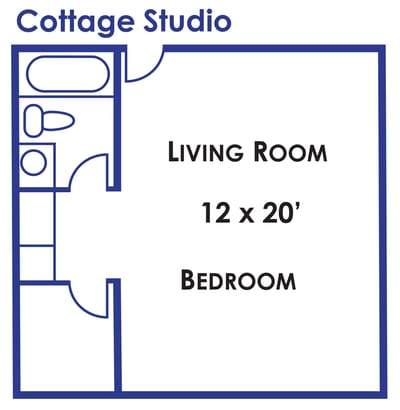
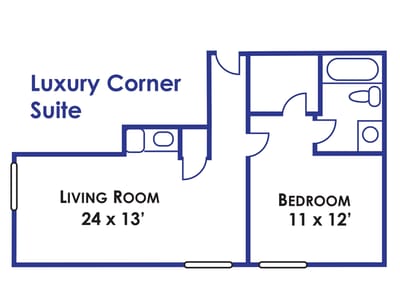
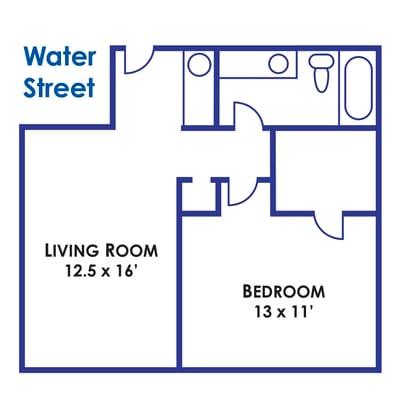
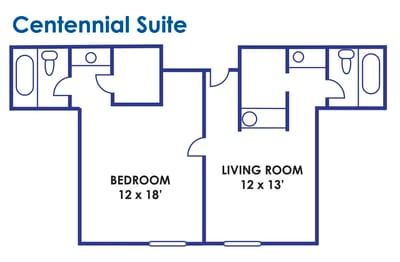
Housing Options: Studio / 1 Bed

Building type icon
Building type icon

Building Type: 3-story

Transportation services icon

Transportation Services

Housekeeping icon
Housekeeping icon

Housekeeping Services

Social and recreational activities icon

Social and Recreational Activities
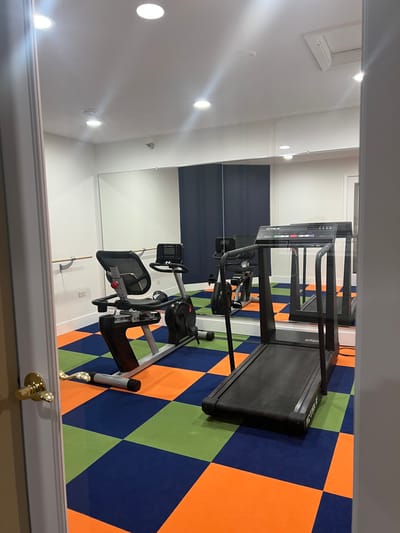
Exercise program icon

Exercise Programs

Who this home usually serves

TYPE OF STAY

Mostly short-term rehab stays

Most residents typically stay for a few weeks or months before returning home or moving on.

Most new residents arrive under Medicare (82% of admissions), and a typical Medicare stay runs around 1 - 2 months.

Admissions
138 total

Coverage residents most often arrive under.

Medicare 82%
Private pay 14%
Medicaid 4%
Discharges
162 total

Coverage residents most often leave under.

Medicare 82%
Private pay 12%
Medicaid 6%

Places of interest near Independence Village of Rockford

Address 5.3 miles from city center Info Estimated distance in miles from Rockford's city center to Independence Village of Rockford's address, calculated via Google Maps.

Calculate Travel Distance to Independence Village of Rockford

Add your location

Address

Financial Assistance for
Nursing Home in Illinois

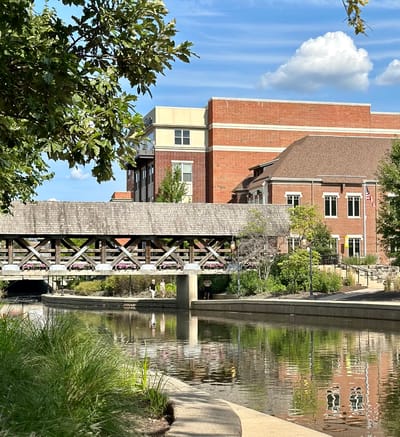
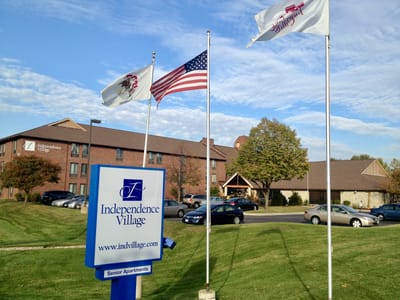
Independence Village of Rockford is located in Rockford, Illinois.
Here are the financial assistance programs available to residents in Illinois.

Get Financial aid guidance

Community Care Program

Illinois CCP

Age 60+
General Illinois resident, at risk of nursing home placement.
Income Limits (2025) ~$1,215/month individual
Asset Limits $17,500 individual, excludes home, car
IL

High demand in urban areas; waitlists possible.

Benefits
In-home care (3-5 hours/day) Adult day services ($65/day) Emergency home response systems ($30/month)

Illinois Respite Program

IL Respite (via NFCSP)

Age Caregiver of someone 60+ (or with dementia)
General Illinois resident.
Income Limits No strict limit; prioritizes low-income.
Asset Limits Not applicable.
IL

Limited slots; urban/rural balance.

Benefits
In-home respite (4-6 hours/day) Adult day care (~$65/day) Short-term facility care (up to 5 days)

Supportive Living Program (SLP)

Illinois Medicaid Supportive Living Program

Age 65+ or 22-64 with disability
General Illinois resident, Medicaid-eligible, needs moderate assistance (not nursing home-level).
Income Limits (2025) ~$2,829/month (300% FBR, individual); QIT allowed.
Asset Limits $2,000 (individual), $3,000 (couple) (excludes home, car).
IL

~200 SLP sites statewide; room/board not covered.

Benefits
Personal care (5-7 hours/day, e.g., bathing, mobility) Meals Housekeeping Medication management Respite (~240 hours/year)

Persons Who Are Elderly Waiver

Illinois Medicaid Elderly Waiver

Age 65+
General Illinois resident, Medicaid-eligible, nursing home-level care need.
Income Limits (2025) ~$2,829/month 300% FBR, individual
Asset Limits $2,000 (individual), $3,000 (couple).
IL

Part of HealthChoice Illinois; consumer-directed options available.

Benefits
Personal care (5-7 hours/day, e.g., dressing, eating) Homemaker Adult day care (~$60/day) Respite (240 hours/year) Home mods ($1,000 avg.)

Medicare Savings Program (MSP)

Illinois Medicare Savings Program

Age 65+ or disabled
General Illinois resident, Medicare Part A/B.
Income Limits (2025) ~$2,510/month (QMB), ~$3,380/month (SLMB), ~$3,598/month (QI)—individual.
Asset Limits $9,430 (individual), $14,130 (couple).
IL

Three tiers; no waitlist.

Benefits
Covers Part B premiums ($174.70/month) Deductibles ($240/year) Copays (~20%)

Optional State Supplementation (OSS)

Illinois Optional State Supplementation

Age 65+ or disabled
General Illinois resident, in approved facility, SSI recipient or low-income.
Income Limits (2025) ~$1,004/month including SSI
Asset Limits $2,000 (individual), $3,000 (couple).
IL

~$50-$500/month based on facility type.

Benefits
Cash (~$50-$500/month) for room/board in personal care homes or SLFs

VA Aid and Attendance (A&A) and Housebound Benefits

Illinois VA Aid and Attendance/Housebound

Age 65+ or disabled veteran/spouse
General Illinois resident, wartime service, need for ADL help (A&A) or homebound.
Income Limits (2025) Net income < ~$1,984/month (veteran with dependent, A&A); pension offsets income.
Asset Limits ~$155,356 net worth limit
IL

High veteran demand in urban/rural areas.

Benefits
Cash (~$1,433-$2,642/month veteran, ~$951-$1,318 spouse) for care costs (e.g., in-home, assisted living)

Frequently Asked Questions about Independence Village of Rockford

Is Independence Village of Rockford in a walkable area?

Independence Village of Rockford has a walk score of 43. Somewhat walkable. A few nearby services may be reachable on foot, but most trips require transportation.

What is the occupancy rate at Independence Village of Rockford?

Independence Village of Rockford's occupancy is 58.1%.

Does Independence Village of Rockford operate as a for-profit or non-profit?

Independence Village of Rockford is registered as a for-profit in IL.

Are there photos of Independence Village of Rockford?

Yes — there are 53 photos of Independence Village of Rockford in the photo gallery on this page.

What is the address of Independence Village of Rockford?

Independence Village of Rockford is located at 3655 N Alpine Rd, Rockford, IL 61114.

What is the phone number of Independence Village of Rockford?

(630) 357-3922 will put you in contact with the team at Independence Village of Rockford.

Is Independence Village of Rockford Medicare or Medicaid certified?

Yes — Independence Village of Rockford is a CMS-certified provider of Medicare and Medicaid.

Guides for Better Senior Living

Care Cost Calculator: See Prices in Your Area

Nursing Home Data Explorer

Don’t Wait Too Long: 7 Red Flag Signs Your Parent Needs Assisted Living Now

The True Cost of Assisted Living in 2025 – And How Families Are Paying For It

Understanding Senior Living Costs: Pricing Models, Discounts & Financial Assistance