


Total staff
104
Employees
80
Contractors
24
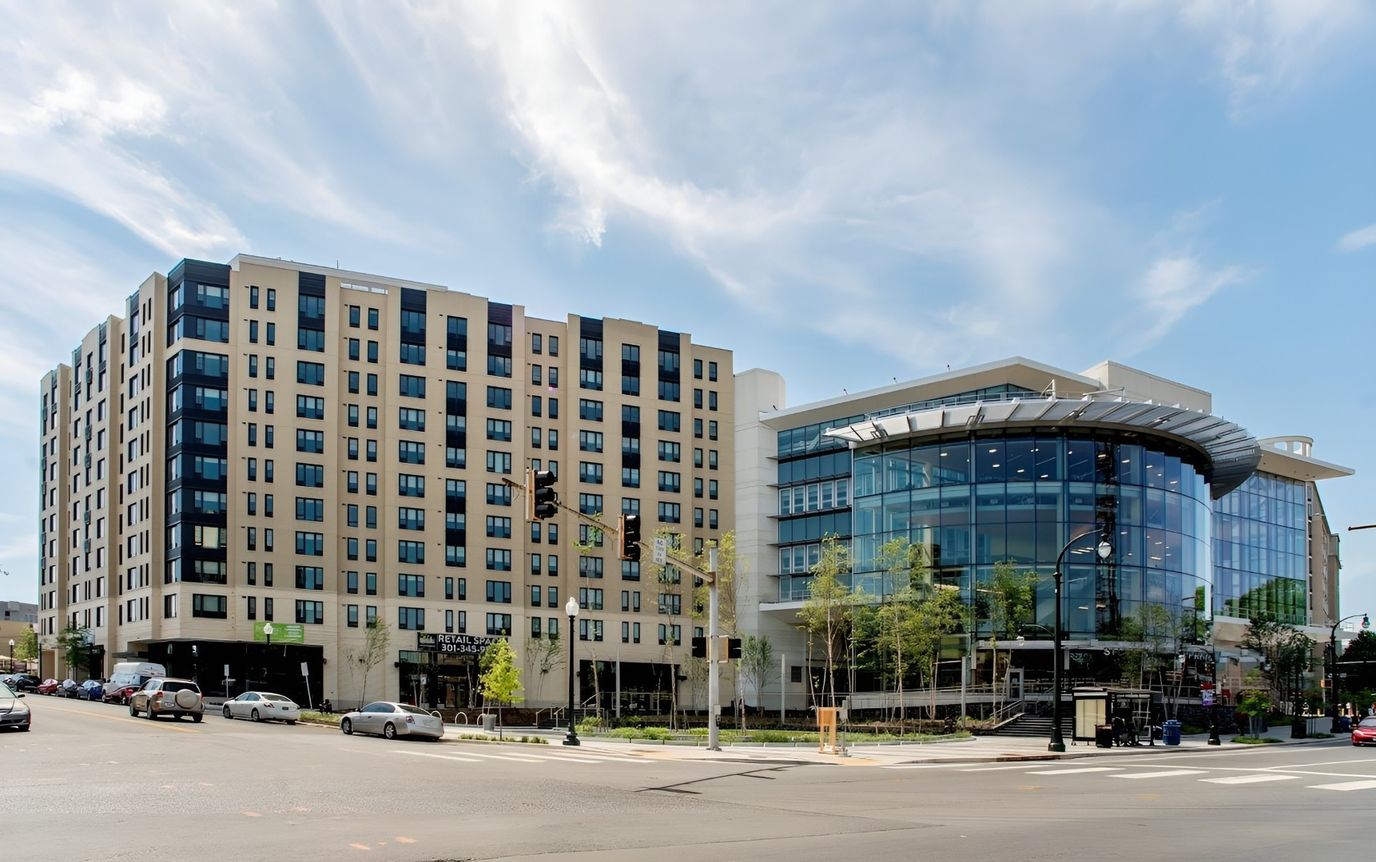


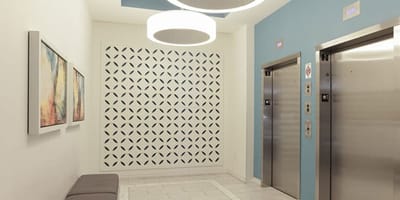


Conveniently located in the thriving neighborhood of Silver Spring, MD, The Bonifant at Silver is an astounding community that offers independent living. The community features cozy and specially designed one-bedroom floor plans, ensuring that those 62+ are comfortable and safe. On-site maintenance, management, and concierge services are also provided, so residents have a worry-free lifestyle.
Residents will not run out of things to do for leisure and wellness with a well-thought-out calendar of engaging activities and enriching programs. Delightful restaurants and shops in the area provide residents with a variety of dining options that cater to their dietary needs and preferences. Accompanied by the community’s extensive services and state-of-the-art amenities, residents are guaranteed the finest retirement experience.
| Staff type | Hours / Day / Resident | vs state avg |
|---|---|---|
|
Registered Nurse (RN)
| 1h 5m per day | ▲ 32% State avg: 49m per day · National avg: 41m per day |
|
LPN / LVN
| 51m per day | ▼ 6% State avg: 55m per day · National avg: 52m per day |
|
Nurse Aide
| 1h 53m per day | ▼ 12% State avg: 2h 8m per day · National avg: 2h 20m per day |
|
Weekend Total Nursing
| 3h 24m per day | ▼ 3% State avg: 3h 31m per day · National avg: 3h 27m per day |
|
Physical Therapist
| 4m per day | ▼ 30% State avg: 6m per day · National avg: 4m per day |
|
Weekend RN
| 40m per day | ▲ 9% State avg: 37m per day · National avg: 29m per day |
Reporting period: October 1 – December 31, 2025 (Q4 2025). Source: CMS Payroll-Based Journal report.
Manages medical care and health needs.
Assists with medical care and medications.
Helps with daily care and mobility.
Total hours from contractors
2,313 contractor hours this quarter
| Certified Nursing Assistant | 28 | 11 | 39 | 12,114 | 92 | 100% | 7.9 |
| Licensed Practical Nurse | 14 | 3 | 17 | 5,498 | 92 | 100% | 8.4 |
| Registered Nurse | 12 | 4 | 16 | 4,784 | 92 | 100% | 7.3 |
| Physical Therapist | 12 | 0 | 12 | 4,235 | 92 | 100% | 7.5 |
| Clinical Nurse Specialist | 4 | 0 | 4 | 1,623 | 73 | 79% | 7.9 |
| Dental Services Staff | 5 | 0 | 5 | 1,519 | 67 | 73% | 7.2 |
| Other Dietary Services Staff | 2 | 0 | 2 | 1,012 | 91 | 99% | 7 |
| Speech Language Pathologist | 0 | 2 | 2 | 913 | 68 | 74% | 7.4 |
| Administrator | 1 | 0 | 1 | 528 | 66 | 72% | 8 |
| Nurse Practitioner | 1 | 0 | 1 | 528 | 66 | 72% | 8 |
| Physical Therapy Aide | 0 | 1 | 1 | 482 | 64 | 70% | 7.5 |
| Respiratory Therapy Technician | 0 | 1 | 1 | 436 | 66 | 72% | 6.6 |
| Physical Therapy Assistant | 0 | 1 | 1 | 172 | 58 | 63% | 3 |
| Qualified Social Worker | 0 | 1 | 1 | 96 | 37 | 40% | 2.6 |
| Dietitian | 1 | 0 | 1 | 8 | 3 | 3% | 2.8 |
Federal penalties imposed by CMS for regulatory violations, including civil money penalties (fines) and denials of payment for new Medicare/Medicaid admissions.
Source: CMS Penalties Database
No penalties in the past 3 years
No civil money penalties or payment denials were reported in the last 3 years.
These measures show how residents usually do over time at this home, based on health outcomes and preventive care.
Maryland average: 12.9
Maryland average: 25.7
Maryland average: 23.7%
Maryland average: 27.7%
Maryland average: 25.9%
Maryland average: 2.3%
Maryland average: 6.5%
Maryland average: 1.6%
Maryland average: 5.8%
Maryland average: 20.2%
Maryland average: 12.9%
Maryland average: 92.0%
Maryland average: 96.6%
Maryland average: 78.4%
Maryland average: 1.4%
Maryland average: 80.6%
Quality measures are calculated from Minimum Data Set (MDS) assessments. For most measures, lower percentages indicate better care quality.
50% of new residents, usually for short-term rehab.
48% of new residents, often for short stays.
3% of new residents, often for long-term daily care.
Source: CMS Long-Term Care Facility Characteristics (Data as of Jan 2026)
Residents meet regularly to discuss policies, care quality, and activities
Organized group of residents that meets regularly to discuss facility policies, quality of life, and activities.
Data sourced from CMS Long-Term Care Facility Characteristics quarterly report. Payer mix reflects the current resident census by primary payment source.
Historical financial and operational data for The Bonifant at Silver Spring from 2011–2023, based on CMS SNF Cost Reports.
Key figures below are for fiscal year ending in 12/2023.
Based on CMS SNF Cost Report for fiscal year ending in 12/2023.
Pets Allowed
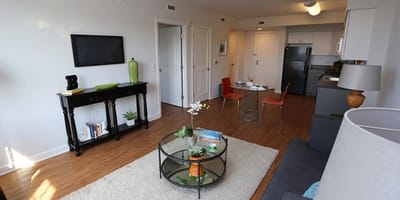
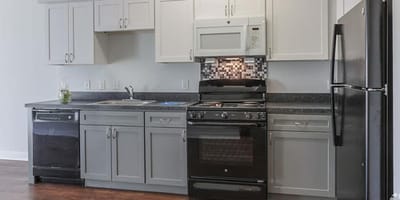
Room Sizes: 576 - 631 / 590 / 898 - 1,023 sq. ft
Housing Options: Studio / 1 Bed / 2 Bed
Building Type: High-rise
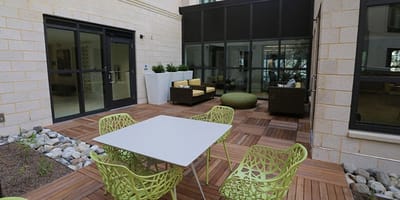
Social and Recreational Activities
Most residents typically stay for a few weeks or months before returning home or moving on.
Most new residents arrive under Medicare (50% of admissions), and a typical Medicare stay runs around 1 months.
Coverage residents most often arrive under.
Coverage residents most often leave under.

![]() 0.8 miles from city center
0.8 miles from city center
![]() Estimated distance in miles from Silver Spring's city center to The Bonifant at Silver Spring's address, calculated via Google Maps.
Estimated distance in miles from Silver Spring's city center to The Bonifant at Silver Spring's address, calculated via Google Maps.
Add your location
| Bedford Court, a CCRC | IL AL HOS MC NH RC SNF | Silver Spring (International Drive) | - | 76
Facility
76
MD AVG
43
Rank
#184 / 697 | - |
64
Facility
64
MD AVG
43
Rank
#261 / 985 | Studio / 1 Bed |
| The Bonifant at Silver Spring | IL NH | Silver Spring (Downtown Silver Spring) | - | 92
Facility
92
MD AVG
43
Rank
#155 / 697 | - |
100
Facility
100
MD AVG
43
Rank
#1 / 985 | Studio / 1 Bed / 2 Bed |
The Bonifant at Silver Spring is located in Silver Spring, Maryland.
Here are the financial assistance programs available to residents in Maryland.
The Bonifant at Silver Spring is in the Downtown Silver Spring neighborhood.
The Bonifant at Silver Spring has a walk score of 100. Walker's paradise. Daily errands do not require a car, with many shops and services nearby.
The Bonifant at Silver Spring's occupancy is 80.3%.
Yes — see the floorplan options available at The Bonifant at Silver Spring on this page.
The Bonifant at Silver Spring is registered as a for-profit.
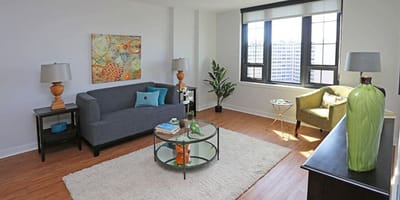
Yes — there are 13 photos of The Bonifant at Silver Spring in the photo gallery on this page.
The Bonifant at Silver Spring is located at 929 Bonifant St, Silver Spring, MD 20910.
Care Cost Calculator: See Prices in Your Area
Nursing Home Data Explorer
Don’t Wait Too Long: 7 Red Flag Signs Your Parent Needs Assisted Living Now
The True Cost of Assisted Living in 2025 – And How Families Are Paying For It
Understanding Senior Living Costs: Pricing Models, Discounts & Financial Assistance


