Floridean Nursing and Rehabilitation Center
Nursing Home & Assisted Living · Miami, FL
CMS overall rating Info CMS (the Centers for Medicare & Medicaid Services) is the federal agency that rates nursing home quality. Its Overall Rating runs from 1 to 5 stars, combining health inspections, staffing, and quality measures, with inspections weighted most heavily.

Floridean Nursing and Rehabilitation Center

Nursing Home & Assisted Living · Miami, FL
CMS overall rating Info CMS (the Centers for Medicare & Medicaid Services) is the federal agency that rates nursing home quality. Its Overall Rating runs from 1 to 5 stars, combining health inspections, staffing, and quality measures, with inspections weighted most heavily.
Calculator: See prices in your area
Floridean Nursing and Rehabilitation Center accepts Medicare, Medicaid, and private pay.

Overview of Floridean Nursing and Rehabilitation Center

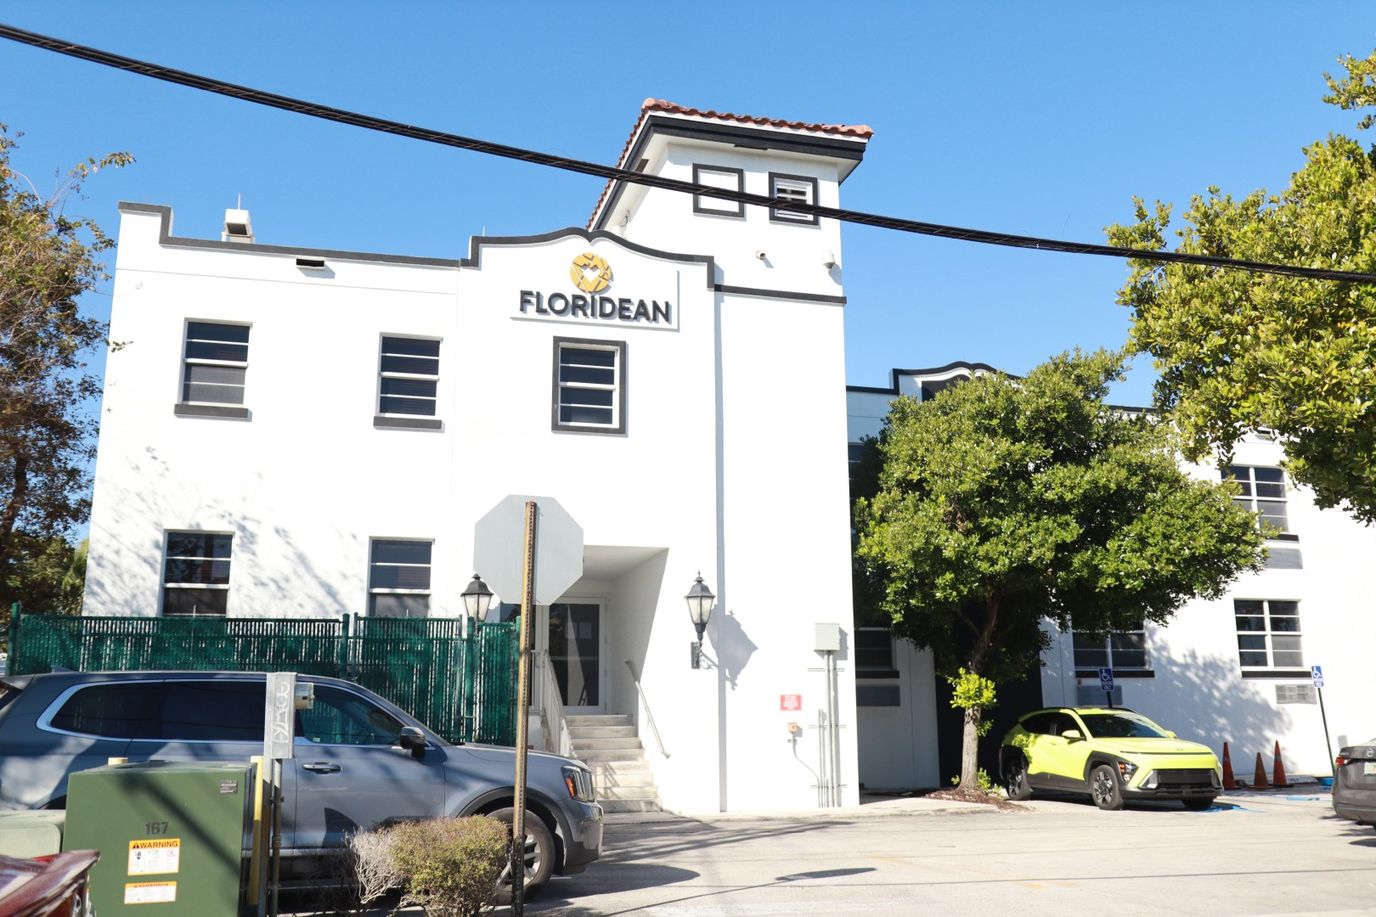
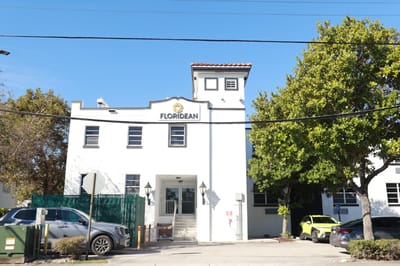
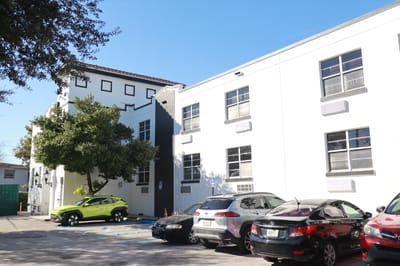
Floridean Nursing and Rehabilitation Center is on a mission to reinvent the approach to healthcare by being committed to upholding quality service to every resident. They boast their consistent excellent services and hospitality that ensures to empower and encourage residents to live their best life possible. Residents of the community do their best in providing additional support during their healing journey. Floridean Nursing and Rehabilitation Center do their best in creating an inspiring atmosphere for their residents that approach the new culture of senior care. 
The lifestyle at Floridean center is built on dedication and compassion for their residents. Community services include 24-hour nursing care, stimulating activities, engaging social activities and programs; with therapy services that include speech, occupational, and physical; as well as comprehensive rehabilitation, skilled nursing care, and Alzheimer’s and dementia care– among many others.

Quality ratings

Measured by Centers for Medicare & Medicaid Services (CMS)

Overall rating Info The Overall CMS Rating combines results from health inspections, staffing levels and quality measures. Health inspections carry the most weight. Staffing and quality scores can increase or decrease the final rating based on performance compared to state and national standards.
▲ 57.5% Above FL avg. ▲ 57.5% Above FL avg.FL average: 3.2Click the badge to see the full State ranking.Click here to see the full State ranking.
Health Inspection Info Based on the results of the facility's three most recent standard inspections and any complaint investigations. CMS reviews the number, scope, and severity of deficiencies, with more recent findings weighted more heavily.
▲ 42.3% Above FL avg. ▲ 42.3% Above FL avg.FL average: 2.8Click the badge to see the full State ranking.Click here to see the full State ranking.
Staffing Info Measures average nursing staff hours per resident per day, including Registered Nurses (RNs) and total nursing staff. Ratings are adjusted based on the level of care residents require and are compared to state and national benchmarks.
▲ 18.2% Above FL avg. ▲ 18.2% Above FL avg.FL average: 3.4Click the badge to see the full State ranking.Click here to see the full State ranking.
Quality Measures Info Based on clinical and physical health indicators reported to CMS, such as hospital readmissions, falls, pressure ulcers, and improvements in mobility. These measures reflect how well residents' health needs are being managed.
▲ 23.2% Above FL avg. ▲ 23.2% Above FL avg.FL average: 4.1Click the badge to see the full State ranking.Click here to see the full State ranking.

Staffing hours breakdown

Info Daily nursing hours per resident by staff type, reported to CMS. Higher is generally better — compare this facility to state and national averages to see where staffing stands.

Hours per resident per day — compared to Florida state averages

Total nursing care / resident Info This home is ranked 216th out of 253 homes in Florida for nurse hours. Total adjusted nursing hours per resident per day, combining RN, LPN, and aide time. CMS adjusts this for case-mix so facilities can be fairly compared.
3h 30m per day
Rank #216 / 253Nurse hours — State benchmarkedThis home is ranked 216th out of 253 homes in Florida. Shows adjusted nurse hours per resident per day benchmarked to the Florida average, with a ranking across 253 Florida facilities. More hours mean more direct care. The national average is about 3.5 hrs; below 3.0 is a red flag.Rankings are based only on facilities in Florida that report data for that category. Facilities without available data are excluded from the ranking.Click the rank badge to see the full State ranking.Click here to see the full State ranking.
This facility Florida avg (4h 2m per day)
vs Florida avg
-13%

1 of 6 metrics below state avg

Standout metric Weekend RN is +114% above state avg
Staff typeHours / Day / Residentvs state avg
Registered Nurse (RN) Info RNs hold the highest nursing license and can assess residents, interpret test results, and direct care plans. More RN hours per day often signals stronger clinical oversight and faster response to health changes. 1h 20m per day ▲ 82% State avg: 44m per day · National avg: 41m per day
LPN / LVN Info Licensed Practical Nurses (LPNs) or Licensed Vocational Nurses (LVNs) deliver routine hands-on care — medication administration, wound dressing, and monitoring vital signs. They work under RN supervision and make up a large share of daily bedside care. 13m per day ▼ 73% State avg: 47m per day · National avg: 52m per day
Nurse Aide Info Certified Nurse Aides (CNAs) provide the most direct day-to-day assistance: bathing, dressing, feeding, and mobility. Nurse aide hours are typically the largest staffing category and directly affect residents' quality of life. 2h 17m per day ■ Avg State avg: 2h 20m per day · National avg: 2h 21m per day
Weekend Total Nursing Info Combined nursing hours (RN + LPN + Nurse Aide) per resident per day on weekends. Staffing often drops on weekends — this figure reveals whether the facility maintains adequate coverage outside of weekday hours. 3h 32m per day ■ Avg State avg: 3h 31m per day · National avg: 3h 26m per day
Physical Therapist Info Hours per resident per day provided by licensed Physical Therapists (PTs) or PT Assistants. PT services help residents recover mobility after injury or illness and are especially important for post-acute (short-stay) rehabilitation. 9m per day ▲ 71% State avg: 5m per day · National avg: 4m per day
Weekend RN Info Registered nurse hours specifically on weekends. Facilities sometimes reduce RN presence on Saturdays and Sundays — a low weekend RN figure compared to weekday hours can indicate reduced clinical oversight when most administrative staff are absent. 1h 8m per day ▲ 114% State avg: 32m per day · National avg: 29m per day

Capacity and availability

This home usually has limited availability

Higher occupancy than the Florida average: 84.3%
Occupancy rate
92.3% Rank #78 / 258Occupancy rate — State benchmarkedThis home is ranked 78th out of 258 homes in Florida. Shows this facility's occupancy rate versus the Florida average, with its Statewide rank out of 258. Higher occupancy signals strong local demand and financial stability.Rankings are based only on facilities in Florida that report data for that category. Facilities without available data are excluded from the ranking.Click the rank badge to see the full State ranking.Click here to see the full State ranking.
Avg. Length of Stay
69 days
Bed community size
90-bed community Rank #533 / 1074Bed count — State benchmarkedThis home is ranked 533rd out of 1074 homes in Florida. Shows this facility's certified or reported bed count compared to other Florida facilities. Larger communities may offer more amenities, programs, and on-site services for residents and families.Rankings are based only on facilities in Florida that report data for that category. Facilities without available data are excluded from the ranking.Click the rank badge to see the full State ranking.Click here to see the full State ranking.
A larger shared setting that may offer more common spaces and organized community services.
Walk Score
Walk Score: 68 / 100 Rank #234 / 1486Walk Score — State benchmarkedThis home is ranked 234th out of 1486 homes in Florida. Shows how walkable this facility's neighborhood is compared to the average Walk Score across Florida facilities. Higher scores benefit residents, families, and staff.Rankings are based only on facilities in Florida that report data for that category. Facilities without available data are excluded from the ranking.Click the rank badge to see the full State ranking.Click here to see the full State ranking.
Moderately walkable. Some errands can be accomplished on foot, with a mix of nearby amenities.

Therapy & Rehabilitation

1 service
Rehabilitation Services

Contact Floridean Nursing and Rehabilitation Center

Staffing Data

Reporting period: October 1 – December 31, 2025 (Q4 2025). Source: CMS Payroll-Based Journal report.

Total staff 125
Employees 118
Contractors 7
Staff to resident ratio 1.40 : 1
5% fewer staff per resident than Florida average
Florida average ratio: 1.47 : 1 Florida average ratio: 1.47 : 1See full Florida ranking
Avg staff/day 54
Average shift 7.9 hours
0% compared with Florida average
Florida average: 7.9 hours Florida average shift: 7.9 hoursSee full Florida ranking
Total staff hours (quarter) 39,254

Nursing staff breakdown

Q4 2025 · Oct 1 – Dec 31 More info This data comes from the CMS Payroll-Based Journal report covering October 1 – December 31, 2025.
Registered Nurse

Manages medical care and health needs.

RN Staff Info All 25 RN Staff are full-time employees. No contractors work on this role. 25
Average shift length Info Average shift length. Calculated as total hours divided by days worked and average staff per day. 9.5 hours
Licensed Practical Nurse

Assists with medical care and medications.

LPN Staff Info All 4 LPN Staff are full-time employees. No contractors work on this role. 4
Average shift length Info Average shift length. Calculated as total hours divided by days worked and average staff per day. 9.7 hours
Certified Nursing Assistant

Helps with daily care and mobility.

CNA Staff Info All 46 CNA Staff are full-time employees. No contractors work on this role. 46
Average shift length Info Average shift length. Calculated as total hours divided by days worked and average staff per day. 7.7 hours

Contractor staffing

Q4 2025 · Oct 1 – Dec 31 More info This data comes from the CMS Payroll-Based Journal report covering October 1 – December 31, 2025.

Total hours from contractors

2.1%

808 contractor hours this quarter

Qualified Social Worker: 2 Medical Director: 2 Physical Therapy Aide: 1 Physical Therapy Assistant: 1 Respiratory Therapy Technician: 1

Staff by category

Q4 2025 · Oct 1 – Dec 31 More info This data comes from the CMS Payroll-Based Journal report covering October 1 – December 31, 2025.
Certified Nursing Assistant4604617,39692100%7.7
Registered Nurse250258,44592100%9.5
Dietitian100101,8959199%8.2
Speech Language Pathologist9091,8778289%6.8
Licensed Practical Nurse4041,6368997%9.7
Clinical Nurse Specialist4041,2806773%7.9
Physical Therapy Assistant4151,1038087%5.9
Respiratory Therapy Technician4151,0877885%6.8
Qualified Social Worker2241,0817784%8.7
Physical Therapy Aide4151,0667986%6.7
Dental Services Staff2025035964%8
Occupational Therapy Aide1014704751%10
Nurse Practitioner1014645863%8
Mental Health Service Worker1014565762%8
Administrator1014165257%8
Medical Director022802022%4
46 Certified Nursing Assistant
% of Days 100%
25 Registered Nurse
% of Days 100%
10 Dietitian
% of Days 99%
9 Speech Language Pathologist
% of Days 89%
4 Licensed Practical Nurse
% of Days 97%
4 Clinical Nurse Specialist
% of Days 73%
5 Physical Therapy Assistant
% of Days 87%
5 Respiratory Therapy Technician
% of Days 85%
4 Qualified Social Worker
% of Days 84%
5 Physical Therapy Aide
% of Days 86%
2 Dental Services Staff
% of Days 64%
1 Occupational Therapy Aide
% of Days 51%
1 Nurse Practitioner
% of Days 63%
1 Mental Health Service Worker
% of Days 62%
1 Administrator
% of Days 57%
2 Medical Director
% of Days 22%

Penalties and fines

Includes penalties issued in 2023

Federal penalties imposed by CMS for regulatory violations, including civil money penalties (fines) and denials of payment for new Medicare/Medicaid admissions.

Source: CMS Penalties Database (Data as of Jan 2026)

Total fines amount $14K Rank #185 / 258Federal fines — State benchmarkedThis home is ranked 185th out of 258 homes in Florida. Shows this facility's cumulative CMS federal fine dollars versus the Florida average among facilities with fines, and where it ranks among 258 facilities in the pool. Lower total dollars mean a better rank.Rankings are based only on facilities in Florida that report data for that category. Facilities without available data are excluded from the ranking.Click the rank badge to see the full State ranking.Click here to see the full State ranking.
81% lower than Florida average

Florida average: $72K

Number of fines 4
52% more fines than Florida average

Florida average: 2.6

Payment Denials Info Serious action where Medicare and/or Medicaid temporarily stops payments for new residents until issues are fixed. 0
100% fewer payment denials than Florida average

Florida average: 0.1

Fines amount comparison
This facility $14K
Florida average $72K
Penalty History

Penalties are imposed by CMS for violations of federal nursing home regulations.

1 penalty in the past 3 years

Jun 26, 2023 · $3K

Civil Money Penalty Info Fines imposed for noncompliance, which can be assessed per day or per instance of violation. Jun 26, 2023
$3K

Last updated: Jan 2026

Quality of care over time

These measures show how residents usually do over time at this home, based on health outcomes and preventive care.

High-risk clinical events score Info A composite score based on pressure ulcers, falls with injury, weight loss, walking ability decline, and activities of daily living decline. 5.9
20% better than Florida average

Florida average: 7.4

Functional decline score Info A composite score based on activities of daily living decline, walking ability decline, and incontinence. 6.3
49% better than Florida average

Florida average: 12.4

Long-stay resident measures
Significantly above average Florida avg: 4.5 Info CMS star rating based on long-stay quality measure performance. 5 stars = significantly above average, 1 star = significantly below average.
Need for Help with Daily Activities Increased Info Percent of long-stay residents whose need for help with daily activities has increased 9.1%
13% better than Florida average

Florida average: 10.5%

Walking Ability Worsened Info Percent of long-stay residents whose ability to move independently worsened 6.8%
47% better than Florida average

Florida average: 12.9%

Low Risk Residents with Bowel/Bladder Incontinence Info Percent of low risk long-stay residents who lose control of their bowels or bladder 3.0%
78% better than Florida average

Florida average: 13.5%

Falls with Major Injury Info Percent of long-stay residents experiencing one or more falls with major injury 2.3%
13% better than Florida average

Florida average: 2.6%

High Risk Residents with Pressure Ulcers Info Percent of long-stay high risk residents with pressure ulcers 4.7%
12% better than Florida average

Florida average: 5.4%

Urinary Tract Infection Info Percent of long-stay residents with a urinary tract infection 0.0%
100% better than Florida average

Florida average: 0.9%

Lost Too Much Weight Info Percent of long-stay residents who lose too much weight 6.7%
12% worse than Florida average

Florida average: 6.0%

Depressive Symptoms Info Percent of long-stay residents who have depressive symptoms 1.0%
71% better than Florida average

Florida average: 3.3%

Antipsychotic Use Info Percent of long-stay residents who received an antipsychotic medication 1.5%
82% better than Florida average

Florida average: 8.0%

Pneumococcal Vaccine Info Percent of long-stay residents assessed and appropriately given the pneumococcal vaccine 100.0%
In line with Florida average

Florida average: 97.7%

Influenza Vaccine Info Percent of long-stay residents assessed and appropriately given the seasonal influenza vaccine 100.0%
In line with Florida average

Florida average: 99.2%

Hospitalizations per 1,000 days Info Number of hospitalizations per 1,000 long-stay resident days. 1.97
6% better than Florida average

Florida average: 2.10

ED visits per 1,000 days Info Number of outpatient emergency department visits per 1,000 long-stay resident days. 0.66
44% better than Florida average

Florida average: 1.18

Short-stay resident measures
Above average Florida avg: 3.1 Info CMS star rating based on short-stay quality measure performance. 5 stars = much above average, 1 star = much below average.
Pneumococcal Vaccine Info Percent of short-stay residents assessed and appropriately given the pneumococcal vaccine 100.0%
6% better than Florida average

Florida average: 94.0%

Antipsychotic medication increase Info Percent of short-stay residents who newly received an antipsychotic medication 0.4%
73% better than Florida average

Florida average: 1.5%

Influenza Vaccine Info Percent of short-stay residents assessed and appropriately given the seasonal influenza vaccine 99.0%
5% better than Florida average

Florida average: 94.7%

Re-hospitalized after SNF stay Info Percentage of short-stay residents who were re-hospitalized after their nursing home admission. 33.4%
27% worse than Florida average

Florida average: 26.2%

Emergency department visits Info Percentage of short-stay residents who had an outpatient emergency department visit. 13.1%
41% worse than Florida average

Florida average: 9.3%

Falls with major injury Info Percentage of SNF residents who experience falls with major injury during their stay. 0.5%
32% better than Florida average

Florida average: 0.8%

Ability to care for self at discharge Info Percentage of residents at or above expected ability to care for themselves at discharge. 66.4%
24% better than Florida average

Florida average: 53.7%

Successful return to home or community Info Rate of successful return to home or community from a skilled nursing facility. 54.4%
8% better than Florida average

Florida average: 50.6%

Breakdown by payment type

Medicare

27% of new residents, usually for short-term rehab.

Typical stay 1 - 2 months

Private pay

68% of new residents, often for short stays.

Typical stay 1 months

Medicaid

5% of new residents, often for long-term daily care.

Typical stay 2 years

Facility Characteristics

Source: CMS Long-Term Care Facility Characteristics (Data as of Jan 2026)

Total residents 89
Medicare
23
25.8% of residents
Medicaid
34
38.2% of residents
Private pay or other
32
36% of residents
Programs & Services
Residents Group

Residents meet regularly to discuss policies, care quality, and activities

Active Resident Council

Organized group of residents that meets regularly to discuss facility policies, quality of life, and activities.

Finances and operations

Based on CMS SNF Cost Report for fiscal year ending in 12/2023.

Privately-owned community
Operated by a single business entity.
Net patient revenue Info Net patient revenue — what the home actually collects for resident care, after contractual allowances, bad debt and discounts are subtracted from its gross charges (CMS cost report, Worksheet G-3). It covers resident care only; money the home earns from other sources is shown separately as "Other income."
$10.5M
Net patient income Info Net patient income: net patient revenue minus the home's total operating expenses. A positive figure means it earns more from resident care than it spends to deliver it; a negative figure means the opposite. It excludes non-operating "other income."
-$581.6K
Privately-owned community Operated by a single business entity.
Net patient revenue Info Net patient revenue — what the home actually collects for resident care, after contractual allowances, bad debt and discounts are subtracted from its gross charges (CMS cost report, Worksheet G-3). It covers resident care only; money the home earns from other sources is shown separately as "Other income."
$10.5M Rank #134 / 257Revenue — State benchmarkedThis home is ranked 134th out of 257 homes in Florida. Shows this facility's annual revenue compared to the Florida average. Higher revenue generally means more resources for staffing and capital — read alongside Payroll %.Rankings are based only on facilities in Florida that report data for that category. Facilities without available data are excluded from the ranking.Click the rank badge to see the full State ranking.Click here to see the full State ranking.
Net patient income Info Net patient income: net patient revenue minus the home's total operating expenses. A positive figure means it earns more from resident care than it spends to deliver it; a negative figure means the opposite. It excludes non-operating "other income."
-$581.6K
Other income Info Money the home earns outside of resident care — such as investments, grants, rentals and other non-operating sources (CMS cost report, Worksheet G-3). It is tracked separately from net patient revenue: it is not part of that figure, and it is not included in net patient income.
$10.1K
Payroll costs Info Staff salaries plus wage-related costs — benefits such as payroll taxes, health insurance and retirement — from the home's own accounting records (CMS cost report, Worksheet A). Contract or agency labor is counted separately, under other operating costs. Rank #215 / 257Payroll — State benchmarkedThis home is ranked 215th out of 257 homes in Florida. Shows total annual staff payroll benchmarked to the Florida average. Higher payroll investment relative to peers often signals better staffing and less reliance on cheaper contract labor.Rankings are based only on facilities in Florida that report data for that category. Facilities without available data are excluded from the ranking.Click the rank badge to see the full State ranking.Click here to see the full State ranking.
$5.3M 49.9% of net patient revenue Info Payroll as a share of revenue: staff salaries and wage-related benefits divided by net patient revenue. A higher figure means more of each revenue dollar goes to staff pay. Rank #238 / 257Payroll % — State benchmarkedThis home is ranked 238th out of 257 homes in Florida. Shows payroll as a percentage of revenue versus the Florida average. Well-run Florida facilities typically land around 49–56% — the top third Statewide. Below 25% may signal understaffing or heavy agency use — read with Staffing ratings.Rankings are based only on facilities in Florida that report data for that category. Facilities without available data are excluded from the ranking.Click the rank badge to see the full State ranking.Click here to see the full State ranking.
Other operating costs Info Everything it costs to run the home apart from payroll — food, utilities, supplies, maintenance, contract labor and administration. Calculated as total operating expense minus payroll (staff salaries and wage-related benefits).
$5.9M
Total costs Info The home's total operating expense for the year — all the costs of running it, salaries included (CMS cost report, Worksheet G-3).
$11.1M

Who this home usually serves

TYPE OF STAY

Primarily short stays

Residents typically stay for brief periods, with frequent admissions and discharges throughout the year.

Most new residents arrive under private pay (68% of admissions), and a typical private pay stay runs around 1 months.

Admissions
450 total

Coverage residents most often arrive under.

Medicare 27%
Private pay 68%
Medicaid 5%
Discharges
438 total

Coverage residents most often leave under.

Medicare 21%
Private pay 61%
Medicaid 18%

Places of interest near Floridean Nursing and Rehabilitation Center

Address 3.4 miles from city center Info Estimated distance in miles from Miami's city center to Floridean Nursing and Rehabilitation Center's address, calculated via Google Maps. — 2.11 miles to nearest hospital (Coral Gables Hospital)

Calculate Travel Distance to Floridean Nursing and Rehabilitation Center

Add your location

Address

Compare Nursing Homes around Miami

The information below is reported by the Florida Agency for Health Care Administration (AHCA).

3 facilities compared · CMS & FL Dept. of Health data

The Palace Royale at Kendall
NH
AL
HC
IL
MC
Miami
510
Facility 510
FL AVG 89
Rank #1 / 1074
95.1%
Facility 95.1%
FL AVG 84.3%
Rank #25 / 258
+13%
3.87
Facility 3.87
FL AVG 4.04
Rank #126 / 253
+55%-4%
$0
Facility $0
FL AVG $78.9k
Rank #1 / 258
94
Facility 94
FL AVG 83
Rank #162 / 876
8
Facility 8
FL AVG 19.7
Rank #32 / 252
4.0
Facility 4.0
FL AVG 4.5
Rank #112 / 252
-172-
51
Facility 51
FL AVG 40
Rank #503 / 1486
Kendall Health Care Inc
$21.2M
Facility $21.2M
FL AVG $15.7M
Rank #55 / 257
$12.9M
Facility $12.9M
FL AVG $6.1M
Rank #40 / 257
61.1%
Facility 61.1%
FL AVG 39.8%
Rank #99 / 257
105719
Blessing ALF
NH
AL
North Miami Beach
6
Facility 6
FL AVG 89
Rank #930 / 1074
95.1%
Facility 95.1%
FL AVG 84.3%
Rank #25 / 258
+13%
3.69
Facility 3.69
FL AVG 4.04
Rank #175 / 253
+105%-8%
$0
Facility $0
FL AVG $78.9k
Rank #1 / 258
-
13
Facility 13
FL AVG 19.7
Rank #73 / 252
3.3
Facility 3.3
FL AVG 4.5
Rank #73 / 252
-81-
86
Facility 86
FL AVG 40
Rank #58 / 1486
Adventura Holdings LLC
$10.5M
Facility $10.5M
FL AVG $15.7M
Rank #221 / 257
$5.6M
Facility $5.6M
FL AVG $6.1M
Rank #208 / 257
53.4%
Facility 53.4%
FL AVG 39.8%
Rank #45 / 257
105331
Floridean Nursing and Rehabilitation Center
NH
AL
Miami (Little Havana)
90
Facility 90
FL AVG 89
Rank #533 / 1074
92.3%
Facility 92.3%
FL AVG 84.3%
Rank #78 / 258
+10%
3.50
Facility 3.50
FL AVG 4.04
Rank #216 / 253
+66%-13%
$13.7k
Facility $13.7k
FL AVG $78.9k
Rank #185 / 258
-
7
Facility 7
FL AVG 19.7
Rank #26 / 252
2.3
Facility 2.3
FL AVG 4.5
Rank #30 / 252
-83-
68
Facility 68
FL AVG 40
Rank #234 / 1486
-
$10.5M
Facility $10.5M
FL AVG $15.7M
Rank #134 / 257
$5.3M
Facility $5.3M
FL AVG $6.1M
Rank #215 / 257
49.9%
Facility 49.9%
FL AVG 39.8%
Rank #238 / 257
106007

Financial Assistance for
Nursing Home in Florida

Floridean Nursing and Rehabilitation Center is located in Miami, Florida.
Here are the financial assistance programs available to residents in Florida.

Get Financial aid guidance

Long-Term Care Waiver

Florida Medicaid LTC Waiver

Age 65+ or 21+ disabled
General Florida resident, Medicaid- eligible, nursing home-level care need.
Income Limits (2025) ~$2,829/month 300% FBR, individual
Asset Limits $2,000 (individual), $3,000 (couple).
FL

High demand; waitlists common.

Benefits
In-home care (6-8 hours/day) Assisted living Respite (240 hours/year) Case management

Community Care for the Elderly (CCE)

Florida CCE

Age 60+
General Florida resident, at risk of nursing home.
Income Limits ~$2,000/month varies
Asset Limits $5,000 individual
FL

Limited funding; regional variation.

Benefits
Homemaker services (3-5 hours/week) Adult day care (~$60/day) Respite (up to 10 days/year)

Home Care for the Elderly (HCE)

Florida Home Care for the Elderly

Age 60+
General Florida resident, at risk of nursing home placement; caregiver must be approved.
Income Limits (2025) ~$2,829/month individual, aligned with Medicaid thresholds
Asset Limits ~$2,000 (individual); varies by case manager discretion.
FL

Limited funding (~3,500 served annually); prioritizes low-income frail seniors.

Benefits
Basic subsidy (~$160/month) for housing/medical costs; special subsidies for supplies/services (e.g., incontinence supplies, ~$50-$200/month)

Program of All-Inclusive Care for the Elderly (PACE)

Florida Medicaid PACE

Age 55+
General Florida resident, nursing home-level care need, safe with PACE support.
Income Limits (2025) ~$2,829/month 300% FBR
Asset Limits $2,000 (individual), $3,000 (couple).
FL

Limited to specific counties (e.g., Hillsborough, Miami-Dade); ~10 sites statewide.

Benefits
Personal care (5-7 hours/day) Medical care Meals Transportation Therapy

Optional State Supplementation (OSS)

Florida Optional State Supplementation

Age 65+ or disabled
General Florida resident, living in approved facility, receiving SSI or low-income.
Income Limits (2025) ~$1,004/month individual, including SSI
Asset Limits $2,000 (individual), $3,000 (couple).
FL

Limited to specific facility types; ~$78.40/month max supplement.

Benefits
Cash payment (~$78.40/month) for room/board or personal needs in facilities

Frequently Asked Questions about Floridean Nursing and Rehabilitation Center

What neighborhood is Floridean Nursing and Rehabilitation Center in?

Floridean Nursing and Rehabilitation Center is in the Little Havana neighborhood.

Is Floridean Nursing and Rehabilitation Center in a walkable area?

Floridean Nursing and Rehabilitation Center has a walk score of 68. Moderately walkable. Some errands can be accomplished on foot, with a mix of nearby amenities.

What is the occupancy rate at Floridean Nursing and Rehabilitation Center?

Floridean Nursing and Rehabilitation Center's occupancy is 92.3%.

Are there photos of Floridean Nursing and Rehabilitation Center?

Yes — there are 5 photos of Floridean Nursing and Rehabilitation Center in the photo gallery on this page.

What is the address of Floridean Nursing and Rehabilitation Center?

Floridean Nursing and Rehabilitation Center is located at 47 Nw 32Nd Pl, Miami, FL 33125.

What is the phone number of Floridean Nursing and Rehabilitation Center?

(305) 649-2911 will put you in contact with the team at Floridean Nursing and Rehabilitation Center.

Is Floridean Nursing and Rehabilitation Center Medicare or Medicaid certified?

Yes — Floridean Nursing and Rehabilitation Center is a CMS-certified provider of Medicare and Medicaid.

Guides for Better Senior Living

Care Cost Calculator: See Prices in Your Area

Nursing Home Data Explorer

Don’t Wait Too Long: 7 Red Flag Signs Your Parent Needs Assisted Living Now

The True Cost of Assisted Living in 2025 – And How Families Are Paying For It

Understanding Senior Living Costs: Pricing Models, Discounts & Financial Assistance