Ponce Health and Rehabilitation Center
Nursing Home, Hospice Care & Respite Care · Miami, FL
CMS overall rating Info CMS (the Centers for Medicare & Medicaid Services) is the federal agency that rates nursing home quality. Its Overall Rating runs from 1 to 5 stars, combining health inspections, staffing, and quality measures, with inspections weighted most heavily.

Ponce Health and Rehabilitation Center

Nursing Home, Hospice Care & Respite Care · Miami, FL
CMS overall rating Info CMS (the Centers for Medicare & Medicaid Services) is the federal agency that rates nursing home quality. Its Overall Rating runs from 1 to 5 stars, combining health inspections, staffing, and quality measures, with inspections weighted most heavily.
Calculator: See prices in your area
Ponce Health and Rehabilitation Center accepts Medicare, Medicaid, and private pay.

Overview of Ponce Health and Rehabilitation Center

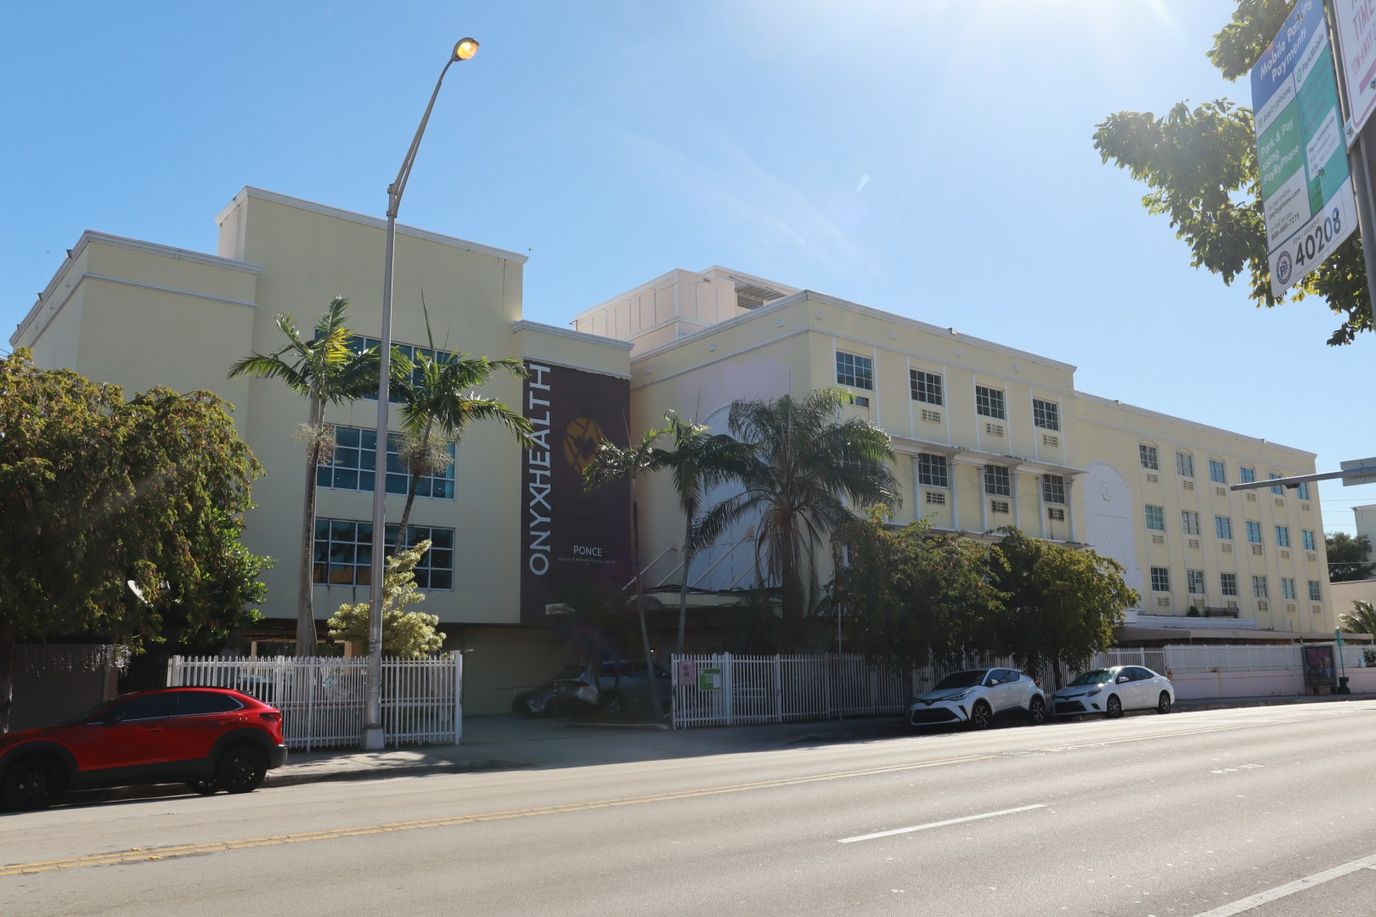
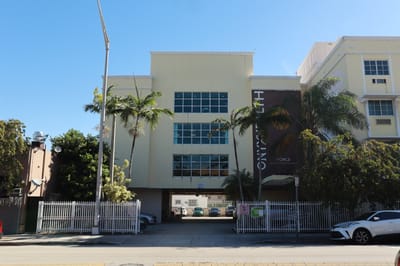
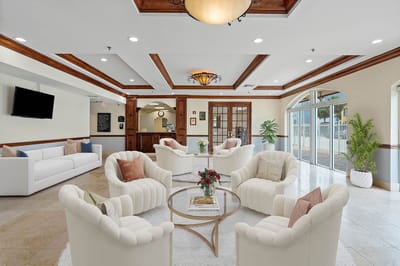
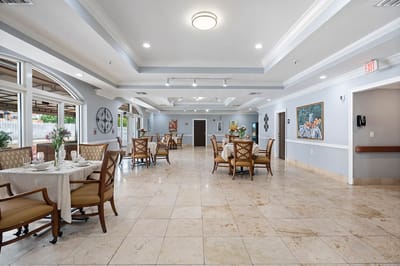
Ponce Health and Rehabilitation Center is proud to be a member of the Onyx Health senior living community that boasts an upscale lifestyle. As an Onyx Health home, Ponce Health and Rehabilitation Center practices contemporary forward-thinking lifestyle care. The nursing and rehabilitation community is considerably one of the best in its class brought by their progressive approach to rehabilitative care. Ponce Health and Rehabilitation Center boasts their innovative and modern approach to senior care; they have ensured that they provide a spectrum of care as they understand the unique needs of each individual.
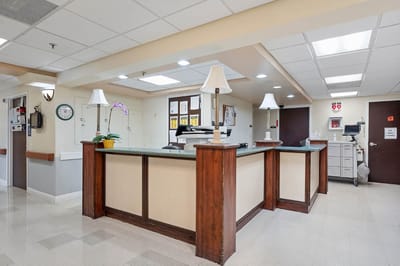
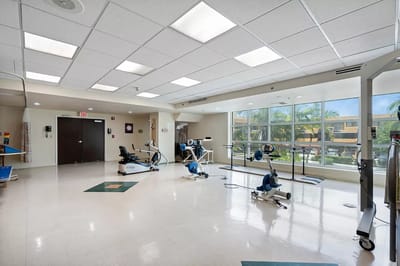
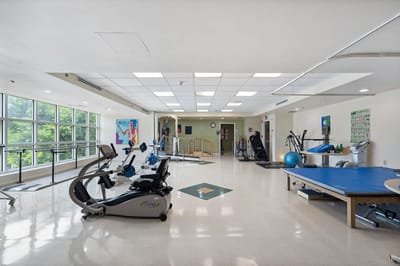
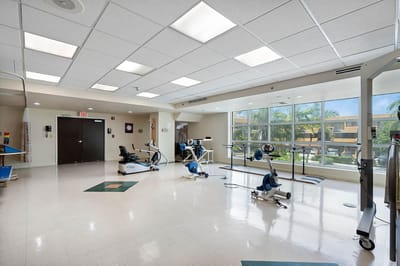
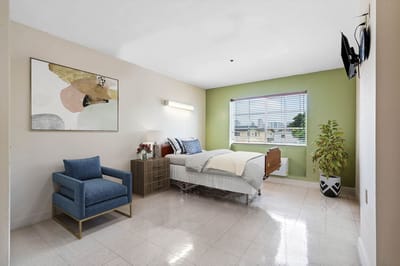
As an Onyx Health senior living community, Ponce Health provides premier essential amenities and services designed to accommodate and attend to any need that comes up. They offer skilled post-acute nursing, customized rehabilitation programs, and long-term care services. Other community features exclusively offer private and semi-private rooms, restaurant-style dining, and scheduled transportation services. A beautiful interior structured into the building immediately gives off a relaxing ambiance the moment one steps inside the community.

(305) 545-6695

Quality ratings

Measured by Centers for Medicare & Medicaid Services (CMS)

Overall rating Info The Overall CMS Rating combines results from health inspections, staffing levels and quality measures. Health inspections carry the most weight. Staffing and quality scores can increase or decrease the final rating based on performance compared to state and national standards.
▲ 57.5% Above FL avg. ▲ 57.5% Above FL avg.FL average: 3.2Click the badge to see the full State ranking.Click here to see the full State ranking.
Health Inspection Info Based on the results of the facility's three most recent standard inspections and any complaint investigations. CMS reviews the number, scope, and severity of deficiencies, with more recent findings weighted more heavily.
▲ 42.3% Above FL avg. ▲ 42.3% Above FL avg.FL average: 2.8Click the badge to see the full State ranking.Click here to see the full State ranking.
Staffing Info Measures average nursing staff hours per resident per day, including Registered Nurses (RNs) and total nursing staff. Ratings are adjusted based on the level of care residents require and are compared to state and national benchmarks.
▲ 18.2% Above FL avg. ▲ 18.2% Above FL avg.FL average: 3.4Click the badge to see the full State ranking.Click here to see the full State ranking.
Quality Measures Info Based on clinical and physical health indicators reported to CMS, such as hospital readmissions, falls, pressure ulcers, and improvements in mobility. These measures reflect how well residents' health needs are being managed.
▲ 23.2% Above FL avg. ▲ 23.2% Above FL avg.FL average: 4.1Click the badge to see the full State ranking.Click here to see the full State ranking.

Staffing hours breakdown

Info Daily nursing hours per resident by staff type, reported to CMS. Higher is generally better — compare this facility to state and national averages to see where staffing stands.

Hours per resident per day — compared to Florida state averages

Total nursing care / resident Info This home is ranked 216th out of 253 homes in Florida for nurse hours. Total adjusted nursing hours per resident per day, combining RN, LPN, and aide time. CMS adjusts this for case-mix so facilities can be fairly compared.
3h 31m per day
Rank #216 / 253Nurse hours — State benchmarkedThis home is ranked 216th out of 253 homes in Florida. Shows adjusted nurse hours per resident per day benchmarked to the Florida average, with a ranking across 253 Florida facilities. More hours mean more direct care. The national average is about 3.5 hrs; below 3.0 is a red flag.Rankings are based only on facilities in Florida that report data for that category. Facilities without available data are excluded from the ranking.Click the rank badge to see the full State ranking.Click here to see the full State ranking.
This facility Florida avg (4h 2m per day)
vs Florida avg
-13%

3 of 6 metrics below state avg

Standout metric Weekend RN is +97% above state avg
Staff typeHours / Day / Residentvs state avg
Registered Nurse (RN) Info RNs hold the highest nursing license and can assess residents, interpret test results, and direct care plans. More RN hours per day often signals stronger clinical oversight and faster response to health changes. 1h 16m per day ▲ 72% State avg: 44m per day · National avg: 41m per day
LPN / LVN Info Licensed Practical Nurses (LPNs) or Licensed Vocational Nurses (LVNs) deliver routine hands-on care — medication administration, wound dressing, and monitoring vital signs. They work under RN supervision and make up a large share of daily bedside care. 17m per day ▼ 65% State avg: 47m per day · National avg: 52m per day
Nurse Aide Info Certified Nurse Aides (CNAs) provide the most direct day-to-day assistance: bathing, dressing, feeding, and mobility. Nurse aide hours are typically the largest staffing category and directly affect residents' quality of life. 2h 16m per day ▼ 3% State avg: 2h 20m per day · National avg: 2h 21m per day
Weekend Total Nursing Info Combined nursing hours (RN + LPN + Nurse Aide) per resident per day on weekends. Staffing often drops on weekends — this figure reveals whether the facility maintains adequate coverage outside of weekday hours. 3h 33m per day ■ Avg State avg: 3h 31m per day · National avg: 3h 26m per day
Physical Therapist Info Hours per resident per day provided by licensed Physical Therapists (PTs) or PT Assistants. PT services help residents recover mobility after injury or illness and are especially important for post-acute (short-stay) rehabilitation. 5m per day ▼ 9% State avg: 5m per day · National avg: 4m per day
Weekend RN Info Registered nurse hours specifically on weekends. Facilities sometimes reduce RN presence on Saturdays and Sundays — a low weekend RN figure compared to weekday hours can indicate reduced clinical oversight when most administrative staff are absent. 1h 3m per day ▲ 97% State avg: 32m per day · National avg: 29m per day

Capacity and availability

This home usually has limited availability

Higher occupancy than the Florida average: 84.3%
Occupancy rate
94.6% Rank #33 / 258Occupancy rate — State benchmarkedThis home is ranked 33rd out of 258 homes in Florida. Shows this facility's occupancy rate versus the Florida average, with its Statewide rank out of 258. Higher occupancy signals strong local demand and financial stability.Rankings are based only on facilities in Florida that report data for that category. Facilities without available data are excluded from the ranking.Click the rank badge to see the full State ranking.Click here to see the full State ranking.
Avg. Length of Stay
81 days
Bed community size
147-bed community Rank #153 / 1074Bed count — State benchmarkedThis home is ranked 153rd out of 1074 homes in Florida. Shows this facility's certified or reported bed count compared to other Florida facilities. Larger communities may offer more amenities, programs, and on-site services for residents and families.Rankings are based only on facilities in Florida that report data for that category. Facilities without available data are excluded from the ranking.Click the rank badge to see the full State ranking.Click here to see the full State ranking.
A larger shared setting that may offer more common spaces and organized community services.
Walk Score
Walk Score: 95 / 100 Rank #15 / 1486Walk Score — State benchmarkedThis home is ranked 15th out of 1486 homes in Florida. Shows how walkable this facility's neighborhood is compared to the average Walk Score across Florida facilities. Higher scores benefit residents, families, and staff.Rankings are based only on facilities in Florida that report data for that category. Facilities without available data are excluded from the ranking.Click the rank badge to see the full State ranking.Click here to see the full State ranking.
Walker's paradise. Daily errands do not require a car, with many shops and services nearby.
BBB Rating
BBB Rating: A+ (Not Accredited)
An independent rating from the Better Business Bureau based on factors such as complaint history, transparency, and business practices.
How BBB ratings work

About this community

License Details

CMS Certification Number106021

Staffing

Key information about the people who lead and staff this community.

Leadership

ContactMr. Ron Lowy, President/Director

Therapy & Rehabilitation

2 services
Rehabilitation Services
Respite Care

Staffing & Medical

1 service
24-Hour Staffing

Amenities & Lifestyle

Specific Programs24-Hour Skilled Nursing, Nutrition Services, Enteral Nutrition, Hospice/Respite Care, Post-Stroke Care, Neuropsychology with Cognitive Therapy, IV Therapy, Sports Medicine Rehabilitation, Pulmonary Care, In-House Dialysis, Advanced Wound Care, Trach Care, Cardiac Recovery, Social Services + Discharge Planning

Contact Ponce Health and Rehabilitation Center

Inspection History

In Florida, the Agency for Health Care Administration (AHCA) is the primary authority that conducts unannounced inspections and completes official health quality reports for all healthcare facilities.

Since 2022 · 4 years of data 13 citations
We don't publish a score for nursing homes with fewer than three inspections on record. This would unfairly reward providers with limited inspection history or those that have not been operating long enough to be cited.

Inspection score unavailable

Not enough inspection history to generate a score.

Average score for Florida nursing homes: B 83/100

Inspection score not available. Not enough inspection history to score against the Florida benchmark.

Inspection Scorecard Info This scorecard compares key inspection, citation, and complaint metrics at this facility against the Florida state average. Metrics rated ≥15% worse than average are highlighted in red; those ≥15% better are highlighted in green.

Since 2022 vs. Florida state average
Overall vs. FL average 0 Worse No metrics in this bucket. 2 Better Metrics better than Florida average:
• Total citations (61% below)
• Citations per year (60% below)
Latest Inspection May 15, 2025 Routine

Citations Info Citations are formal regulatory issues recorded during state inspections.

This FacilityFL Averagevs. FL Avg
Total citations Info Formal regulatory issues recorded by inspectors across all inspection types. 1333 This facility has 61% fewer total citations than a typical Florida nursing home (13 vs. FL avg 33).↓ 61% better Rank #1 / 919 Total citations — State benchmarked This home is ranked 1st out of 919 homes in Florida. Shows this facility's total citations compared to the Florida average among 919 comparable communities in the ranking pool. Rankings are based only on facilities in Florida that report data for that category. Facilities without available data are excluded from the ranking.
Citations per year Info Average citations per year since 2022. 3.38.3 This facility has 60% fewer citations per year than a typical Florida nursing home (3.3 vs. FL avg 8.3).↓ 60% better

Inspection Reports Summary Info An editor-reviewed summary of the themes and findings across this facility's recent inspection reports.

  • August 3, 2023 annual inspection found no health deficiencies.
  • October 20, 2022 inspection cited seven deficiencies including medication errors over 11%, poor tracheostomy care, nutrition failures, and unsecured medication storage.
  • May 15, 2025 inspection found repeated PASARR screening failures and infection control lapses with storage of respiratory equipment.

Health Inspection History

Inspections since 2022
Total health inspections 3

Florida average 4.3


Last Health inspection on May 2025

Total health citations
13 Rank #73 / 252Health citations — State benchmarkedThis home is ranked 73rd out of 252 homes in Florida. Shows this facility's total health deficiency citations benchmarked to the Florida State average, with a ranking across all 252 FL facilities. Lower citation counts earn a better rank.Rankings are based only on facilities in Florida that report data for that category. Facilities without available data are excluded from the ranking.Click the rank badge to see the full State ranking.Click here to see the full State ranking.

Florida average 19.7

Citations per inspection
4.33 Rank #129 / 252Citations per inspection — State benchmarkedThis home is ranked 129th out of 252 homes in Florida. Shows average deficiency citations per CMS inspection for this facility versus the Florida mean across 252 facilities with citation data. Lower is better.Rankings are based only on facilities in Florida that report data for that category. Facilities without available data are excluded from the ranking.Click the rank badge to see the full State ranking.Click here to see the full State ranking.

Florida average 4.48


Health citations are formal notices following inspections when they fail to comply with safety and care standards.

All 13 citations resulted from standard inspections.

Breakdown of citation severity (last 4 years)
Critical health citations
0
100% better than Florida average

Florida average: 0.8


Serious health citations
0
100% better than Florida average

Florida average: 0.4

0 critical citations Florida average: 0.8

0 serious citations Florida average: 0.4

13 moderate citations Florida average: 18.4

0 minor citations Florida average: 0.2
Citations history (last 4 years)
Administration moderate citation May 15, 2025
Corrected

Infection Control moderate citation May 15, 2025
Corrected

Care Planning moderate citation May 15, 2025
Corrected

Pharmacy moderate citation Dec 21, 2023
Corrected

Staffing Data

Reporting period: October 1 – December 31, 2025 (Q4 2025). Source: CMS Payroll-Based Journal report.

Total staff 172
Employees 164
Contractors 8
Staff to resident ratio 4.41 : 1
199% more staff per resident than Florida average
Florida average ratio: 1.47 : 1 Florida average ratio: 1.47 : 1See full Florida ranking
Avg staff/day 82
Average shift 7.7 hours
0% compared with Florida average
Florida average: 7.9 hours Florida average shift: 7.9 hoursSee full Florida ranking
Total staff hours (quarter) 57,843

Nursing staff breakdown

Q4 2025 · Oct 1 – Dec 31 More info This data comes from the CMS Payroll-Based Journal report covering October 1 – December 31, 2025.
Registered Nurse

Manages medical care and health needs.

RN Staff Info All 45 RN Staff are full-time employees. No contractors work on this role. 45
Average shift length Info Average shift length. Calculated as total hours divided by days worked and average staff per day. 7.9 hours
Licensed Practical Nurse

Assists with medical care and medications.

LPN Staff Info All 8 LPN Staff are full-time employees. No contractors work on this role. 8
Average shift length Info Average shift length. Calculated as total hours divided by days worked and average staff per day. 8.6 hours
Certified Nursing Assistant

Helps with daily care and mobility.

CNA Staff Info All 73 CNA Staff are full-time employees. No contractors work on this role. 73
Average shift length Info Average shift length. Calculated as total hours divided by days worked and average staff per day. 7.8 hours

Contractor staffing

Q4 2025 · Oct 1 – Dec 31 More info This data comes from the CMS Payroll-Based Journal report covering October 1 – December 31, 2025.

Total hours from contractors

1.4%

817 contractor hours this quarter

Physical Therapy Assistant: 3 Qualified Social Worker: 2 Respiratory Therapy Technician: 1 Medical Director: 1 Occupational Therapy Assistant: 1

Staff by category

Q4 2025 · Oct 1 – Dec 31 More info This data comes from the CMS Payroll-Based Journal report covering October 1 – December 31, 2025.
Certified Nursing Assistant7307328,51492100%7.8
Registered Nurse4504514,02092100%7.9
Licensed Practical Nurse8083,45392100%8.6
Dietitian7072,42892100%8
Speech Language Pathologist8081,8828289%6.1
Clinical Nurse Specialist4041,3516672%8.4
Physical Therapy Assistant3361,0668289%7.2
Respiratory Therapy Technician3149527986%6.2
Physical Therapy Aide3038107278%6.1
Qualified Social Worker3257777582%6.1
Occupational Therapy Aide3036226470%6.7
Dental Services Staff1014986267%8
Mental Health Service Worker1014725964%8
Administrator1014645863%8
Nurse Practitioner1014645863%8
Occupational Therapy Assistant0114189%5.1
Medical Director011302426%1.3
73 Certified Nursing Assistant
% of Days 100%
45 Registered Nurse
% of Days 100%
8 Licensed Practical Nurse
% of Days 100%
7 Dietitian
% of Days 100%
8 Speech Language Pathologist
% of Days 89%
4 Clinical Nurse Specialist
% of Days 72%
6 Physical Therapy Assistant
% of Days 89%
4 Respiratory Therapy Technician
% of Days 86%
3 Physical Therapy Aide
% of Days 78%
5 Qualified Social Worker
% of Days 82%
3 Occupational Therapy Aide
% of Days 70%
1 Dental Services Staff
% of Days 67%
1 Mental Health Service Worker
% of Days 64%
1 Administrator
% of Days 63%
1 Nurse Practitioner
% of Days 63%
1 Occupational Therapy Assistant
% of Days 9%
1 Medical Director
% of Days 26%

Penalties and fines

Federal penalties imposed by CMS for regulatory violations, including civil money penalties (fines) and denials of payment for new Medicare/Medicaid admissions.

Source: CMS Penalties Database

No penalties in the past 3 years

No civil money penalties or payment denials were reported in the last 3 years.

Quality of care over time

These measures show how residents usually do over time at this home, based on health outcomes and preventive care.

High-risk clinical events score Info A composite score based on pressure ulcers, falls with injury, weight loss, walking ability decline, and activities of daily living decline. 4.9
34% better than Florida average

Florida average: 7.4

Functional decline score Info A composite score based on activities of daily living decline, walking ability decline, and incontinence. 4.0
68% better than Florida average

Florida average: 12.4

Long-stay resident measures
Significantly above average Florida avg: 4.5 Info CMS star rating based on long-stay quality measure performance. 5 stars = significantly above average, 1 star = significantly below average.
Need for Help with Daily Activities Increased Info Percent of long-stay residents whose need for help with daily activities has increased 7.9%
25% better than Florida average

Florida average: 10.5%

Walking Ability Worsened Info Percent of long-stay residents whose ability to move independently worsened 3.4%
74% better than Florida average

Florida average: 12.9%

Low Risk Residents with Bowel/Bladder Incontinence Info Percent of low risk long-stay residents who lose control of their bowels or bladder 0.7%
95% better than Florida average

Florida average: 13.5%

Falls with Major Injury Info Percent of long-stay residents experiencing one or more falls with major injury 1.7%
37% better than Florida average

Florida average: 2.6%

High Risk Residents with Pressure Ulcers Info Percent of long-stay high risk residents with pressure ulcers 2.5%
54% better than Florida average

Florida average: 5.4%

Urinary Tract Infection Info Percent of long-stay residents with a urinary tract infection 0.0%
100% better than Florida average

Florida average: 0.9%

Lost Too Much Weight Info Percent of long-stay residents who lose too much weight 9.1%
52% worse than Florida average

Florida average: 6.0%

Depressive Symptoms Info Percent of long-stay residents who have depressive symptoms 11.5%
244% worse than Florida average

Florida average: 3.3%

Antipsychotic Use Info Percent of long-stay residents who received an antipsychotic medication 9.0%
12% worse than Florida average

Florida average: 8.0%

Pneumococcal Vaccine Info Percent of long-stay residents assessed and appropriately given the pneumococcal vaccine 100.0%
In line with Florida average

Florida average: 97.7%

Influenza Vaccine Info Percent of long-stay residents assessed and appropriately given the seasonal influenza vaccine 100.0%
In line with Florida average

Florida average: 99.2%

Hospitalizations per 1,000 days Info Number of hospitalizations per 1,000 long-stay resident days. 2.69
28% worse than Florida average

Florida average: 2.10

ED visits per 1,000 days Info Number of outpatient emergency department visits per 1,000 long-stay resident days. 0.52
56% better than Florida average

Florida average: 1.18

Short-stay resident measures
Average Florida avg: 3.1 Info CMS star rating based on short-stay quality measure performance. 5 stars = much above average, 1 star = much below average.
Pneumococcal Vaccine Info Percent of short-stay residents assessed and appropriately given the pneumococcal vaccine 100.0%
6% better than Florida average

Florida average: 94.0%

Antipsychotic medication increase Info Percent of short-stay residents who newly received an antipsychotic medication 1.5%
In line with Florida average

Florida average: 1.5%

Influenza Vaccine Info Percent of short-stay residents assessed and appropriately given the seasonal influenza vaccine 100.0%
6% better than Florida average

Florida average: 94.7%

Re-hospitalized after SNF stay Info Percentage of short-stay residents who were re-hospitalized after their nursing home admission. 27.7%
6% worse than Florida average

Florida average: 26.2%

Emergency department visits Info Percentage of short-stay residents who had an outpatient emergency department visit. 5.0%
46% better than Florida average

Florida average: 9.3%

Falls with major injury Info Percentage of SNF residents who experience falls with major injury during their stay. 1.4%
82% worse than Florida average

Florida average: 0.8%

Ability to care for self at discharge Info Percentage of residents at or above expected ability to care for themselves at discharge. 49.3%
8% worse than Florida average

Florida average: 53.7%

Successful return to home or community Info Rate of successful return to home or community from a skilled nursing facility. 36.5%
28% worse than Florida average

Florida average: 50.6%

Breakdown by payment type

Medicare

29% of new residents, usually for short-term rehab.

Typical stay 1 months

Private pay

50% of new residents, often for short stays.

Typical stay 1 - 2 months

Medicaid

21% of new residents, often for long-term daily care.

Typical stay 5 - 6 months

Facility Characteristics

Source: CMS Long-Term Care Facility Characteristics (Data as of Jan 2026)

Total residents 39
Medicare
16
41% of residents
Medicaid
11
28.2% of residents
Private pay or other
12
30.8% of residents
Programs & Services
Residents Group

Residents meet regularly to discuss policies, care quality, and activities

Nurse Aide Training

State-approved Nurse Aide Training and Competency Evaluation Program on-site

Active Resident Council

Organized group of residents that meets regularly to discuss facility policies, quality of life, and activities.

Finances and operations

Based on CMS SNF Cost Report for fiscal year ending in 12/2023.

Privately-owned community
Operated by a single business entity.
Net patient revenue Info Net patient revenue — what the home actually collects for resident care, after contractual allowances, bad debt and discounts are subtracted from its gross charges (CMS cost report, Worksheet G-3). It covers resident care only; money the home earns from other sources is shown separately as "Other income."
$17.8M
Net patient income Info Net patient income: net patient revenue minus the home's total operating expenses. A positive figure means it earns more from resident care than it spends to deliver it; a negative figure means the opposite. It excludes non-operating "other income."
$2.3M
Privately-owned community Operated by a single business entity.
Net patient revenue Info Net patient revenue — what the home actually collects for resident care, after contractual allowances, bad debt and discounts are subtracted from its gross charges (CMS cost report, Worksheet G-3). It covers resident care only; money the home earns from other sources is shown separately as "Other income."
$17.8M Rank #86 / 257Revenue — State benchmarkedThis home is ranked 86th out of 257 homes in Florida. Shows this facility's annual revenue compared to the Florida average. Higher revenue generally means more resources for staffing and capital — read alongside Payroll %.Rankings are based only on facilities in Florida that report data for that category. Facilities without available data are excluded from the ranking.Click the rank badge to see the full State ranking.Click here to see the full State ranking.
Net patient income Info Net patient income: net patient revenue minus the home's total operating expenses. A positive figure means it earns more from resident care than it spends to deliver it; a negative figure means the opposite. It excludes non-operating "other income."
$2.3M
Other income Info Money the home earns outside of resident care — such as investments, grants, rentals and other non-operating sources (CMS cost report, Worksheet G-3). It is tracked separately from net patient revenue: it is not part of that figure, and it is not included in net patient income.
$1.6K
Payroll costs Info Staff salaries plus wage-related costs — benefits such as payroll taxes, health insurance and retirement — from the home's own accounting records (CMS cost report, Worksheet A). Contract or agency labor is counted separately, under other operating costs. Rank #118 / 257Payroll — State benchmarkedThis home is ranked 118th out of 257 homes in Florida. Shows total annual staff payroll benchmarked to the Florida average. Higher payroll investment relative to peers often signals better staffing and less reliance on cheaper contract labor.Rankings are based only on facilities in Florida that report data for that category. Facilities without available data are excluded from the ranking.Click the rank badge to see the full State ranking.Click here to see the full State ranking.
$8.3M 46.7% of net patient revenue Info Payroll as a share of revenue: staff salaries and wage-related benefits divided by net patient revenue. A higher figure means more of each revenue dollar goes to staff pay. Rank #204 / 257Payroll % — State benchmarkedThis home is ranked 204th out of 257 homes in Florida. Shows payroll as a percentage of revenue versus the Florida average. Well-run Florida facilities typically land around 49–56% — the top third Statewide. Below 25% may signal understaffing or heavy agency use — read with Staffing ratings.Rankings are based only on facilities in Florida that report data for that category. Facilities without available data are excluded from the ranking.Click the rank badge to see the full State ranking.Click here to see the full State ranking.
Other operating costs Info Everything it costs to run the home apart from payroll — food, utilities, supplies, maintenance, contract labor and administration. Calculated as total operating expense minus payroll (staff salaries and wage-related benefits).
$7.2M
Total costs Info The home's total operating expense for the year — all the costs of running it, salaries included (CMS cost report, Worksheet G-3).
$15.5M

Who this home usually serves

TYPE OF STAY

Mix of rehab and long-term care

This home supports both short-term rehab and long-term care, with residents staying for a wide range of durations.

Most new residents arrive under private pay (50% of admissions), and a typical private pay stay runs around 1 - 2 months.

Admissions
712 total

Coverage residents most often arrive under.

Medicare 29%
Private pay 50%
Medicaid 21%
Discharges
619 total

Coverage residents most often leave under.

Medicare 19%
Private pay 59%
Medicaid 22%

Ponce Health and Rehabilitation Center Reviews

Georgina Ramirez
Disrespectful and hard to reachWhat do you like most about living here? Answer: nothing Are there enough caregivers to handle the residents' needs, especially during emergencies? Answer: No Are the common areas pleasant and comfortable for socializing or relaxing? Answer: Yes How would you rate the quality and variety of the meals? (1-5) Answer: 1 Are special diets handled well? Answer: No Is the dining schedule flexible enough to meet your preferences? Answer: No How do you feel about the level of social interaction available with other residents? Answer: How was the units offered in this community? Answer: Do you feel safe living in this community? Answer: No How well do you think the community handles emergencies or unexpected events? Answer: Are there any hidden fees or unexpected charges? Answer: Would you recommend this community to others looking for senior living options? Answer: no Is there anything you wish you knew before moving in? Answer: understaffed. Staff not interested in solving problems.

Places of interest near Ponce Health and Rehabilitation Center

Address 1.5 miles from city center Info Estimated distance in miles from Miami's city center to Ponce Health and Rehabilitation Center's address, calculated via Google Maps. — 2.07 miles to nearest hospital (HCA Florida Mercy Hospital)

Calculate Travel Distance to Ponce Health and Rehabilitation Center

Add your location

Address

Compare Nursing Homes around Miami

The information below is reported by the Florida Agency for Health Care Administration (AHCA).

5 facilities compared · CMS & FL Dept. of Health data

Shoreside Health and Rehabilitation Center
NH
HC
NC
RC
Miami
150
Facility 150
FL AVG 89
Rank #135 / 1074
90.7%
Facility 90.7%
FL AVG 84.3%
Rank #102 / 258
+8%
3.61
Facility 3.61
FL AVG 4.04
Rank #198 / 253
+72%-10%
$0
Facility $0
FL AVG $78.9k
Rank #1 / 258
-
21
Facility 21
FL AVG 19.7
Rank #149 / 252
5.3
Facility 5.3
FL AVG 4.5
Rank #176 / 252
-139-
61
Facility 61
FL AVG 40
Rank #337 / 1486
Sinai Opco Holdings, LLC
$16.9M
Facility $16.9M
FL AVG $15.7M
Rank #143 / 257
$8.0M
Facility $8.0M
FL AVG $6.1M
Rank #126 / 257
47.1%
Facility 47.1%
FL AVG 39.8%
Rank #101 / 257
105711
Victoria Nursing & Rehabilitation Center
NH
NC
Miami (Little Havana)
264
Facility 264
FL AVG 89
Rank #9 / 1074
--
3.88
Facility 3.88
FL AVG 4.04
Rank #126 / 253
+103%-4%
$0
Facility $0
FL AVG $78.9k
Rank #1 / 258
-
19
Facility 19
FL AVG 19.7
Rank #135 / 252
4.8
Facility 4.8
FL AVG 4.5
Rank #158 / 252
-51A+
87
Facility 87
FL AVG 40
Rank #53 / 1486
Ocean Bank
$40.8M
Facility $40.8M
FL AVG $15.7M
Rank #2 / 257
$26.2M
Facility $26.2M
FL AVG $6.1M
Rank #2 / 257
64.2%
Facility 64.2%
FL AVG 39.8%
Rank #231 / 257
106031
The Palace Royale at Kendall
NH
AL
HC
IL
MC
Miami
510
Facility 510
FL AVG 89
Rank #1 / 1074
95.1%
Facility 95.1%
FL AVG 84.3%
Rank #25 / 258
+13%
3.87
Facility 3.87
FL AVG 4.04
Rank #126 / 253
+55%-4%
$0
Facility $0
FL AVG $78.9k
Rank #1 / 258
94
Facility 94
FL AVG 83
Rank #162 / 876
8
Facility 8
FL AVG 19.7
Rank #32 / 252
4.0
Facility 4.0
FL AVG 4.5
Rank #112 / 252
-172-
51
Facility 51
FL AVG 40
Rank #503 / 1486
Kendall Health Care Inc
$21.2M
Facility $21.2M
FL AVG $15.7M
Rank #55 / 257
$12.9M
Facility $12.9M
FL AVG $6.1M
Rank #40 / 257
61.1%
Facility 61.1%
FL AVG 39.8%
Rank #99 / 257
105719
Ponce Health and Rehabilitation Center
NH
HC
RC
Miami (Little Havana)
147
Facility 147
FL AVG 89
Rank #153 / 1074
94.6%
Facility 94.6%
FL AVG 84.3%
Rank #33 / 258
+12%
3.52
Facility 3.52
FL AVG 4.04
Rank #216 / 253
+117%-13%
$0
Facility $0
FL AVG $78.9k
Rank #1 / 258
-
13
Facility 13
FL AVG 19.7
Rank #73 / 252
4.3
Facility 4.3
FL AVG 4.5
Rank #129 / 252
-136A+
95
Facility 95
FL AVG 40
Rank #15 / 1486
Ponce Opco Holdings, LLC
$17.8M
Facility $17.8M
FL AVG $15.7M
Rank #86 / 257
$8.3M
Facility $8.3M
FL AVG $6.1M
Rank #118 / 257
46.7%
Facility 46.7%
FL AVG 39.8%
Rank #204 / 257
106021
Jackson Memorial Long-Term Care Center
NH
Miami (Allapattah)
180
Facility 180
FL AVG 89
Rank #56 / 1074
93.4%
Facility 93.4%
FL AVG 84.3%
Rank #54 / 258
+11%
4.17
Facility 4.17
FL AVG 4.04
Rank #75 / 253
+134%+3%
$0
Facility $0
FL AVG $78.9k
Rank #1 / 258
-
8
Facility 8
FL AVG 19.7
Rank #32 / 252
4.0
Facility 4.0
FL AVG 4.5
Rank #112 / 252
-172-
82
Facility 82
FL AVG 40
Rank #89 / 1486
-
$19.0M
Facility $19.0M
FL AVG $15.7M
Rank #4 / 257
$21.2M
Facility $21.2M
FL AVG $6.1M
Rank #6 / 257
111.5%
Facility 111.5%
FL AVG 39.8%
Rank #226 / 257
105392

Financial Assistance for
Nursing Home in Florida

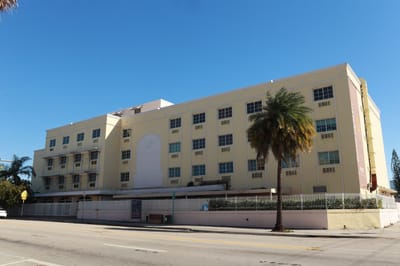
Ponce Health and Rehabilitation Center is located in Miami, Florida.
Here are the financial assistance programs available to residents in Florida.

Get Financial aid guidance

Long-Term Care Waiver

Florida Medicaid LTC Waiver

Age 65+ or 21+ disabled
General Florida resident, Medicaid- eligible, nursing home-level care need.
Income Limits (2025) ~$2,829/month 300% FBR, individual
Asset Limits $2,000 (individual), $3,000 (couple).
FL

High demand; waitlists common.

Benefits
In-home care (6-8 hours/day) Assisted living Respite (240 hours/year) Case management

Community Care for the Elderly (CCE)

Florida CCE

Age 60+
General Florida resident, at risk of nursing home.
Income Limits ~$2,000/month varies
Asset Limits $5,000 individual
FL

Limited funding; regional variation.

Benefits
Homemaker services (3-5 hours/week) Adult day care (~$60/day) Respite (up to 10 days/year)

Home Care for the Elderly (HCE)

Florida Home Care for the Elderly

Age 60+
General Florida resident, at risk of nursing home placement; caregiver must be approved.
Income Limits (2025) ~$2,829/month individual, aligned with Medicaid thresholds
Asset Limits ~$2,000 (individual); varies by case manager discretion.
FL

Limited funding (~3,500 served annually); prioritizes low-income frail seniors.

Benefits
Basic subsidy (~$160/month) for housing/medical costs; special subsidies for supplies/services (e.g., incontinence supplies, ~$50-$200/month)

Program of All-Inclusive Care for the Elderly (PACE)

Florida Medicaid PACE

Age 55+
General Florida resident, nursing home-level care need, safe with PACE support.
Income Limits (2025) ~$2,829/month 300% FBR
Asset Limits $2,000 (individual), $3,000 (couple).
FL

Limited to specific counties (e.g., Hillsborough, Miami-Dade); ~10 sites statewide.

Benefits
Personal care (5-7 hours/day) Medical care Meals Transportation Therapy

Optional State Supplementation (OSS)

Florida Optional State Supplementation

Age 65+ or disabled
General Florida resident, living in approved facility, receiving SSI or low-income.
Income Limits (2025) ~$1,004/month individual, including SSI
Asset Limits $2,000 (individual), $3,000 (couple).
FL

Limited to specific facility types; ~$78.40/month max supplement.

Benefits
Cash payment (~$78.40/month) for room/board or personal needs in facilities

Frequently Asked Questions about Ponce Health and Rehabilitation Center

What neighborhood is Ponce Health and Rehabilitation Center in?

Ponce Health and Rehabilitation Center is in the Little Havana neighborhood of Miami.

Is Ponce Health and Rehabilitation Center in a walkable area?

Ponce Health and Rehabilitation Center has a walk score of 95. Walker's paradise. Daily errands do not require a car, with many shops and services nearby.

What is the occupancy rate at Ponce Health and Rehabilitation Center?

Ponce Health and Rehabilitation Center's occupancy is 93.4%.

Are there photos of Ponce Health and Rehabilitation Center?

Yes — there are 12 photos of Ponce Health and Rehabilitation Center in the photo gallery on this page.

What is the address of Ponce Health and Rehabilitation Center?

Ponce Health and Rehabilitation Center is located at 335 Sw 12Th Ave, Miami, FL 33130.

What is the phone number of Ponce Health and Rehabilitation Center?

(305) 545-6695 will put you in contact with the team at Ponce Health and Rehabilitation Center.

Is Ponce Health and Rehabilitation Center Medicare or Medicaid certified?

Yes — Ponce Health and Rehabilitation Center is a CMS-certified provider of Medicare and Medicaid.

Guides for Better Senior Living

Care Cost Calculator: See Prices in Your Area

Nursing Home Data Explorer

Don’t Wait Too Long: 7 Red Flag Signs Your Parent Needs Assisted Living Now

The True Cost of Assisted Living in 2025 – And How Families Are Paying For It

Understanding Senior Living Costs: Pricing Models, Discounts & Financial Assistance