


Total staff
178
Employees
162
Contractors
16
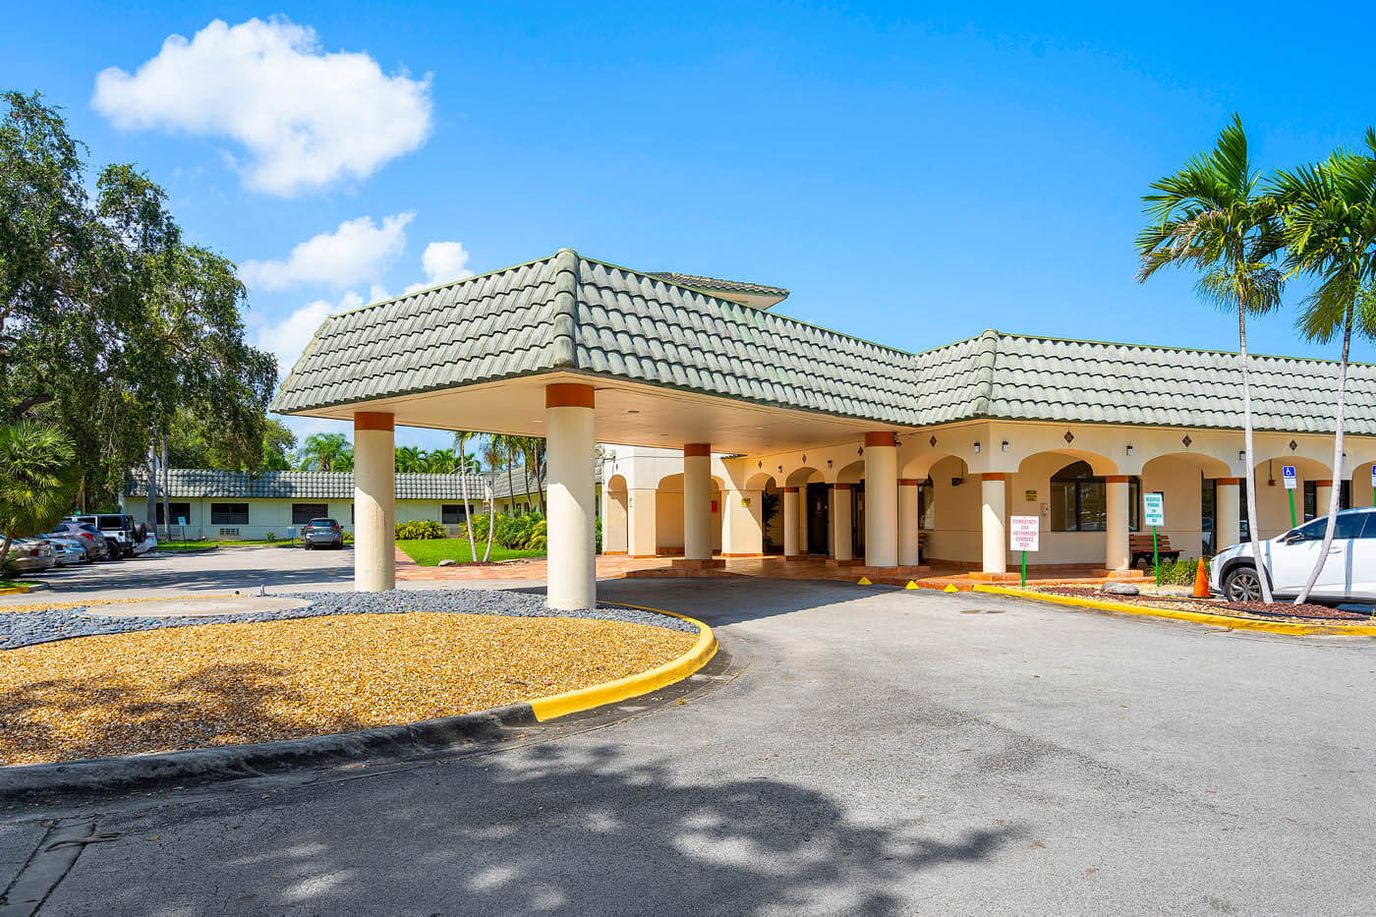
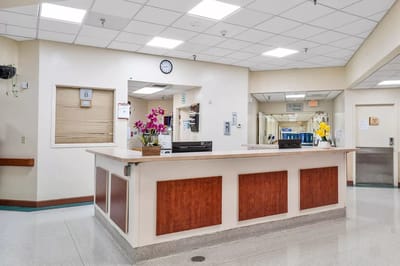
Ideally located in the charming neighborhood of Miami, FL, Shoreside Health and Rehabilitation Center is a reliable senior care provider that offers excellent skilled nursing, premium short term, rehabilitative, and long term care services. The community ensures residents receive the care and support they need to thrive and recover successfully from their hospitalization through its wide array of specialized services, from 24-hour nursing care to social services and discharge planning. A team of trusted care experts are always on standby to make sure residents are well-cared for in a comfortable healing environment.
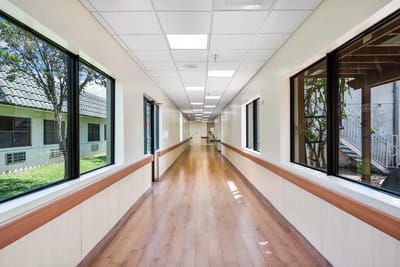
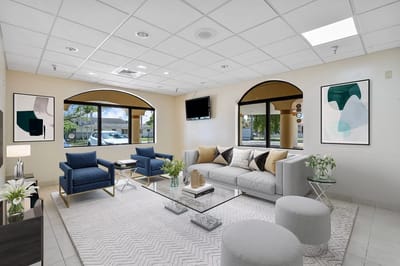
Offering a world-class approach to short-term therapy, the community features a well-equipped therapy gym, state of the art equipment, and a highly-skilled team of therapists. The community ensures residents enjoy plenty of opportunities for fun, entertainment and socialization even as they recover with a vibrant array of daily activities and social events. Fine restaurant-style dining is also offered to guarantee residents eat healthy and right on time during their stay within the community.
| Staff type | Hours / Day / Resident | vs state avg |
|---|---|---|
|
Registered Nurse (RN)
| 49m per day | ▲ 12% State avg: 44m per day · National avg: 41m per day |
|
LPN / LVN
| 36m per day | ▼ 24% State avg: 47m per day · National avg: 52m per day |
|
Nurse Aide
| 2h 12m per day | ▼ 6% State avg: 2h 20m per day · National avg: 2h 21m per day |
|
Weekend Total Nursing
| 3h 24m per day | ▼ 3% State avg: 3h 31m per day · National avg: 3h 26m per day |
|
Physical Therapist
| 3m per day | ▼ 44% State avg: 5m per day · National avg: 4m per day |
|
Weekend RN
| 44m per day | ▲ 37% State avg: 32m per day · National avg: 29m per day |
Reporting period: October 1 – December 31, 2025 (Q4 2025). Source: CMS Payroll-Based Journal report.
Manages medical care and health needs.
Assists with medical care and medications.
Helps with daily care and mobility.
Total hours from contractors
1,389 contractor hours this quarter
| Certified Nursing Assistant | 79 | 0 | 79 | 27,993 | 92 | 100% | 7.7 |
| Registered Nurse | 37 | 0 | 37 | 9,512 | 92 | 100% | 7.4 |
| Licensed Practical Nurse | 25 | 0 | 25 | 7,256 | 92 | 100% | 7.1 |
| Dietitian | 3 | 0 | 3 | 1,148 | 92 | 100% | 7.5 |
| Speech Language Pathologist | 3 | 2 | 5 | 858 | 79 | 86% | 6.1 |
| Physical Therapy Aide | 2 | 5 | 7 | 740 | 78 | 85% | 4.1 |
| Clinical Nurse Specialist | 2 | 0 | 2 | 620 | 61 | 66% | 6.1 |
| Respiratory Therapy Technician | 2 | 1 | 3 | 596 | 69 | 75% | 6.9 |
| Occupational Therapy Aide | 3 | 0 | 3 | 512 | 64 | 70% | 5.6 |
| Mental Health Service Worker | 1 | 0 | 1 | 419 | 58 | 63% | 7.2 |
| Administrator | 1 | 0 | 1 | 338 | 53 | 58% | 6.4 |
| Qualified Social Worker | 1 | 2 | 3 | 307 | 43 | 47% | 5.6 |
| Nurse Practitioner | 1 | 0 | 1 | 302 | 51 | 55% | 5.9 |
| RN Director of Nursing | 1 | 0 | 1 | 286 | 55 | 60% | 5.2 |
| Physical Therapy Assistant | 1 | 4 | 5 | 206 | 55 | 60% | 3.2 |
| Occupational Therapy Assistant | 0 | 1 | 1 | 76 | 12 | 13% | 6.3 |
| Medical Director | 0 | 1 | 1 | 60 | 19 | 21% | 3.2 |
Federal penalties imposed by CMS for regulatory violations, including civil money penalties (fines) and denials of payment for new Medicare/Medicaid admissions.
Source: CMS Penalties Database
No penalties in the past 3 years
No civil money penalties or payment denials were reported in the last 3 years.
These measures show how residents usually do over time at this home, based on health outcomes and preventive care.
Florida average: 7.4
Florida average: 12.4
Florida average: 10.5%
Florida average: 12.9%
Florida average: 13.5%
Florida average: 2.6%
Florida average: 5.4%
Florida average: 0.9%
Florida average: 6.0%
Florida average: 3.3%
Florida average: 8.0%
Florida average: 97.7%
Florida average: 99.2%
Florida average: 2.10
Florida average: 1.18
Florida average: 94.0%
Florida average: 1.5%
Florida average: 94.7%
Florida average: 26.2%
Florida average: 9.3%
Florida average: 0.8%
Florida average: 53.7%
Quality measures are calculated from Minimum Data Set (MDS) assessments. For most measures, lower percentages indicate better care quality.
37% of new residents, usually for short-term rehab.
23% of new residents, often for short stays.
40% of new residents, often for long-term daily care.
Source: CMS Long-Term Care Facility Characteristics (Data as of Jan 2026)
Residents meet regularly to discuss policies, care quality, and activities
Organized group of residents that meets regularly to discuss facility policies, quality of life, and activities.
Data sourced from CMS Long-Term Care Facility Characteristics quarterly report. Payer mix reflects the current resident census by primary payment source.
Historical financial and operational data for Shoreside Health and Rehabilitation Center from 2011–2023, based on CMS SNF Cost Reports.
Based on CMS SNF Cost Report for fiscal year ending in 12/2023.
Building Type: Single-story
Most residents stay for extended periods and receive ongoing daily care.
New residents most often arrive under Medicaid (40% of admissions), and a typical Medicaid stay runs around 8 - 9 months.
Coverage residents most often arrive under.
Coverage residents most often leave under.
![]() 8.1 miles from city center
8.1 miles from city center
![]() Estimated distance in miles from Miami's city center to Shoreside Health and Rehabilitation Center's address, calculated via Google Maps.
— 1.84 miles to nearest hospital (North Shore Medical Center)
Estimated distance in miles from Miami's city center to Shoreside Health and Rehabilitation Center's address, calculated via Google Maps.
— 1.84 miles to nearest hospital (North Shore Medical Center)
Add your location
The information below is reported by the Florida Agency for Health Care Administration (AHCA).
| Shoreside Health and Rehabilitation Center | NH HC NC RC | Miami | 150
Facility
150
FL AVG
89
Rank
#135 / 1074 |
90.7%
Facility
90.7%
FL AVG
84.3%
Rank
#102 / 258 | +8% | 3.61
Facility
3.61
FL AVG
4.04
Rank
#198 / 253 | +72% | -10% | $0
Facility
$0
FL AVG
$78.9k
Rank
#1 / 258 | - | 21
Facility
21
FL AVG
19.7
Rank
#149 / 252 | 5.3
Facility
5.3
FL AVG
4.5
Rank
#176 / 252 | - | 139 | - |
61
Facility
61
FL AVG
40
Rank
#337 / 1486 | Sinai Opco Holdings, LLC | $16.9M
Facility
$16.9M
FL AVG
$15.7M
Rank
#143 / 257 | $8.0M
Facility
$8.0M
FL AVG
$6.1M
Rank
#126 / 257 | 47.1%
Facility
47.1%
FL AVG
39.8%
Rank
#101 / 257 | 105711 | ||||
| Victoria Nursing & Rehabilitation Center | NH NC | Miami (Little Havana) | 264
Facility
264
FL AVG
89
Rank
#9 / 1074 | - | - | 3.88
Facility
3.88
FL AVG
4.04
Rank
#126 / 253 | +103% | -4% | $0
Facility
$0
FL AVG
$78.9k
Rank
#1 / 258 | - | 19
Facility
19
FL AVG
19.7
Rank
#135 / 252 | 4.8
Facility
4.8
FL AVG
4.5
Rank
#158 / 252 | - | 51 | A+ |
87
Facility
87
FL AVG
40
Rank
#53 / 1486 | Ocean Bank | $40.8M
Facility
$40.8M
FL AVG
$15.7M
Rank
#2 / 257 | $26.2M
Facility
$26.2M
FL AVG
$6.1M
Rank
#2 / 257 | 64.2%
Facility
64.2%
FL AVG
39.8%
Rank
#231 / 257 | 106031 | ||||
| The Palace Royale at Kendall | NH AL HC IL MC | Miami | 510
Facility
510
FL AVG
89
Rank
#1 / 1074 |
95.1%
Facility
95.1%
FL AVG
84.3%
Rank
#25 / 258 | +13% | 3.87
Facility
3.87
FL AVG
4.04
Rank
#126 / 253 | +55% | -4% | $0
Facility
$0
FL AVG
$78.9k
Rank
#1 / 258 | 94
Facility
94
FL AVG
83
Rank
#162 / 876 | 8
Facility
8
FL AVG
19.7
Rank
#32 / 252 | 4.0
Facility
4.0
FL AVG
4.5
Rank
#112 / 252 | - | 172 | - |
51
Facility
51
FL AVG
40
Rank
#503 / 1486 | Kendall Health Care Inc | $21.2M
Facility
$21.2M
FL AVG
$15.7M
Rank
#55 / 257 | $12.9M
Facility
$12.9M
FL AVG
$6.1M
Rank
#40 / 257 | 61.1%
Facility
61.1%
FL AVG
39.8%
Rank
#99 / 257 | 105719 | ||||
| Blessing ALF | NH HC RC | North Miami Beach | 6
Facility
6
FL AVG
89
Rank
#930 / 1074 |
95.1%
Facility
95.1%
FL AVG
84.3%
Rank
#25 / 258 | +13% | 3.69
Facility
3.69
FL AVG
4.04
Rank
#175 / 253 | +105% | -8% | $0
Facility
$0
FL AVG
$78.9k
Rank
#1 / 258 | - | 13
Facility
13
FL AVG
19.7
Rank
#73 / 252 | 3.3
Facility
3.3
FL AVG
4.5
Rank
#73 / 252 | - | 81 | - |
86
Facility
86
FL AVG
40
Rank
#58 / 1486 | Adventura Holdings LLC | $10.5M
Facility
$10.5M
FL AVG
$15.7M
Rank
#221 / 257 | $5.6M
Facility
$5.6M
FL AVG
$6.1M
Rank
#208 / 257 | 53.4%
Facility
53.4%
FL AVG
39.8%
Rank
#45 / 257 | 105331 | ||||
| Ponce Health and Rehabilitation Center | NH HC RC | Miami (Little Havana) | 147
Facility
147
FL AVG
89
Rank
#153 / 1074 |
94.6%
Facility
94.6%
FL AVG
84.3%
Rank
#33 / 258 | +12% | 3.52
Facility
3.52
FL AVG
4.04
Rank
#216 / 253 | +117% | -13% | $0
Facility
$0
FL AVG
$78.9k
Rank
#1 / 258 | - | 13
Facility
13
FL AVG
19.7
Rank
#73 / 252 | 4.3
Facility
4.3
FL AVG
4.5
Rank
#129 / 252 | - | 136 | A+ |
95
Facility
95
FL AVG
40
Rank
#15 / 1486 | Ponce Opco Holdings, LLC | $17.8M
Facility
$17.8M
FL AVG
$15.7M
Rank
#86 / 257 | $8.3M
Facility
$8.3M
FL AVG
$6.1M
Rank
#118 / 257 | 46.7%
Facility
46.7%
FL AVG
39.8%
Rank
#204 / 257 | 106021 |
Shoreside Health and Rehabilitation Center is located in Miami, Florida.
Here are the financial assistance programs available to residents in Florida.
Shoreside Health and Rehabilitation Center has a walk score of 61. Moderately walkable. Some errands can be accomplished on foot, with a mix of nearby amenities.
Shoreside Health and Rehabilitation Center's occupancy is 90.7%.
Shoreside Health and Rehabilitation Center is registered as a for-profit.
Yes — there are 4 photos of Shoreside Health and Rehabilitation Center in the photo gallery on this page.
Shoreside Health and Rehabilitation Center is located at 201 Ne 112Th St, Miami, FL 33161.
(305) 899-4700 will put you in contact with the team at Shoreside Health and Rehabilitation Center.
Yes — Shoreside Health and Rehabilitation Center is a CMS-certified provider of Medicare and Medicaid.
Care Cost Calculator: See Prices in Your Area
Nursing Home Data Explorer
Don’t Wait Too Long: 7 Red Flag Signs Your Parent Needs Assisted Living Now
The True Cost of Assisted Living in 2025 – And How Families Are Paying For It
Understanding Senior Living Costs: Pricing Models, Discounts & Financial Assistance


