


Aventura at The Park
Aventura at The Park
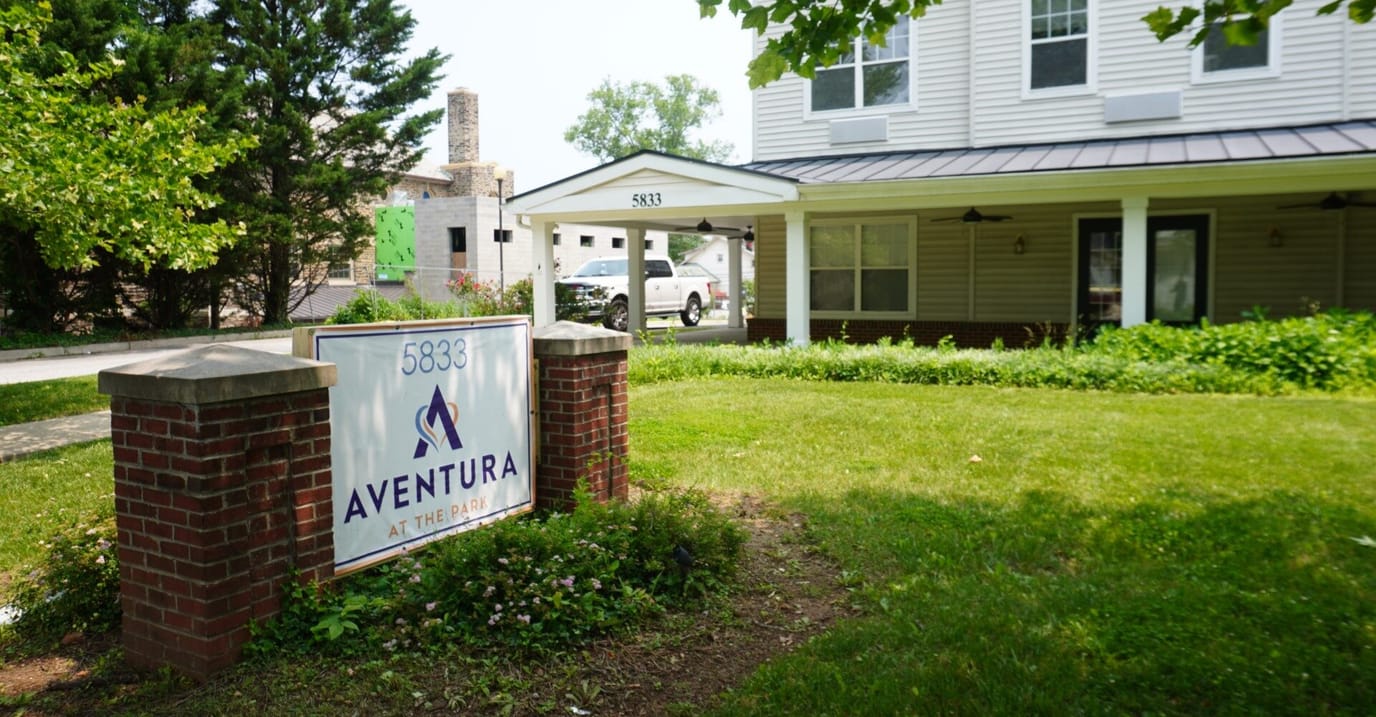
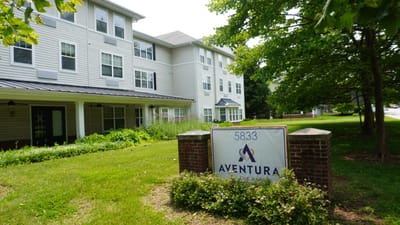
Aventura at the Park sits on Park Heights Ave in northwest Baltimore, in a residential stretch of the city where a Walk Score of 31 means most errands require a car. The facility carries an assisted living designation. The building is two stories with 39 beds, offering studio and one-bedroom floor plans; a size and configuration that puts this squarely in the small community category, where the day-to-day experience tends to feel less institutional than larger facilities.
What’s confirmed about this community is its physical structure: a modest two-story building on the northwest side of Baltimore with apartment options for individuals and a size that’s manageable by design.
For older adults who want an assisted living setting in the Park Heights area of Baltimore, the confirmed profile points to a small, two-floor-plan community at a scale where the environment is likely more personal than institutional. The car-dependent location is a practical factor worth planning around for families who visit regularly.
39-bed community Rank #241 / 697Bed count — State benchmarkedThis home is ranked 241st out of 697 homes in Maryland. Shows this facility's certified or reported bed count compared to other Maryland facilities. Larger communities may offer more amenities, programs, and on-site services for residents and families.Rankings are based only on facilities in Maryland that report data for that category. Facilities without available data are excluded from the ranking.Click the rank badge to see the full State ranking.Click here to see the full State ranking.
A moderately sized community that may balance personal attention with shared amenities and social activities.
Walk Score: 31 / 100 Rank #620 / 985Walk Score — State benchmarkedThis home is ranked 620th out of 985 homes in Maryland. Shows how walkable this facility's neighborhood is compared to the average Walk Score across Maryland facilities. Higher scores benefit residents, families, and staff.Rankings are based only on facilities in Maryland that report data for that category. Facilities without available data are excluded from the ranking.Click the rank badge to see the full State ranking.Click here to see the full State ranking.
Somewhat walkable. A few nearby services may be reachable on foot, but most trips require transportation.
What does this home offer?
Minimum Age: 55 Years Old
Pets Allowed
Housing Options: Studio / 1 Bed
Building Type: 2-story
Social and Recreational Activities

On-site Medical Care and Health Services
Places of interest near Aventura at The Park
![]() 8.6 miles from city center
8.6 miles from city center
![]() Estimated distance in miles from Baltimore's city center to Aventura at The Park's address, calculated via Google Maps.
Estimated distance in miles from Baltimore's city center to Aventura at The Park's address, calculated via Google Maps.
Calculate Travel Distance to Aventura at The Park
Add your location
Compare Assisted Living around Baltimore
The information below is reported by the Maryland Department of Health, Office of Health Care Quality.
| Sunrise of Annapolis | AL MC | Annapolis | 106
Facility
106
MD AVG
43
Rank
#105 / 697 | Yes |
38
Facility
38
MD AVG
43
Rank
#542 / 985 | Studio / 1 Bed / 2 Bed | 30
Facility
30
MD AVG
21
Rank
#44 / 208 | - |
31% Male Residents — State Benchmarked 31% of residents are male, compared to the Maryland average of 31%. This facility caters to a majority female resident pool (69% female), consistent with the broader assisted living trend where women significantly outnumber men. |
69% Female Residents — State Benchmarked 69% of residents are female, compared to the Maryland average of 69%. Women comprise the large majority, consistent with national assisted living demographics where women live longer and enter care facilities at higher rates. |
90% White Residents — State Benchmarked 90% of residents are reported as White, compared to the Maryland average of 81%. A higher White share than is typical for assisted living in Maryland in this dataset — compare with peer facilities for local context. |
6% African American Residents — State Benchmarked 6% of residents are reported as African American or Black, compared to the Maryland average of 13%. In line with the Maryland average for African American residents among facilities reporting this breakdown. |
4% Other Ethnicity Residents — State Benchmarked 4% of residents fall into categories other than White or African American (combined), compared to the Maryland average of 6%. This column aggregates Hispanic, Asian, multiracial, and any other labeled groups that are not classified as White or African American. Reported subgroups in this total: American Indian (1%), Hawaiian/Pacific Islander (1%), Hispanic (1%). |
12% Residents Age 65–74 — State Benchmarked 12% of residents are 65–74, compared to the Maryland average of 13%. In line with the statewide profile for this youngest senior bracket in assisted living. |
22% Residents Age 75–84 — State Benchmarked 22% of residents are 75–84, compared to the Maryland average of 31%. Below the state norm — the resident mix may skew either younger or older than this typical middle bracket. |
65% Residents Age 85–94 — State Benchmarked 65% of residents are 85–94, compared to the Maryland average of 44%. A high concentration of very elderly residents signals a higher-acuity facility with experience caring for advanced age-related needs. | - |
| Brightview White Marsh | AL MC | Nottingham | 99
Facility
99
MD AVG
43
Rank
#131 / 697 | No |
49
Facility
49
MD AVG
43
Rank
#431 / 985 | Studio / 1 Bed | 25
Facility
25
MD AVG
21
Rank
#83 / 208 | - |
17% Male Residents — State Benchmarked 17% of residents are male, compared to the Maryland average of 31%. This facility caters to a majority female resident pool (83% female), consistent with the broader assisted living trend where women significantly outnumber men. |
83% Female Residents — State Benchmarked 83% of residents are female, compared to the Maryland average of 69%. Women comprise the large majority, consistent with national assisted living demographics where women live longer and enter care facilities at higher rates. |
98% White Residents — State Benchmarked 98% of residents are reported as White, compared to the Maryland average of 81%. A higher White share than is typical for assisted living in Maryland in this dataset — compare with peer facilities for local context. |
2% African American Residents — State Benchmarked 2% of residents are reported as African American or Black, compared to the Maryland average of 13%. A lower African American share than is typical in Maryland; local markets still vary widely. |
0% Other Ethnicity Residents — State Benchmarked 0% of residents fall into categories other than White or African American (combined), compared to the Maryland average of 6%. This column aggregates Hispanic, Asian, multiracial, and any other labeled groups that are not classified as White or African American. |
3% Residents Age 65–74 — State Benchmarked 3% of residents are 65–74, compared to the Maryland average of 13%. Fewer younger seniors suggests the resident population skews older, likely requiring higher acuity care and more hands-on support. |
17% Residents Age 75–84 — State Benchmarked 17% of residents are 75–84, compared to the Maryland average of 31%. Below the state norm — the resident mix may skew either younger or older than this typical middle bracket. |
51% Residents Age 85–94 — State Benchmarked 51% of residents are 85–94, compared to the Maryland average of 44%. A high concentration of very elderly residents signals a higher-acuity facility with experience caring for advanced age-related needs. |
29% Residents Age 95+ — State Benchmarked 29% of residents are 95 or older, compared to the Maryland average of 16%. A high proportion of the oldest-old suggests strong end-of-life care experience and very-high-acuity capabilities. |
| Brightview Mays Chapel Ridge | AL IL MC | Timonium (Dixon Hill) | 89
Facility
89
MD AVG
43
Rank
#160 / 697 | No |
52
Facility
52
MD AVG
43
Rank
#402 / 985 | Studio / 1 Bed / 2 Bed | 50
Facility
50
MD AVG
21
Rank
#1 / 208 | A+ |
13% Male Residents — State Benchmarked 13% of residents are male, compared to the Maryland average of 31%. This facility caters to a majority female resident pool (87% female), consistent with the broader assisted living trend where women significantly outnumber men. |
87% Female Residents — State Benchmarked 87% of residents are female, compared to the Maryland average of 69%. Women comprise the large majority, consistent with national assisted living demographics where women live longer and enter care facilities at higher rates. |
99% White Residents — State Benchmarked 99% of residents are reported as White, compared to the Maryland average of 81%. A higher White share than is typical for assisted living in Maryland in this dataset — compare with peer facilities for local context. |
0% African American Residents — State Benchmarked 0% of residents are reported as African American or Black, compared to the Maryland average of 13%. A lower African American share than is typical in Maryland; local markets still vary widely. |
1% Other Ethnicity Residents — State Benchmarked 1% of residents fall into categories other than White or African American (combined), compared to the Maryland average of 6%. This column aggregates Hispanic, Asian, multiracial, and any other labeled groups that are not classified as White or African American. Reported subgroups in this total: Asian (1%). |
3% Residents Age 65–74 — State Benchmarked 3% of residents are 65–74, compared to the Maryland average of 13%. Fewer younger seniors suggests the resident population skews older, likely requiring higher acuity care and more hands-on support. |
30% Residents Age 75–84 — State Benchmarked 30% of residents are 75–84, compared to the Maryland average of 31%. This is the second most common age bracket in assisted living, representing residents with moderate care needs. |
48% Residents Age 85–94 — State Benchmarked 48% of residents are 85–94, compared to the Maryland average of 44%. This is typically the most common age bracket in assisted living — this facility is in line with the statewide norm. |
18% Residents Age 95+ — State Benchmarked 18% of residents are 95 or older, compared to the Maryland average of 16%. In line with the statewide profile for the oldest resident bracket. |
| Symphony Manor | AL MC RC | Baltimore (Roland Park) | 69
Facility
69
MD AVG
43
Rank
#195 / 697 | Yes |
71
Facility
71
MD AVG
43
Rank
#175 / 985 | Studio | 15
Facility
15
MD AVG
21
Rank
#132 / 208 | - |
21% Male Residents — State Benchmarked 21% of residents are male, compared to the Maryland average of 31%. This facility caters to a majority female resident pool (79% female), consistent with the broader assisted living trend where women significantly outnumber men. |
79% Female Residents — State Benchmarked 79% of residents are female, compared to the Maryland average of 69%. Women comprise the large majority, consistent with national assisted living demographics where women live longer and enter care facilities at higher rates. |
79% White Residents — State Benchmarked 79% of residents are reported as White, compared to the Maryland average of 81%. Close to the average for this category among assisted living facilities in Maryland with reported race/ethnicity data. |
19% African American Residents — State Benchmarked 19% of residents are reported as African American or Black, compared to the Maryland average of 13%. In line with the Maryland average for African American residents among facilities reporting this breakdown. |
1% Other Ethnicity Residents — State Benchmarked 1% of residents fall into categories other than White or African American (combined), compared to the Maryland average of 6%. This column aggregates Hispanic, Asian, multiracial, and any other labeled groups that are not classified as White or African American. Reported subgroups in this total: Asian (1%). |
15% Residents Age 65–74 — State Benchmarked 15% of residents are 65–74, compared to the Maryland average of 13%. In line with the statewide profile for this youngest senior bracket in assisted living. |
44% Residents Age 75–84 — State Benchmarked 44% of residents are 75–84, compared to the Maryland average of 31%. A high concentration in this mid-range bracket, where residents typically need moderate support with daily activities. |
18% Residents Age 85–94 — State Benchmarked 18% of residents are 85–94, compared to the Maryland average of 44%. The population here skews younger than the statewide norm, which may indicate a more active, lower-acuity community. |
24% Residents Age 95+ — State Benchmarked 24% of residents are 95 or older, compared to the Maryland average of 16%. A high proportion of the oldest-old suggests strong end-of-life care experience and very-high-acuity capabilities. |
| Aventura at The Park | AL | Baltimore (Cross Country) | 39
Facility
39
MD AVG
43
Rank
#241 / 697 | Yes |
31
Facility
31
MD AVG
43
Rank
#620 / 985 | Studio / 1 Bed | - | - | - | - | - | - | - | - | - | - | - |
Financial Assistance for
Assisted Living in Maryland
Aventura at The Park is located in Baltimore, Maryland.
Here are the financial assistance programs available to residents in Maryland.
Frequently Asked Questions about Aventura at The Park
What neighborhood is Aventura at The Park in?
Aventura at The Park is in the Cross Country neighborhood of Baltimore.
Is Aventura at The Park in a walkable area?
Aventura at The Park has a walk score of 31. Somewhat walkable. A few nearby services may be reachable on foot, but most trips require transportation.
How many beds does Aventura at The Park have?
Aventura at The Park has 39 beds.
Are there photos of Aventura at The Park?
Yes — there are 5 photos of Aventura at The Park in the photo gallery on this page.
What is the address of Aventura at The Park?
Aventura at The Park is located at 5833 Park Heights Ave, Baltimore, MD 21215.
What is the phone number of Aventura at The Park?
(410) 664-0100 will put you in contact with the team at Aventura at The Park.
Guides for Better Senior Living
Care Cost Calculator: See Prices in Your Area
Nursing Home Data Explorer
Don’t Wait Too Long: 7 Red Flag Signs Your Parent Needs Assisted Living Now
The True Cost of Assisted Living in 2025 – And How Families Are Paying For It
Understanding Senior Living Costs: Pricing Models, Discounts & Financial Assistance
Updated on
