Bremerton Trails Post Acute
CMS overall rating Info CMS (the Centers for Medicare & Medicaid Services) is the federal agency that rates nursing home quality. Its Overall Rating runs from 1 to 5 stars, combining health inspections, staffing, and quality measures, with inspections weighted most heavily.

Bremerton Trails Post Acute

CMS overall rating Info CMS (the Centers for Medicare & Medicaid Services) is the federal agency that rates nursing home quality. Its Overall Rating runs from 1 to 5 stars, combining health inspections, staffing, and quality measures, with inspections weighted most heavily.
Calculator: See prices in your area
Bremerton Trails Post Acute accepts Medicare, Medicaid, and private pay.

Overview of Bremerton Trails Post Acute

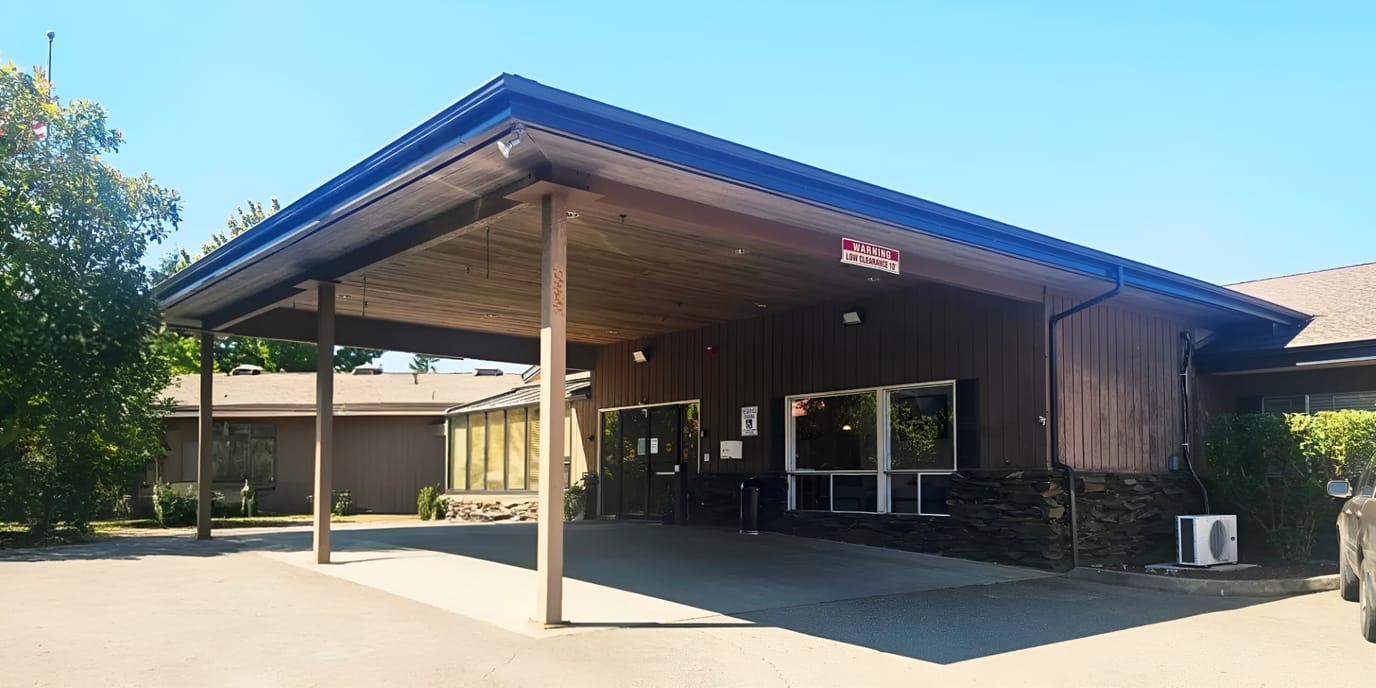
Bremerton Trails Post Acute is an exceptional nursing home in Bremerton, WA, that offers skilled nursing and rehabilitation. The community is dedicated to improving residents’ quality of life with comprehensive care tailored to their unique needs around the clock. Diabetic management, wound care, and social services are also among the community’s many offerings. With resident-focused care, the community also collaborates with families to meet their needs and preferences.

Activities are carefully planned according to older adults’ interests and capabilities. Physical, occupational, and speech therapy are also offered to help residents go back to their routines. With its ideal location near local amenities, residents and families have easy access to their necessities. This senior living community is a great choice for those with complex healthcare needs in Washington, especially with its wide range of care options.

Quality ratings

Measured by Centers for Medicare & Medicaid Services (CMS)

Overall rating Info The Overall CMS Rating combines results from health inspections, staffing levels and quality measures. Health inspections carry the most weight. Staffing and quality scores can increase or decrease the final rating based on performance compared to state and national standards.
▼ 69.0% Below WA avg. ▼ 69.0% Below WA avg.WA average: 3.2Click the badge to see the full State ranking.Click here to see the full State ranking.
Health Inspection Info Based on the results of the facility's three most recent standard inspections and any complaint investigations. CMS reviews the number, scope, and severity of deficiencies, with more recent findings weighted more heavily.
▼ 64.5% Below WA avg. ▼ 64.5% Below WA avg.WA average: 2.8Click the badge to see the full State ranking.Click here to see the full State ranking.
Staffing Info Measures average nursing staff hours per resident per day, including Registered Nurses (RNs) and total nursing staff. Ratings are adjusted based on the level of care residents require and are compared to state and national benchmarks.
▼ 12.4% Below WA avg. ▼ 12.4% Below WA avg.WA average: 3.4Click the badge to see the full State ranking.Click here to see the full State ranking.
Quality Measures Info Based on clinical and physical health indicators reported to CMS, such as hospital readmissions, falls, pressure ulcers, and improvements in mobility. These measures reflect how well residents' health needs are being managed.
▲ 1.7% Above WA avg. ▲ 1.7% Above WA avg.WA average: 3.9Click the badge to see the full State ranking.Click here to see the full State ranking.

Staffing hours breakdown

Info Daily nursing hours per resident by staff type, reported to CMS. Higher is generally better — compare this facility to state and national averages to see where staffing stands.

Hours per resident per day — compared to Washington state averages

Total nursing care / resident Info This home is ranked 28th out of 90 homes in Washington for nurse hours. Total adjusted nursing hours per resident per day, combining RN, LPN, and aide time. CMS adjusts this for case-mix so facilities can be fairly compared.
4h 18m per day
Rank #28 / 90Nurse hours — State benchmarkedThis home is ranked 28th out of 90 homes in Washington. Shows adjusted nurse hours per resident per day benchmarked to the Washington average, with a ranking across 90 Washington facilities. More hours mean more direct care. The national average is about 3.5 hrs; below 3.0 is a red flag.Rankings are based only on facilities in Washington that report data for that category. Facilities without available data are excluded from the ranking.Click the rank badge to see the full State ranking.Click here to see the full State ranking.
This facility Washington avg (4h 13m per day)
vs Washington avg
+2%

4 of 6 metrics below state avg

Standout metric Physical Therapist is +38% above state avg
Staff typeHours / Day / Residentvs state avg
Registered Nurse (RN) Info RNs hold the highest nursing license and can assess residents, interpret test results, and direct care plans. More RN hours per day often signals stronger clinical oversight and faster response to health changes. 32m per day ▼ 40% State avg: 53m per day · National avg: 41m per day
LPN / LVN Info Licensed Practical Nurses (LPNs) or Licensed Vocational Nurses (LVNs) deliver routine hands-on care — medication administration, wound dressing, and monitoring vital signs. They work under RN supervision and make up a large share of daily bedside care. 1h 5m per day ▲ 33% State avg: 49m per day · National avg: 52m per day
Nurse Aide Info Certified Nurse Aides (CNAs) provide the most direct day-to-day assistance: bathing, dressing, feeding, and mobility. Nurse aide hours are typically the largest staffing category and directly affect residents' quality of life. 2h 13m per day ▼ 17% State avg: 2h 41m per day · National avg: 2h 21m per day
Weekend Total Nursing Info Combined nursing hours (RN + LPN + Nurse Aide) per resident per day on weekends. Staffing often drops on weekends — this figure reveals whether the facility maintains adequate coverage outside of weekday hours. 3h 23m per day ▼ 11% State avg: 3h 47m per day · National avg: 3h 26m per day
Physical Therapist Info Hours per resident per day provided by licensed Physical Therapists (PTs) or PT Assistants. PT services help residents recover mobility after injury or illness and are especially important for post-acute (short-stay) rehabilitation. 7m per day ▲ 38% State avg: 5m per day · National avg: 4m per day
Weekend RN Info Registered nurse hours specifically on weekends. Facilities sometimes reduce RN presence on Saturdays and Sundays — a low weekend RN figure compared to weekday hours can indicate reduced clinical oversight when most administrative staff are absent. 19m per day ▼ 50% State avg: 38m per day · National avg: 29m per day

Capacity and availability

This home usually has availability

Higher occupancy than the Washington average: 72.5%
Occupancy rate
74.7% Rank #156 / 310Occupancy rate — State benchmarkedThis home is ranked 156th out of 310 homes in Washington. Shows this facility's occupancy rate versus the Washington average, with its Statewide rank out of 310. Higher occupancy signals strong local demand and financial stability.Rankings are based only on facilities in Washington that report data for that category. Facilities without available data are excluded from the ranking.Click the rank badge to see the full State ranking.Click here to see the full State ranking.
Avg. Length of Stay
100 days
Bed community size
125-bed community Rank #37 / 366Bed count — State benchmarkedThis home is ranked 37th out of 366 homes in Washington. Shows this facility's certified or reported bed count compared to other Washington facilities. Larger communities may offer more amenities, programs, and on-site services for residents and families.Rankings are based only on facilities in Washington that report data for that category. Facilities without available data are excluded from the ranking.Click the rank badge to see the full State ranking.Click here to see the full State ranking.
A larger shared setting that may offer more common spaces and organized community services.
Walk Score
Walk Score: 62 / 100 Rank #223 / 628Walk Score — State benchmarkedThis home is ranked 223rd out of 628 homes in Washington. Shows how walkable this facility's neighborhood is compared to the average Walk Score across Washington facilities. Higher scores benefit residents, families, and staff.Rankings are based only on facilities in Washington that report data for that category. Facilities without available data are excluded from the ranking.Click the rank badge to see the full State ranking.Click here to see the full State ranking.
Moderately walkable. Some errands can be accomplished on foot, with a mix of nearby amenities.

Therapy & Rehabilitation

1 service
Rehabilitation Services

Staffing & Medical

1 service
24-Hour Staffing

Amenities & Lifestyle

24-Hour Skilled Nursing Care
Wifi
Salon Services
Fitness Activities
Religious Services
Social Events
Religious ServicesYes
Volunteer ProgramsYes
Touring HoursMonday-Sunday: 8am-8pm

Contact Bremerton Trails Post Acute

Staffing Data

Reporting period: October 1 – December 31, 2025 (Q4 2025). Source: CMS Payroll-Based Journal report.

Total staff 204
Employees 89
Contractors 115
Staff to resident ratio 2.34 : 1
26% more staff per resident than Washington average
Washington average ratio: 1.86 : 1 Washington average ratio: 1.86 : 1See full Washington ranking
Avg staff/day 50
Average shift 9.2 hours
14% better than Washington average
Washington average: 8.1 hours Washington average shift: 8.1 hoursSee full Washington ranking
Total staff hours (quarter) 42,356

Nursing staff breakdown

Q4 2025 · Oct 1 – Dec 31 More info This data comes from the CMS Payroll-Based Journal report covering October 1 – December 31, 2025.
Registered Nurse

Manages medical care and health needs.

RN Staff Info 21 total: 6 full-time employees and 15 contractors. 21
Average shift length Info Average shift length. Calculated as total hours divided by days worked and average staff per day. 10.2 hours
Licensed Practical Nurse

Assists with medical care and medications.

LPN Staff Info 48 total: 13 full-time employees and 35 contractors. 48
Average shift length Info Average shift length. Calculated as total hours divided by days worked and average staff per day. 9.9 hours
Certified Nursing Assistant

Helps with daily care and mobility.

CNA Staff Info 100 total: 43 full-time employees and 57 contractors. 100
Average shift length Info Average shift length. Calculated as total hours divided by days worked and average staff per day. 9.7 hours

Contractor staffing

Q4 2025 · Oct 1 – Dec 31 More info This data comes from the CMS Payroll-Based Journal report covering October 1 – December 31, 2025.

Total hours from contractors

25.8%

10,930 contractor hours this quarter

Certified Nursing Assistant: 57 Licensed Practical Nurse: 35 Registered Nurse: 15 Medical Director: 4 Respiratory Therapy Technician: 2 RN Director of Nursing: 1 Other Physician: 1

Staff by category

Q4 2025 · Oct 1 – Dec 31 More info This data comes from the CMS Payroll-Based Journal report covering October 1 – December 31, 2025.
Certified Nursing Assistant435710021,29592100%9.7
Licensed Practical Nurse1335489,17192100%9.9
Registered Nurse615213,20192100%10.2
Clinical Nurse Specialist3031,3368087%8.3
RN Director of Nursing3141,2247076%8.1
Respiratory Therapy Technician1231,1066975%8.9
Other Dietary Services Staff3039687885%6.3
Speech Language Pathologist4046407177%7.2
Nurse Practitioner1015126470%8
Administrator1014966267%8
Physical Therapy Assistant2024885762%8
Dental Services Staff1014826368%7.6
Dietitian1014146065%6.9
Mental Health Service Worker1013845560%7
Qualified Social Worker3032374549%5.2
Occupational Therapy Aide1012253841%5.9
Medical Director044683134%1.9
Physical Therapy Aide101632123%3
Medication Aide/Technician1013533%11.7
Other Physician0111222%6
100 Certified Nursing Assistant
% of Days 100%
48 Licensed Practical Nurse
% of Days 100%
21 Registered Nurse
% of Days 100%
3 Clinical Nurse Specialist
% of Days 87%
4 RN Director of Nursing
% of Days 76%
3 Respiratory Therapy Technician
% of Days 75%
3 Other Dietary Services Staff
% of Days 85%
4 Speech Language Pathologist
% of Days 77%
1 Nurse Practitioner
% of Days 70%
1 Administrator
% of Days 67%
2 Physical Therapy Assistant
% of Days 62%
1 Dental Services Staff
% of Days 68%
1 Dietitian
% of Days 65%
1 Mental Health Service Worker
% of Days 60%
3 Qualified Social Worker
% of Days 49%
1 Occupational Therapy Aide
% of Days 41%
4 Medical Director
% of Days 34%
1 Physical Therapy Aide
% of Days 23%
1 Medication Aide/Technician
% of Days 3%
1 Other Physician
% of Days 2%

Penalties and fines

Includes penalties issued in 2023

Federal penalties imposed by CMS for regulatory violations, including civil money penalties (fines) and denials of payment for new Medicare/Medicaid admissions.

Source: CMS Penalties Database (Data as of Jan 2026)

Total fines amount $76K Rank #84 / 92Federal fines — State benchmarkedThis home is ranked 84th out of 92 homes in Washington. Shows this facility's cumulative CMS federal fine dollars versus the Washington average among facilities with fines, and where it ranks among 92 facilities in the pool. Lower total dollars mean a better rank.Rankings are based only on facilities in Washington that report data for that category. Facilities without available data are excluded from the ranking.Click the rank badge to see the full State ranking.Click here to see the full State ranking.
7% lower than Washington average

Washington average: $82K

Number of fines 2
8% more fines than Washington average

Washington average: 1.8

Payment Denials Info Serious action where Medicare and/or Medicaid temporarily stops payments for new residents until issues are fixed. 1
261% more payment denials than Washington average

Washington average: 0.3

Fines amount comparison
This facility $76K
Washington average $82K
Penalty History

Penalties are imposed by CMS for violations of federal nursing home regulations.

2 penalties in the past 3 years

Multiple penalties were reported in the last 3 years.

Civil Money Penalty Info Fines imposed for noncompliance, which can be assessed per day or per instance of violation. Nov 17, 2023
$66K
Payment Denial Info Serious action where Medicare and/or Medicaid temporarily stops payments for new residents until issues are fixed. Nov 17, 2023
2 days

Last updated: Jan 2026

Quality of care over time

These measures show how residents usually do over time at this home, based on health outcomes and preventive care.

High-risk clinical events score Info A composite score based on pressure ulcers, falls with injury, weight loss, walking ability decline, and activities of daily living decline. 7.6
24% better than Washington average

Washington average: 10.0

Functional decline score Info A composite score based on activities of daily living decline, walking ability decline, and incontinence. 14.6
30% better than Washington average

Washington average: 20.9

Long-stay resident measures
Above average Washington avg: 3.6 Info CMS star rating based on long-stay quality measure performance. 5 stars = significantly above average, 1 star = significantly below average.
Need for Help with Daily Activities Increased Info Percent of long-stay residents whose need for help with daily activities has increased 14.1%
14% better than Washington average

Washington average: 16.4%

Walking Ability Worsened Info Percent of long-stay residents whose ability to move independently worsened 13.7%
37% better than Washington average

Washington average: 21.8%

Low Risk Residents with Bowel/Bladder Incontinence Info Percent of low risk long-stay residents who lose control of their bowels or bladder 15.9%
34% better than Washington average

Washington average: 24.3%

Falls with Major Injury Info Percent of long-stay residents experiencing one or more falls with major injury 0.7%
73% better than Washington average

Washington average: 2.6%

High Risk Residents with Pressure Ulcers Info Percent of long-stay high risk residents with pressure ulcers 4.2%
15% better than Washington average

Washington average: 4.9%

Urinary Tract Infection Info Percent of long-stay residents with a urinary tract infection 6.1%
249% worse than Washington average

Washington average: 1.7%

Lost Too Much Weight Info Percent of long-stay residents who lose too much weight 5.5%
6% better than Washington average

Washington average: 5.8%

Depressive Symptoms Info Percent of long-stay residents who have depressive symptoms 4.4%
73% better than Washington average

Washington average: 16.2%

Antipsychotic Use Info Percent of long-stay residents who received an antipsychotic medication 12.8%
12% better than Washington average

Washington average: 14.5%

Pneumococcal Vaccine Info Percent of long-stay residents assessed and appropriately given the pneumococcal vaccine 91.2%
5% worse than Washington average

Washington average: 96.2%

Influenza Vaccine Info Percent of long-stay residents assessed and appropriately given the seasonal influenza vaccine 91.0%
In line with Washington average

Washington average: 93.8%

Hospitalizations per 1,000 days Info Number of hospitalizations per 1,000 long-stay resident days. 1.13
18% better than Washington average

Washington average: 1.38

ED visits per 1,000 days Info Number of outpatient emergency department visits per 1,000 long-stay resident days. 0.78
48% better than Washington average

Washington average: 1.51

Short-stay resident measures
Above average Washington avg: 3.6 Info CMS star rating based on short-stay quality measure performance. 5 stars = much above average, 1 star = much below average.
Pneumococcal Vaccine Info Percent of short-stay residents assessed and appropriately given the pneumococcal vaccine 80.4%
9% worse than Washington average

Washington average: 88.1%

Antipsychotic medication increase Info Percent of short-stay residents who newly received an antipsychotic medication 1.5%
In line with Washington average

Washington average: 1.4%

Influenza Vaccine Info Percent of short-stay residents assessed and appropriately given the seasonal influenza vaccine 74.1%
10% worse than Washington average

Washington average: 82.0%

Re-hospitalized after SNF stay Info Percentage of short-stay residents who were re-hospitalized after their nursing home admission. 14.4%
28% better than Washington average

Washington average: 19.9%

Emergency department visits Info Percentage of short-stay residents who had an outpatient emergency department visit. 13.3%
In line with Washington average

Washington average: 13.2%

Falls with major injury Info Percentage of SNF residents who experience falls with major injury during their stay. 0.0%
100% better than Washington average

Washington average: 0.8%

Ability to care for self at discharge Info Percentage of residents at or above expected ability to care for themselves at discharge. 55.3%
In line with Washington average

Washington average: 53.7%

Successful return to home or community Info Rate of successful return to home or community from a skilled nursing facility. 37.7%
26% worse than Washington average

Washington average: 50.6%

Breakdown by payment type

Medicare

37% of new residents, usually for short-term rehab.

Typical stay 30 days

Private pay

50% of new residents, often for short stays.

Typical stay 1 months

Medicaid

13% of new residents, often for long-term daily care.

Typical stay 1 - 2 years

Facility Characteristics

Source: CMS Long-Term Care Facility Characteristics (Data as of Jan 2026)

Total residents 87
Medicare
11
12.6% of residents
Medicaid
71
81.6% of residents
Private pay or other
5
5.7% of residents
Programs & Services
Residents Group

Residents meet regularly to discuss policies, care quality, and activities

Active Resident Council

Organized group of residents that meets regularly to discuss facility policies, quality of life, and activities.

Finances and operations

Based on CMS SNF Cost Report for fiscal year ending in 12/2023.

Privately-owned community
Operated by a single business entity.
Net patient revenue Info Net patient revenue — what the home actually collects for resident care, after contractual allowances, bad debt and discounts are subtracted from its gross charges (CMS cost report, Worksheet G-3). It covers resident care only; money the home earns from other sources is shown separately as "Other income."
$13.2M
Net patient income Info Net patient income: net patient revenue minus the home's total operating expenses. A positive figure means it earns more from resident care than it spends to deliver it; a negative figure means the opposite. It excludes non-operating "other income."
$228.1K
Privately-owned community Operated by a single business entity.
Net patient revenue Info Net patient revenue — what the home actually collects for resident care, after contractual allowances, bad debt and discounts are subtracted from its gross charges (CMS cost report, Worksheet G-3). It covers resident care only; money the home earns from other sources is shown separately as "Other income."
$13.2M Rank #43 / 94Revenue — State benchmarkedThis home is ranked 43rd out of 94 homes in Washington. Shows this facility's annual revenue compared to the Washington average. Higher revenue generally means more resources for staffing and capital — read alongside Payroll %.Rankings are based only on facilities in Washington that report data for that category. Facilities without available data are excluded from the ranking.Click the rank badge to see the full State ranking.Click here to see the full State ranking.
Net patient income Info Net patient income: net patient revenue minus the home's total operating expenses. A positive figure means it earns more from resident care than it spends to deliver it; a negative figure means the opposite. It excludes non-operating "other income."
$228.1K
Other income Info Money the home earns outside of resident care — such as investments, grants, rentals and other non-operating sources (CMS cost report, Worksheet G-3). It is tracked separately from net patient revenue: it is not part of that figure, and it is not included in net patient income.
$770.3K
Payroll costs Info Staff salaries plus wage-related costs — benefits such as payroll taxes, health insurance and retirement — from the home's own accounting records (CMS cost report, Worksheet A). Contract or agency labor is counted separately, under other operating costs. Rank #56 / 94Payroll — State benchmarkedThis home is ranked 56th out of 94 homes in Washington. Shows total annual staff payroll benchmarked to the Washington average. Higher payroll investment relative to peers often signals better staffing and less reliance on cheaper contract labor.Rankings are based only on facilities in Washington that report data for that category. Facilities without available data are excluded from the ranking.Click the rank badge to see the full State ranking.Click here to see the full State ranking.
$6.3M 47.7% of net patient revenue Info Payroll as a share of revenue: staff salaries and wage-related benefits divided by net patient revenue. A higher figure means more of each revenue dollar goes to staff pay. Rank #64 / 94Payroll % — State benchmarkedThis home is ranked 64th out of 94 homes in Washington. Shows payroll as a percentage of revenue versus the Washington average. Well-run Washington facilities typically land around 53–61% — the top third Statewide. Below 25% may signal understaffing or heavy agency use — read with Staffing ratings.Rankings are based only on facilities in Washington that report data for that category. Facilities without available data are excluded from the ranking.Click the rank badge to see the full State ranking.Click here to see the full State ranking.
Other operating costs Info Everything it costs to run the home apart from payroll — food, utilities, supplies, maintenance, contract labor and administration. Calculated as total operating expense minus payroll (staff salaries and wage-related benefits).
$6.7M
Total costs Info The home's total operating expense for the year — all the costs of running it, salaries included (CMS cost report, Worksheet G-3).
$12.9M

What does this home offer?

Housing options icon

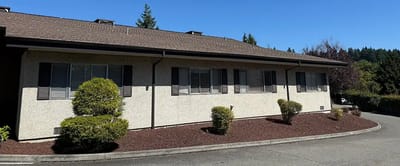
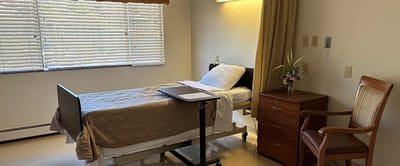
Housing Options: Private / Semi-Private Rooms

Building type icon
Building type icon

Building Type: Single-story

Beauty services icon

Beauty Services

Social and recreational activities icon

Social and Recreational Activities

Rehabilitative support icon

Rehabilitative Support

Exercise program icon

Exercise Programs

On-site medical care and health services icon

On-site Medical Care and Health Services

Who this home usually serves

TYPE OF STAY

Mix of rehab and long-term care

This home supports both short-term rehab and long-term care, with residents staying for a wide range of durations.

Most new residents arrive under private pay (50% of admissions), and a typical private pay stay runs around 1 months.

Admissions
335 total

Coverage residents most often arrive under.

Medicare 37%
Private pay 50%
Medicaid 13%
Discharges
342 total

Coverage residents most often leave under.

Medicare 25%
Private pay 40%
Medicaid 36%

Places of interest near Bremerton Trails Post Acute

Address 1.9 miles from city center Info Estimated distance in miles from Bremerton's city center to Bremerton Trails Post Acute's address, calculated via Google Maps.

Calculate Travel Distance to Bremerton Trails Post Acute

Add your location

Address

Compare Nursing Homes around Bremerton

The information below is reported by the Washington Department of Social and Health Services, Residential Care Services.

2 facilities compared · CMS & WA Dept. of Health data

Bremerton Trails Post Acute
NH
Bremerton (Clare Avenue)
125
Facility 125
WA AVG 82
Rank #37 / 366
74.7%
Facility 74.7%
WA AVG 72.5%
Rank #156 / 310
+3%
4.31
Facility 4.31
WA AVG 4.22
Rank #28 / 90
-28%+2%
$232.3k
Facility $232.3k
WA AVG $87.7k
Rank #84 / 92
103
Facility 103
WA AVG 48.9
Rank #87 / 92
4.5
Facility 4.5
WA AVG 6.9
Rank #16 / 92
4104-
62
Facility 62
WA AVG 51
Rank #223 / 628
-
$13.2M
Facility $13.2M
WA AVG $13.2M
Rank #43 / 94
$6.3M
Facility $6.3M
WA AVG $5.7M
Rank #56 / 94
47.7%
Facility 47.7%
WA AVG 45.5%
Rank #64 / 94
505123
Fir Lane Health & Rehabilitation Center
NH
MC
Shelton (Christmas Village)
135
Facility 135
WA AVG 82
Rank #30 / 366
60.0%
Facility 60.0%
WA AVG 72.5%
Rank #250 / 310
-17%
4.39
Facility 4.39
WA AVG 4.22
Rank #24 / 90
-65%+4%
$121.5k
Facility $121.5k
WA AVG $87.7k
Rank #73 / 92
79
Facility 79
WA AVG 48.9
Rank #78 / 92
4.9
Facility 4.9
WA AVG 6.9
Rank #28 / 92
485A+
23
Facility 23
WA AVG 51
Rank #511 / 628
-
$11.4M
Facility $11.4M
WA AVG $13.2M
Rank #60 / 94
$4.4M
Facility $4.4M
WA AVG $5.7M
Rank #76 / 94
38.7%
Facility 38.7%
WA AVG 45.5%
Rank #82 / 94
505230

Financial Assistance for
Nursing Home in Washington

Bremerton Trails Post Acute is located in Bremerton, Washington.
Here are the financial assistance programs available to residents in Washington.

Get Financial aid guidance

Community Options Program Entry System (COPES)

WA Medicaid COPES

Age 65+ or disabled
General Washington resident, Medicaid-eligible, nursing home-level care need.
Income Limits (2025) ~$2,829/month 300% FBR, individual
Asset Limits $2,000 (individual), $3,000 (couple).
WA

High demand in urban areas (e.g., Seattle).

Benefits
Personal care (5-7 hours/day) Respite (240 hours/year) Adult day care ($70/day) Home modifications ($1,500 avg.)

Washington Family Caregiver Support Program

WA NFCSP

Age Caregiver of someone 60+ (or with dementia)
General Washington resident.
Income Limits No strict limit; prioritizes low-income.
Asset Limits Not applicable.
WA

High urban demand; rural outreach.

Benefits
In-home respite (4-6 hours/day) Adult day care (~$70/day) Short-term facility care (up to 5 days)

Community First Choice (CFC)

Washington Community First Choice

Age 65+ (or disabled 18+)
General WA resident, Medicaid-eligible, need help with 2+ ADLs/IADLs.
Income Limits (2025) ~$2,829/month; QIT optional.
Asset Limits $2,000 (individual), $3,000 (couple).
WA

Broader than COPES; serves ~20,000; self-directed option.

Benefits
Personal care (4-6 hours/day) Respite (~240 hours/year) Assistive devices Training Transportation

Older Americans Act (OAA) Services

Washington OAA Services

Age 60+
General WA resident; no income/asset limits.
Income Limits (2025) None; donations encouraged.
Asset Limits Not assessed.
WA

13 AAAs; includes Meals on Wheels; rural focus.

Benefits
Meals (~$5-$7/meal) Transportation Homemaker services (~4 hours/week) Respite (~5 days/year) Legal aid

Medicare Savings Program (MSP)

Washington Medicare Savings Program

Age 65+ or disabled
General WA resident, Medicare Part A/B.
Income Limits (2025) ~$2,510/month (QMB), ~$3,380/month (SLMB), ~$3,598/month (QI)—individual.
Asset Limits $9,430 (individual), $14,130 (couple).
WA

Includes Extra Help for Part D; no waitlist.

Benefits
Covers Part B premiums ($174.70/month) Deductibles ($240/year) Copays (~20%)

VA Aid and Attendance (A&A) and Housebound Benefits

Washington VA Aid and Attendance/Housebound

Age 65+ or disabled veteran/spouse
General WA resident, wartime service, ADL help (A&A) or homebound.
Income Limits (2025) Net income < ~$1,984/month (veteran with dependent, A&A); pension offsets income.
Asset Limits ~$155,356 net worth
WA

High veteran use; supports rural/urban needs.

Benefits
Cash (~$1,433-$2,642/month veteran, ~$951-$1,318 spouse) for care costs

Senior Citizens Property Tax Exemption

Washington Senior Property Tax Exemption

Age 61+ or disabled retiree
General WA resident, homeowner, income-based.
Income Limits (2025) ~$45,000-$70,000/year varies by county, e.g., King: $70,000
Asset Limits Not assessed; home value cap varies ~$250,000-$400,000
WA

Saves ~$500-$1,500/year; offered statewide.

Benefits
Tax exemption (~$500-$1,500/year depending on county)

Senior Farmers’ Market Nutrition Program (SFMNP)

Washington SFMNP

Age 60+
General WA resident, low-income.
Income Limits (2025) ~$2,322/month 185% FPL
Asset Limits Not assessed.
WA

Vouchers (~$80/season); serves ~20,000 via AAAs.

Benefits
Vouchers (~$80/season) for produce at farmers’ markets

Frequently Asked Questions about Bremerton Trails Post Acute

What neighborhood is Bremerton Trails Post Acute in?

Bremerton Trails Post Acute is in the Clare Avenue neighborhood.

Is Bremerton Trails Post Acute in a walkable area?

Bremerton Trails Post Acute has a walk score of 62. Moderately walkable. Some errands can be accomplished on foot, with a mix of nearby amenities.

What is the occupancy rate at Bremerton Trails Post Acute?

Bremerton Trails Post Acute's occupancy is 74.7%.

Are there photos of Bremerton Trails Post Acute?

Yes — there are 5 photos of Bremerton Trails Post Acute in the photo gallery on this page.

What is the address of Bremerton Trails Post Acute?

Bremerton Trails Post Acute is located at 2701 Clare Ave, Bremerton, WA 98310.

What is the phone number of Bremerton Trails Post Acute?

(360) 377-3951 will put you in contact with the team at Bremerton Trails Post Acute.

Is Bremerton Trails Post Acute Medicare or Medicaid certified?

Yes — Bremerton Trails Post Acute is a CMS-certified provider of Medicare and Medicaid.

Guides for Better Senior Living

Care Cost Calculator: See Prices in Your Area

Nursing Home Data Explorer

Don’t Wait Too Long: 7 Red Flag Signs Your Parent Needs Assisted Living Now

The True Cost of Assisted Living in 2025 – And How Families Are Paying For It

Understanding Senior Living Costs: Pricing Models, Discounts & Financial Assistance