


Occupancy rate
100%
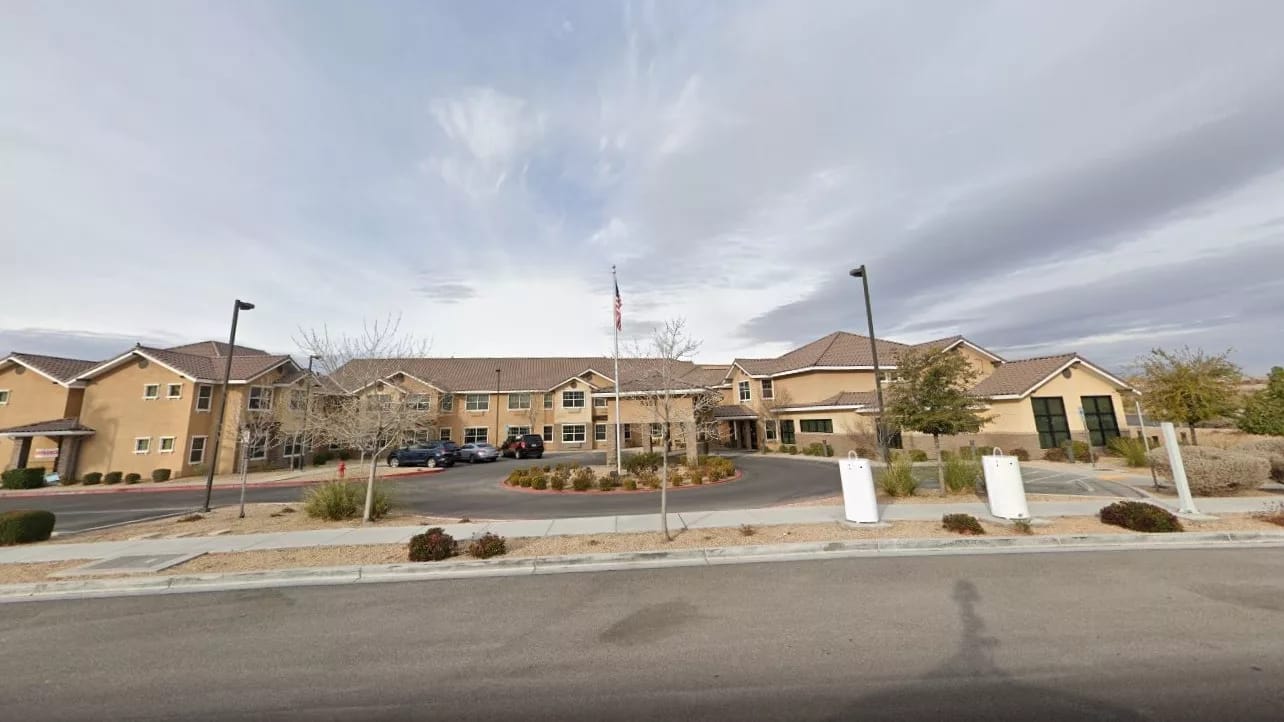
Marquis Centennial Hills is located at 6351 N Fort Apache Rd in Las Vegas, Nevada, a car-dependent stretch with a Walk Score of 31. The 115-bed skilled nursing facility has operated for 16 years and is led by administrator Jacob Atwood. Care designations include nursing home, hospice, and respite care.
Every bed is currently filled. At 100% occupancy across all 115 units, the facility is running at capacity. The average length of stay is 91 days, which is a number that positions this squarely as a short-stay, post-acute setting rather than a long-term residence.
Staffing runs at 3 hours and 31 minutes of total nursing care per resident per day. Registered nurses account for 1 hour and 11 minutes of that, and nurse aides for 2 hours and 25 minutes. The community accepts Medicare, Medicaid, and private pay, which matters for short-stay patients coming out of a hospital episode.
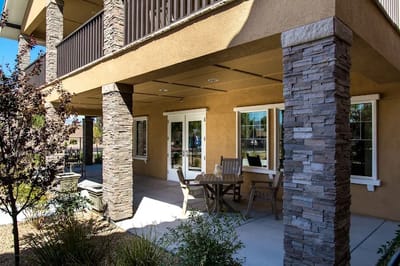
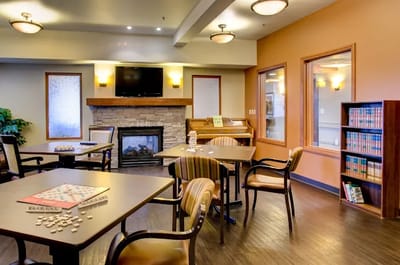
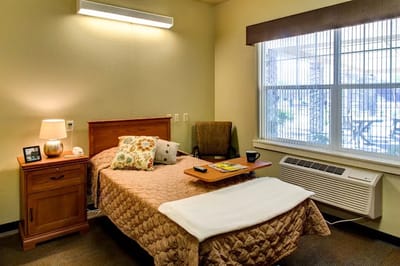
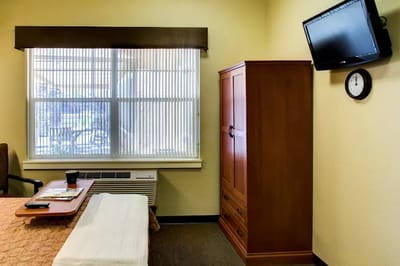
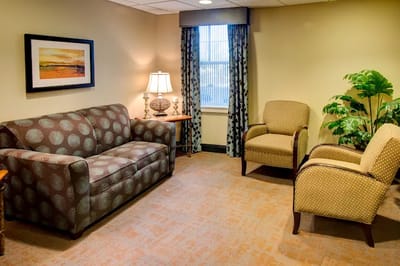
Residents have access to a library, a recreation room, and a private dining room for special events. Apartments include individualized heating and air conditioning.
State inspections have tended to focus on medication management, fire-safety systems, emergency preparedness, care planning and documentation, and dietary and food service; operational and systems-level areas rather than a single category of concern.
At full capacity with a 91-day average stay and Medicare and Medicaid acceptance, Marquis Centennial Hills is suited to adults who need short-term skilled nursing and recovery support after a hospitalization.
| Staff type | Hours / Day / Resident | vs state avg |
|---|---|---|
|
Registered Nurse (RN)
| 1h 11m per day | ▲ 12% State avg: 1h 4m per day · National avg: 41m per day |
|
LPN / LVN
| 1h 3m per day | ▲ 17% State avg: 54m per day · National avg: 52m per day |
|
Nurse Aide
| 2h 25m per day | ■ Avg State avg: 2h 23m per day · National avg: 2h 21m per day |
|
Weekend Total Nursing
| 4h 15m per day | ▲ 10% State avg: 3h 51m per day · National avg: 3h 26m per day |
|
Physical Therapist
| 5m per day | ■ Avg State avg: 5m per day · National avg: 4m per day |
|
Weekend RN
| 57m per day | ▲ 12% State avg: 51m per day · National avg: 29m per day |
Marquis Centennial Hills is administered by Jacob Atwood.
In Nevada, the Department of Health and Human Services, Bureau of Health Care Quality and Compliance performs unannounced onsite surveys to evaluate resident safety and care quality.
Deficiencies
| This Facility | NV Average | vs. NV Avg |
|---|---|---|---|
|
Total deficiencies
| 280 | 62 | This facility has 352% more total deficiencies than a typical Nevada nursing home (280 vs. NV avg 62).↑ 352% worse |
|
Deficiencies per year
| 17.5 | 3.9 | This facility has 349% more deficiencies per year than a typical Nevada nursing home (17.5 vs. NV avg 3.9).↑ 349% worse |
|
Deficiencies per inspection
| 4.5 | 3 | This facility has 50% more deficiencies per inspection than a typical Nevada nursing home (4.5 vs. NV avg 3).↑ 50% worse |
Inspections
| This Facility | NV Average | vs. NV Avg |
|---|---|---|---|
|
Total inspections
| 62 | 21 | This facility has had 195% more total inspections than the Nevada average (62 vs. NV avg 21). More inspections can mean more regulatory scrutiny rather than worse care.↑ 195% more |
Nevada average 5.1
Last Health inspection on Jun 2025
Nevada average 36.2
Nevada average 7.08
Health citations are formal notices following inspections when they fail to comply with safety and care standards.
19 of 29 citations resulted from standard inspections; 8 of 29 resulted from complaint investigations; and 2 of 29 came from combined inspections (standard and complaint).
Nevada average: 0.1
Nevada average: 0.5
Reporting period: October 1 – December 31, 2025 (Q4 2025). Source: CMS Payroll-Based Journal report.
Manages medical care and health needs.
Assists with medical care and medications.
Helps with daily care and mobility.
Total hours from contractors
2,400 contractor hours this quarter
| Certified Nursing Assistant | 58 | 3 | 61 | 20,676 | 92 | 100% | 7.8 |
| Licensed Practical Nurse | 22 | 0 | 22 | 8,554 | 92 | 100% | 7.9 |
| Registered Nurse | 21 | 0 | 21 | 7,825 | 92 | 100% | 8.5 |
| Qualified Activities Professional | 16 | 0 | 16 | 4,392 | 92 | 100% | 9.5 |
| Clinical Nurse Specialist | 4 | 0 | 4 | 1,866 | 63 | 68% | 7.9 |
| Dental Services Staff | 2 | 0 | 2 | 951 | 64 | 70% | 8.1 |
| Other Dietary Services Staff | 6 | 0 | 6 | 933 | 92 | 100% | 5.9 |
| Speech Language Pathologist | 0 | 3 | 3 | 905 | 64 | 70% | 7.7 |
| Respiratory Therapy Technician | 0 | 5 | 5 | 706 | 75 | 82% | 6.9 |
| Administrator | 1 | 0 | 1 | 512 | 64 | 70% | 8 |
| Mental Health Service Worker | 1 | 0 | 1 | 485 | 62 | 67% | 7.8 |
| Nurse Practitioner | 1 | 0 | 1 | 464 | 58 | 63% | 8 |
| RN Director of Nursing | 1 | 0 | 1 | 464 | 58 | 63% | 8 |
| Dietitian | 1 | 0 | 1 | 435 | 58 | 63% | 7.5 |
| Occupational Therapy Aide | 1 | 0 | 1 | 373 | 57 | 62% | 6.5 |
| Physical Therapy Aide | 0 | 4 | 4 | 350 | 59 | 64% | 5.2 |
| Physical Therapy Assistant | 0 | 5 | 5 | 216 | 44 | 48% | 4.7 |
| Qualified Social Worker | 0 | 1 | 1 | 154 | 32 | 35% | 4.8 |
| Medical Director | 0 | 1 | 1 | 30 | 13 | 14% | 2.3 |
| Occupational Therapy Assistant | 0 | 1 | 1 | 18 | 6 | 7% | 2.9 |
Federal penalties imposed by CMS for regulatory violations, including civil money penalties (fines) and denials of payment for new Medicare/Medicaid admissions.
Source: CMS Penalties Database
No penalties in the past 3 years
No civil money penalties or payment denials were reported in the last 3 years.
These measures show how residents usually do over time at this home, based on health outcomes and preventive care.
Nevada average: 9.7
Nevada average: 17.5
Nevada average: 15.6%
Nevada average: 20.8%
Nevada average: 16.9%
Nevada average: 2.5%
Nevada average: 5.5%
Nevada average: 1.4%
Nevada average: 5.4%
Nevada average: 4.2%
Nevada average: 14.1%
Nevada average: 91.0%
Nevada average: 89.6%
Nevada average: 1.82
Nevada average: 1.50
Nevada average: 83.9%
Nevada average: 2.0%
Nevada average: 80.7%
Nevada average: 23.4%
Nevada average: 9.8%
Nevada average: 0.8%
Nevada average: 53.7%
Nevada average: 50.6%
Quality measures are calculated from Minimum Data Set (MDS) assessments. For most measures, lower percentages indicate better care quality.
26% of new residents, usually for short-term rehab.
60% of new residents, often for short stays.
15% of new residents, often for long-term daily care.
Source: CMS Long-Term Care Facility Characteristics (Data as of Jan 2026)
Residents meet regularly to discuss policies, care quality, and activities
Organized group of residents that meets regularly to discuss facility policies, quality of life, and activities.
Data sourced from CMS Long-Term Care Facility Characteristics quarterly report. Payer mix reflects the current resident census by primary payment source.
Historical financial and operational data for Marquis Centennial Hills from 2011–2023, based on CMS SNF Cost Reports.
Key figures below are for fiscal year ending in 12/2023.
Based on CMS SNF Cost Report for fiscal year ending in 12/2023.
Residents typically stay for brief periods, with frequent admissions and discharges throughout the year.
Most new residents arrive under private pay (60% of admissions), and a typical private pay stay runs around 1 months.
Coverage residents most often arrive under.
Coverage residents most often leave under.
![]() 6351 N Fort Apache Rd, Las Vegas, NV 89149 — 4.9 miles to nearest hospital (H2U Health Center at MountainView Hospital)
6351 N Fort Apache Rd, Las Vegas, NV 89149 — 4.9 miles to nearest hospital (H2U Health Center at MountainView Hospital)
Add your location
The information below is reported by the Nevada Department of Health and Human Services, Bureau of Health Care Quality and Compliance.
| Las Ventanas at Summerlin | NH IL MC SNF | Las Vegas (Summerlin) | 60 |
95.5%
Facility
95.5%
NV AVG
79.4
Rank
#60 / 263 | +20% | 5.10
Facility
5.10
NV AVG
4.03
Rank
#2 / 47 | +49% | +26% | $0
Facility
$0
NV AVG
$34.1k
Rank
#1 / 49 | 19
Facility
19
NV AVG
36.2
Rank
#4 / 49 | 4.8
Facility
4.8
NV AVG
7.1
Rank
#10 / 49 | - | 57 | - | 62 | Humangood Nevada | $30.5MFiscal year ending 12/2023
Facility
$30.5MFiscal year ending 12/2023
NV AVG
$18.7M
Rank
#6 / 47 | $12.4MFiscal year ending 12/2023
Facility
$12.4MFiscal year ending 12/2023
NV AVG
$6.3M
Rank
#6 / 47 | 40.6%Fiscal year ending 12/2023
Facility
40.6%Fiscal year ending 12/2023
NV AVG
34.9%
Rank
#33 / 47 | 295086 | ||||
| Advanced Health Care of Las Vegas | NH SNF | Las Vegas | 38 |
89.5%
Facility
89.5%
NV AVG
79.4
Rank
#95 / 263 | +13% | 3.63
Facility
3.63
NV AVG
4.03
Rank
#17 / 47 | +13% | -10% | $0
Facility
$0
NV AVG
$34.1k
Rank
#1 / 49 | 11
Facility
11
NV AVG
36.2
Rank
#2 / 49 | 3.7
Facility
3.7
NV AVG
7.1
Rank
#4 / 49 | - | 34 | A+ | 23 | Joseph Walker | $10.3MFiscal year ending 12/2023
Facility
$10.3MFiscal year ending 12/2023
NV AVG
$18.7M
Rank
#41 / 47 | $4.8MFiscal year ending 12/2023
Facility
$4.8MFiscal year ending 12/2023
NV AVG
$6.3M
Rank
#43 / 47 | 46.6%Fiscal year ending 12/2023
Facility
46.6%Fiscal year ending 12/2023
NV AVG
34.9%
Rank
#31 / 47 | 295090 | ||||
| Life Care Center of Las Vegas | NH SNF | Las Vegas (Twin Lakes) | 178 |
93.8%
Facility
93.8%
NV AVG
79.4
Rank
#68 / 263 | +18% | 3.74
Facility
3.74
NV AVG
4.03
Rank
#14 / 47 | -43% | -7% | $0
Facility
$0
NV AVG
$34.1k
Rank
#1 / 49 | 34
Facility
34
NV AVG
36.2
Rank
#26 / 49 | 8.5
Facility
8.5
NV AVG
7.1
Rank
#37 / 49 | - | 167 | - | 63 | Clarissa Dewese | $20.7MFiscal year ending 12/2023
Facility
$20.7MFiscal year ending 12/2023
NV AVG
$18.7M
Rank
#10 / 47 | $12.1MFiscal year ending 12/2023
Facility
$12.1MFiscal year ending 12/2023
NV AVG
$6.3M
Rank
#11 / 47 | 58.6%Fiscal year ending 12/2023
Facility
58.6%Fiscal year ending 12/2023
NV AVG
34.9%
Rank
#21 / 47 | 295052 | ||||
| Marquis Centennial Hills | NH HOS RC SNF | Las Vegas (La Madre Foothills) | 115 | - | - | 3.52
Facility
3.52
NV AVG
4.03
Rank
#22 / 47 | -11% | -13% | $0
Facility
$0
NV AVG
$34.1k
Rank
#1 / 49 | 29
Facility
29
NV AVG
36.2
Rank
#17 / 49 | 4.8
Facility
4.8
NV AVG
7.1
Rank
#10 / 49 | - | 182 | - | 31 | Jacob Atwood | $14.9MFiscal year ending 12/2023
Facility
$14.9MFiscal year ending 12/2023
NV AVG
$18.7M
Rank
#26 / 47 | $8.8MFiscal year ending 12/2023
Facility
$8.8MFiscal year ending 12/2023
NV AVG
$6.3M
Rank
#23 / 47 | 59.3%Fiscal year ending 12/2023
Facility
59.3%Fiscal year ending 12/2023
NV AVG
34.9%
Rank
#20 / 47 | 295089 | ||||
| St. Joseph Transitional Rehabilitation Center | NH HOS RC SNF | Las Vegas (Rancho Oakey) | 100 |
98.0%
Facility
98.0%
NV AVG
79.4
Rank
#56 / 263 | +23% | 2.36
Facility
2.36
NV AVG
4.03
Rank
#47 / 47 | -11% | -42% | $0
Facility
$0
NV AVG
$34.1k
Rank
#1 / 49 | 25
Facility
25
NV AVG
36.2
Rank
#11 / 49 | 6.3
Facility
6.3
NV AVG
7.1
Rank
#20 / 49 | - | 98 | B- | 47 | - | $15.8MFiscal year ending 12/2023
Facility
$15.8MFiscal year ending 12/2023
NV AVG
$18.7M
Rank
#30 / 47 | $7.6MFiscal year ending 12/2023
Facility
$7.6MFiscal year ending 12/2023
NV AVG
$6.3M
Rank
#26 / 47 | 48.3%Fiscal year ending 12/2023
Facility
48.3%Fiscal year ending 12/2023
NV AVG
34.9%
Rank
#18 / 47 | 295040 |
Marquis Centennial Hills is located in Las Vegas, Nevada.
Here are the financial assistance programs available to residents in Nevada.
Marquis Centennial Hills is in the La Madre Foothills neighborhood of Las Vegas.
Marquis Centennial Hills has a walk score of 31. Somewhat walkable. A few nearby services may be reachable on foot, but most trips require transportation.
According to NV state health department records, Marquis Centennial Hills's license expires on December 31, 2026.
Marquis Centennial Hills's occupancy is 100%.
Marquis Centennial Hills is registered as a for-profit in NV.
Jacob Atwood is the administrator of Marquis Centennial Hills.
Marquis Centennial Hills has 115 beds.
Care Cost Calculator: See Prices in Your Area
Nursing Home Data Explorer
Don’t Wait Too Long: 7 Red Flag Signs Your Parent Needs Assisted Living Now
The True Cost of Assisted Living in 2025 – And How Families Are Paying For It
Understanding Senior Living Costs: Pricing Models, Discounts & Financial Assistance


