Qualicare Nursing Home
Nursing Home, Hospice Care, Palliative Care & Respite Care · Detroit, MI
CMS overall rating Info CMS (the Centers for Medicare & Medicaid Services) is the federal agency that rates nursing home quality. Its Overall Rating runs from 1 to 5 stars, combining health inspections, staffing, and quality measures, with inspections weighted most heavily.

Qualicare Nursing Home

Nursing Home, Hospice Care, Palliative Care & Respite Care · Detroit, MI
CMS overall rating Info CMS (the Centers for Medicare & Medicaid Services) is the federal agency that rates nursing home quality. Its Overall Rating runs from 1 to 5 stars, combining health inspections, staffing, and quality measures, with inspections weighted most heavily.
Calculator: See prices in your area
Qualicare Nursing Home accepts Medicare and private pay.

Overview of Qualicare Nursing Home

From short-term rehab stays to long-term nursing care, Qualicare Nursing Home dedicates itself to providing a personalized approach. With 24-hour nursing care, comprehensive rehab services, tube feeding, pain management, IV therapy, respite care, palliative care, and more, their skilled caregivers and healthcare professionals perform satisfactorily.
In addition to their exceptional medical care, Qualicare also offers amenities to enhance lives, such as a formal dining room, wireless internet, holiday events, and transportation for appointments. They believe in creating a warm and welcoming environment that feels like home, where residents can flourish and enjoy a sense of community.

Quality ratings

Measured by Centers for Medicare & Medicaid Services (CMS)

Overall rating Info The Overall CMS Rating combines results from health inspections, staffing levels and quality measures. Health inspections carry the most weight. Staffing and quality scores can increase or decrease the final rating based on performance compared to state and national standards.
▲ 27.5% Above MI avg. ▲ 27.5% Above MI avg.MI average: 3.1Click the badge to see the full State ranking.Click here to see the full State ranking.
Health Inspection Info Based on the results of the facility's three most recent standard inspections and any complaint investigations. CMS reviews the number, scope, and severity of deficiencies, with more recent findings weighted more heavily.
▲ 6.1% Above MI avg. ▲ 6.1% Above MI avg.MI average: 2.8Click the badge to see the full State ranking.Click here to see the full State ranking.
Staffing Info Measures average nursing staff hours per resident per day, including Registered Nurses (RNs) and total nursing staff. Ratings are adjusted based on the level of care residents require and are compared to state and national benchmarks.
▲ 14.4% Above MI avg. ▲ 14.4% Above MI avg.MI average: 3.5Click the badge to see the full State ranking.Click here to see the full State ranking.
Quality Measures Info Based on clinical and physical health indicators reported to CMS, such as hospital readmissions, falls, pressure ulcers, and improvements in mobility. These measures reflect how well residents' health needs are being managed.
▲ 33.0% Above MI avg. ▲ 33.0% Above MI avg.MI average: 3.8Click the badge to see the full State ranking.Click here to see the full State ranking.

Staffing hours breakdown

Info Daily nursing hours per resident by staff type, reported to CMS. Higher is generally better — compare this facility to state and national averages to see where staffing stands.

Hours per resident per day — compared to Michigan state averages

Total nursing care / resident Info This home is ranked 135th out of 142 homes in Michigan for nurse hours. Total adjusted nursing hours per resident per day, combining RN, LPN, and aide time. CMS adjusts this for case-mix so facilities can be fairly compared.
3h 16m per day
Rank #135 / 142Nurse hours — State benchmarkedThis home is ranked 135th out of 142 homes in Michigan. Shows adjusted nurse hours per resident per day benchmarked to the Michigan average, with a ranking across 142 Michigan facilities. More hours mean more direct care. The national average is about 3.5 hrs; below 3.0 is a red flag.Rankings are based only on facilities in Michigan that report data for that category. Facilities without available data are excluded from the ranking.Click the rank badge to see the full State ranking.Click here to see the full State ranking.
This facility Michigan avg (4h 18m per day)
vs Michigan avg
-24%

5 of 6 metrics below state avg

Standout metric Physical Therapist is +19% above state avg
Staff type Hours / Day / Resident vs state avg
Registered Nurse (RN) Info RNs hold the highest nursing license and can assess residents, interpret test results, and direct care plans. More RN hours per day often signals stronger clinical oversight and faster response to health changes. 29m per day ▼ 38% State avg: 46m per day · National avg: 41m per day
LPN / LVN Info Licensed Practical Nurses (LPNs) or Licensed Vocational Nurses (LVNs) deliver routine hands-on care — medication administration, wound dressing, and monitoring vital signs. They work under RN supervision and make up a large share of daily bedside care. 41m per day ▼ 22% State avg: 53m per day · National avg: 52m per day
Nurse Aide Info Certified Nurse Aides (CNAs) provide the most direct day-to-day assistance: bathing, dressing, feeding, and mobility. Nurse aide hours are typically the largest staffing category and directly affect residents' quality of life. 2h 7m per day ▼ 12% State avg: 2h 23m per day · National avg: 2h 21m per day
Weekend Total Nursing Info Combined nursing hours (RN + LPN + Nurse Aide) per resident per day on weekends. Staffing often drops on weekends — this figure reveals whether the facility maintains adequate coverage outside of weekday hours. 2h 58m per day ▼ 16% State avg: 3h 31m per day · National avg: 3h 26m per day
Physical Therapist Info Hours per resident per day provided by licensed Physical Therapists (PTs) or PT Assistants. PT services help residents recover mobility after injury or illness and are especially important for post-acute (short-stay) rehabilitation. 5m per day ▲ 19% State avg: 4m per day · National avg: 4m per day
Weekend RN Info Registered nurse hours specifically on weekends. Facilities sometimes reduce RN presence on Saturdays and Sundays — a low weekend RN figure compared to weekday hours can indicate reduced clinical oversight when most administrative staff are absent. 17m per day ▼ 40% State avg: 29m per day · National avg: 29m per day

Capacity and availability

This home usually has limited availability

Higher occupancy than the Michigan average: 75.8%
Occupancy rate
94.1% Rank #16 / 395Occupancy rate — State benchmarkedThis home is ranked 16th out of 395 homes in Michigan. Shows this facility's occupancy rate versus the Michigan average, with its Statewide rank out of 395. Higher occupancy signals strong local demand and financial stability.Rankings are based only on facilities in Michigan that report data for that category. Facilities without available data are excluded from the ranking.Click the rank badge to see the full State ranking.Click here to see the full State ranking.
Avg. Length of Stay
137 days
Bed community size
96-bed community Rank #143 / 435Bed count — State benchmarkedThis home is ranked 143rd out of 435 homes in Michigan. Shows this facility's certified or reported bed count compared to other Michigan facilities. Larger communities may offer more amenities, programs, and on-site services for residents and families.Rankings are based only on facilities in Michigan that report data for that category. Facilities without available data are excluded from the ranking.Click the rank badge to see the full State ranking.Click here to see the full State ranking.
A larger shared setting that may offer more common spaces and organized community services.
Years in operation
30 years in operation Rank #72 / 182Years in operation — State benchmarkedThis home is ranked 72nd out of 182 homes in Michigan. Shows how long this facility has been in operation compared to other Michigan facilities. Longer operating histories may benefit residents, families, and staff.Rankings are based only on facilities in Michigan that report data for that category. Facilities without available data are excluded from the ranking.Click the rank badge to see the full State ranking.Click here to see the full State ranking.
A longer operating history, which may indicate experience navigating regulations and delivering ongoing care.
Walk Score
Walk Score: 48 / 100 Rank #232 / 703Walk Score — State benchmarkedThis home is ranked 232nd out of 703 homes in Michigan. Shows how walkable this facility's neighborhood is compared to the average Walk Score across Michigan facilities. Higher scores benefit residents, families, and staff.Rankings are based only on facilities in Michigan that report data for that category. Facilities without available data are excluded from the ranking.Click the rank badge to see the full State ranking.Click here to see the full State ranking.
Somewhat walkable. A few nearby services may be reachable on foot, but most trips require transportation.
BBB Rating
BBB Rating: A+ (Not Accredited)
An independent rating from the Better Business Bureau based on factors such as complaint history, transparency, and business practices.
How BBB ratings work

About this community

License Details

CMS Certification Number235622

Staffing

Key information about the people who lead and staff this community.

Leadership

ContactMr. Kamran Chaudhry, Director

Payment & Insurance

1 service
Accept Medicare

Therapy & Rehabilitation

3 services
Rehabilitation Services
Respite Care
Short-Term Rehab

Staffing & Medical

2 services
Doctor on Staff
24-Hour Staffing

Additional Services

1 service
Short-Term Rehabilitation

Amenities & Lifestyle

Formal Dining Room
Personal Televisions
Complimentary Cable
Complimentary Wireless Internet
Transportation To Appointments
Special Holiday Events
Specific ProgramsNursing & Rehabilitation, Bariatric Care, Case Management, Discharge Planning, and Social Work, Comprehensive Dental Care, Infectious Disease Management, IV Therapy, Ophthalmology, Vision Care, & Audiology Services, Pain Management, Pharmacy, Laboratory, and Radiology Services, Physical Therapy Services, Podiatry Services, Sepsis Program, Short-Term Nursing and Rehabilitation, Speech Therapy / Speech Language Pathology, Substance Abuse Management Services, Total Parenteral Nutrition (TPN), Tracheostomy Care, Tube Feeding Care

Contact Qualicare Nursing Home

Inspection History

In Michigan, the Department of Licensing and Regulatory Affairs (LARA) conducts unannounced inspections and investigations to ensure long-term care facilities comply with state health codes.

Since 2023 · 3 years of data 15 deficiencies

Inspection Scorecard Info This scorecard compares key inspection, deficiency, and complaint metrics at this facility against the Michigan state average. Metrics rated ≥15% worse than average are highlighted in red; those ≥15% better are highlighted in green.

Since 2023 vs. Michigan state average
Overall vs. MI average 2 Worse Metrics worse than Michigan average:
• Total deficiencies (88% above)
• Deficiencies per year (85% above)
0 Better No metrics in this bucket.
Latest Inspection July 24, 2025 Complaint Investigation

Deficiencies Info Deficiencies are formal regulatory issues recorded during state inspections.

This Facility MI Average vs. MI Avg
Total deficiencies Info Formal regulatory issues recorded by inspectors across all inspection types. 15 8 This facility has 88% more total deficiencies than a typical Michigan nursing home (15 vs. MI avg 8).↑ 88% worse
Deficiencies per year Info Average deficiencies per year since 2023. 5 2.7 This facility has 85% more deficiencies per year than a typical Michigan nursing home (5 vs. MI avg 2.7).↑ 85% worse

Inspection Reports Summary Info An editor-reviewed summary of the themes and findings across this facility's recent inspection reports.

  • July 24, 2025 complaint investigation found failure to promptly assess and treat a resident’s severe leg pain, causing delayed hip fracture diagnosis and actual harm requiring surgery.
  • Multiple complaint investigations from March to July 2024 documented failures in supervision, verbal abuse, and inadequate ADL, wound, and catheter care, with staff terminations but recurring care and safety issues.
  • February 12, 2025 routine inspection cited four deficiencies in dignified feeding, advance directives, and medication storage, with no harm reported and no complaints substantiated at that time.

Health Inspection History

Inspections since 2023
Total health inspections 6

Michigan average 6.5


Last Health inspection on Jul 2025

Total health citations
15 Rank #24 / 144Health citations — State benchmarkedThis home is ranked 24th out of 144 homes in Michigan. Shows this facility's total health deficiency citations benchmarked to the Michigan State average, with a ranking across all 144 MI facilities. Lower citation counts earn a better rank.Rankings are based only on facilities in Michigan that report data for that category. Facilities without available data are excluded from the ranking.Click the rank badge to see the full State ranking.Click here to see the full State ranking.

Michigan average 33.5

Citations per inspection
2.5 Rank #9 / 144Citations per inspection — State benchmarkedThis home is ranked 9th out of 144 homes in Michigan. Shows average deficiency citations per CMS inspection for this facility versus the Michigan mean across 144 facilities with citation data. Lower is better.Rankings are based only on facilities in Michigan that report data for that category. Facilities without available data are excluded from the ranking.Click the rank badge to see the full State ranking.Click here to see the full State ranking.

Michigan average 5.18


Health citations are formal notices following inspections when they fail to comply with safety and care standards.

9 of 15 citations resulted from standard inspections; and 6 of 15 resulted from complaint investigations.

Breakdown of citation severity (last 3 years)
Critical health citations
0
100% better than Michigan average

Michigan average: 0.3


Serious health citations
1
47% better than Michigan average

Michigan average: 1.9

0 critical citations Michigan average: 0.3

1 serious citation Michigan average: 1.9

14 moderate citations Michigan average: 30.8

0 minor citations Michigan average: 0.5
Citations history (last 3 years)
Quality of Care serious citation Jul 24, 2025
Corrected

Pharmacy moderate citation Feb 12, 2025
Corrected

Quality of Care moderate citation Feb 12, 2025
Corrected

Resident Rights moderate citation Feb 12, 2025
Corrected

Staffing Data

Reporting period: October 1 – December 31, 2025 (Q4 2025). Source: CMS Payroll-Based Journal report.

Total staff 113
Employees 95
Contractors 18
Staff to resident ratio 1.27 : 1
25% fewer staff per resident than Michigan average
Michigan average ratio: 1.70 : 1 Michigan average ratio: 1.70 : 1See full Michigan ranking
Avg staff/day 49
Average shift 7.3 hours
8% worse than Michigan average
Michigan average: 7.9 hours Michigan average shift: 7.9 hoursSee full Michigan ranking
Total staff hours (quarter) 33,043

Nursing staff breakdown

Q4 2025 · Oct 1 – Dec 31 More info This data comes from the CMS Payroll-Based Journal report covering October 1 – December 31, 2025.
Registered Nurse

Manages medical care and health needs.

RN Staff Info All 10 RN Staff are full-time employees. No contractors work on this role. 10
Average shift length Info Average shift length. Calculated as total hours divided by days worked and average staff per day. 7.6 hours
Licensed Practical Nurse

Assists with medical care and medications.

LPN Staff Info All 17 LPN Staff are full-time employees. No contractors work on this role. 17
Average shift length Info Average shift length. Calculated as total hours divided by days worked and average staff per day. 7.3 hours
Certified Nursing Assistant

Helps with daily care and mobility.

CNA Staff Info All 57 CNA Staff are full-time employees. No contractors work on this role. 57
Average shift length Info Average shift length. Calculated as total hours divided by days worked and average staff per day. 7.5 hours

Contractor staffing

Q4 2025 · Oct 1 – Dec 31 More info This data comes from the CMS Payroll-Based Journal report covering October 1 – December 31, 2025.

Total hours from contractors

7.9%

2,597 contractor hours this quarter

Physical Therapy Assistant: 3 Respiratory Therapy Technician: 3 Occupational Therapy Assistant: 3 Physical Therapy Aide: 2 Speech Language Pathologist: 2 Medical Director: 2 Qualified Social Worker: 1 Occupational Therapy Aide: 1 Clinical Nurse Specialist: 1

Staff by category

Q4 2025 · Oct 1 – Dec 31 More info This data comes from the CMS Payroll-Based Journal report covering October 1 – December 31, 2025.
Certified Nursing Assistant 57 0 57 17,957 92 100% 7.5
Licensed Practical Nurse 17 0 17 5,388 92 100% 7.3
Registered Nurse 10 0 10 2,870 92 100% 7.6
Other Dietary Services Staff 4 0 4 1,551 92 100% 7.9
Clinical Nurse Specialist 2 1 3 714 81 88% 7.7
Respiratory Therapy Technician 0 3 3 678 81 88% 5.4
Physical Therapy Assistant 0 3 3 563 82 89% 6.2
Speech Language Pathologist 0 2 2 524 64 70% 6.2
Physical Therapy Aide 0 2 2 512 66 72% 7.1
Mental Health Service Worker 1 0 1 512 64 70% 8
Nurse Practitioner 1 0 1 472 59 64% 8
RN Director of Nursing 1 0 1 460 48 52% 9.6
Administrator 1 0 1 456 57 62% 8
Dietitian 1 0 1 136 17 18% 8
Occupational Therapy Aide 0 1 1 130 19 21% 6.8
Occupational Therapy Assistant 0 3 3 52 44 48% 1.2
Qualified Social Worker 0 1 1 38 26 28% 1.5
Medical Director 0 2 2 30 12 13% 2.5
57 Certified Nursing Assistant
% of Days 100%
17 Licensed Practical Nurse
% of Days 100%
10 Registered Nurse
% of Days 100%
4 Other Dietary Services Staff
% of Days 100%
3 Clinical Nurse Specialist
% of Days 88%
3 Respiratory Therapy Technician
% of Days 88%
3 Physical Therapy Assistant
% of Days 89%
2 Speech Language Pathologist
% of Days 70%
2 Physical Therapy Aide
% of Days 72%
1 Mental Health Service Worker
% of Days 70%
1 Nurse Practitioner
% of Days 64%
1 RN Director of Nursing
% of Days 52%
1 Administrator
% of Days 62%
1 Dietitian
% of Days 18%
1 Occupational Therapy Aide
% of Days 21%
3 Occupational Therapy Assistant
% of Days 48%
1 Qualified Social Worker
% of Days 28%
2 Medical Director
% of Days 13%

Penalties and fines

Federal penalties imposed by CMS for regulatory violations, including civil money penalties (fines) and denials of payment for new Medicare/Medicaid admissions.

Source: CMS Penalties Database

No penalties in the past 3 years

No civil money penalties or payment denials were reported in the last 3 years.

Quality of care over time

These measures show how residents usually do over time at this home, based on health outcomes and preventive care.

High-risk clinical events score Info A composite score based on pressure ulcers, falls with injury, weight loss, walking ability decline, and activities of daily living decline. 5.1
39% better than Michigan average

Michigan average: 8.4

Functional decline score Info A composite score based on activities of daily living decline, walking ability decline, and incontinence. 9.1
44% better than Michigan average

Michigan average: 16.3

Long-stay resident measures
Significantly above average Michigan avg: 4.1 Info CMS star rating based on long-stay quality measure performance. 5 stars = significantly above average, 1 star = significantly below average.
Need for Help with Daily Activities Increased Info Percent of long-stay residents whose need for help with daily activities has increased 8.5%
32% better than Michigan average

Michigan average: 12.5%

Walking Ability Worsened Info Percent of long-stay residents whose ability to move independently worsened 9.4%
39% better than Michigan average

Michigan average: 15.3%

Low Risk Residents with Bowel/Bladder Incontinence Info Percent of low risk long-stay residents who lose control of their bowels or bladder 9.4%
55% better than Michigan average

Michigan average: 21.0%

Falls with Major Injury Info Percent of long-stay residents experiencing one or more falls with major injury 1.5%
53% better than Michigan average

Michigan average: 3.2%

High Risk Residents with Pressure Ulcers Info Percent of long-stay high risk residents with pressure ulcers 4.2%
28% better than Michigan average

Michigan average: 5.7%

Urinary Tract Infection Info Percent of long-stay residents with a urinary tract infection 0.0%
100% better than Michigan average

Michigan average: 1.7%

Lost Too Much Weight Info Percent of long-stay residents who lose too much weight 1.8%
68% better than Michigan average

Michigan average: 5.7%

Depressive Symptoms Info Percent of long-stay residents who have depressive symptoms 1.0%
73% better than Michigan average

Michigan average: 3.9%

Antipsychotic Use Info Percent of long-stay residents who received an antipsychotic medication 12.8%
14% better than Michigan average

Michigan average: 15.0%

Pneumococcal Vaccine Info Percent of long-stay residents assessed and appropriately given the pneumococcal vaccine 96.5%
In line with Michigan average

Michigan average: 94.9%

Influenza Vaccine Info Percent of long-stay residents assessed and appropriately given the seasonal influenza vaccine 92.3%
In line with Michigan average

Michigan average: 95.0%

Short-stay resident measures
Pneumococcal Vaccine Info Percent of short-stay residents assessed and appropriately given the pneumococcal vaccine 65.3%
21% worse than Michigan average

Michigan average: 82.5%

Antipsychotic medication increase Info Percent of short-stay residents who newly received an antipsychotic medication 2.5%
73% worse than Michigan average

Michigan average: 1.4%

Influenza Vaccine Info Percent of short-stay residents assessed and appropriately given the seasonal influenza vaccine 59.6%
25% worse than Michigan average

Michigan average: 79.5%

Falls with major injury Info Percentage of SNF residents who experience falls with major injury during their stay. 0.0%
100% better than Michigan average

Michigan average: 0.8%

Successful return to home or community Info Rate of successful return to home or community from a skilled nursing facility. 38.1%
25% worse than Michigan average

Michigan average: 50.6%

Breakdown by payment type

Medicare

15% of new residents, usually for short-term rehab.

Typical stay 1 - 2 months

Private pay

85% of new residents, often for short stays.

Typical stay 5 - 6 months

Facility Characteristics

Source: CMS Long-Term Care Facility Characteristics (Data as of Jan 2026)

Total residents 89
Medicare
11
12.4% of residents
Medicaid
73
82% of residents
Private pay or other
5
5.6% of residents
Programs & Services
Residents Group

Residents meet regularly to discuss policies, care quality, and activities

Active Resident Council

Organized group of residents that meets regularly to discuss facility policies, quality of life, and activities.

Finances and operations

Based on CMS SNF Cost Report for fiscal year ending in 12/2023.

For-profit
Corporation
Net patient revenue Info Net patient revenue — what the home actually collects for resident care, after contractual allowances, bad debt and discounts are subtracted from its gross charges (CMS cost report, Worksheet G-3). It covers resident care only; money the home earns from other sources is shown separately as "Other income."
$10.9M
Net patient income Info Net patient income: net patient revenue minus the home's total operating expenses. A positive figure means it earns more from resident care than it spends to deliver it; a negative figure means the opposite. It excludes non-operating "other income."
-$1.2M
For-profit Corporation
Net patient revenue Info Net patient revenue — what the home actually collects for resident care, after contractual allowances, bad debt and discounts are subtracted from its gross charges (CMS cost report, Worksheet G-3). It covers resident care only; money the home earns from other sources is shown separately as "Other income."
$10.9M Rank #57 / 143Revenue — State benchmarkedThis home is ranked 57th out of 143 homes in Michigan. Shows this facility's annual revenue compared to the Michigan average. Higher revenue generally means more resources for staffing and capital — read alongside Payroll %.Rankings are based only on facilities in Michigan that report data for that category. Facilities without available data are excluded from the ranking.Click the rank badge to see the full State ranking.Click here to see the full State ranking.
Net patient income Info Net patient income: net patient revenue minus the home's total operating expenses. A positive figure means it earns more from resident care than it spends to deliver it; a negative figure means the opposite. It excludes non-operating "other income."
-$1.2M
Other income Info Money the home earns outside of resident care — such as investments, grants, rentals and other non-operating sources (CMS cost report, Worksheet G-3). It is tracked separately from net patient revenue: it is not part of that figure, and it is not included in net patient income.
$678.5K
Payroll costs Info Staff salaries plus wage-related costs — benefits such as payroll taxes, health insurance and retirement — from the home's own accounting records (CMS cost report, Worksheet A). Contract or agency labor is counted separately, under other operating costs. Rank #77 / 143Payroll — State benchmarkedThis home is ranked 77th out of 143 homes in Michigan. Shows total annual staff payroll benchmarked to the Michigan average. Higher payroll investment relative to peers often signals better staffing and less reliance on cheaper contract labor.Rankings are based only on facilities in Michigan that report data for that category. Facilities without available data are excluded from the ranking.Click the rank badge to see the full State ranking.Click here to see the full State ranking.
$6.0M 54.9% of net patient revenue Info Payroll as a share of revenue: staff salaries and wage-related benefits divided by net patient revenue. A higher figure means more of each revenue dollar goes to staff pay. Rank #111 / 143Payroll % — State benchmarkedThis home is ranked 111th out of 143 homes in Michigan. Shows payroll as a percentage of revenue versus the Michigan average. Well-run Michigan facilities typically land around 49–59% — the top third Statewide. Below 25% may signal understaffing or heavy agency use — read with Staffing ratings.Rankings are based only on facilities in Michigan that report data for that category. Facilities without available data are excluded from the ranking.Click the rank badge to see the full State ranking.Click here to see the full State ranking.
Other operating costs Info Everything it costs to run the home apart from payroll — food, utilities, supplies, maintenance, contract labor and administration. Calculated as total operating expense minus payroll (staff salaries and wage-related benefits).
$6.2M
Total costs Info The home's total operating expense for the year — all the costs of running it, salaries included (CMS cost report, Worksheet G-3).
$12.2M

Who this home usually serves

TYPE OF STAY

Primarily short stays

Residents typically stay for brief periods, with frequent admissions and discharges throughout the year.

Most new residents arrive under private pay (85% of admissions), and a typical private pay stay runs around 5 - 6 months.

Admissions
239 total

Coverage residents most often arrive under.

Medicare 15%
Private pay 85%
Discharges
240 total

Coverage residents most often leave under.

Medicare 15%
Private pay 85%

Places of interest near Qualicare Nursing Home

Address 2.7 miles from city center Info Estimated distance in miles from Detroit's city center to Qualicare Nursing Home's address, calculated via Google Maps.

Calculate Travel Distance to Qualicare Nursing Home

Add your location

Address

Compare Nursing Homes around Detroit

The information below is reported by the Michigan Department of Licensing and Regulatory Affairs (LARA).

5 facilities compared · CMS & MI Dept. of Health data

West Oaks Senior Care & Rehab Center
NH
Detroit (Berg-Lahser)
102
Facility 102
MI AVG 75
Rank #121 / 435
81.5%
Facility 81.5%
MI AVG 75.8%
Rank #77 / 395
+8%
4.39
Facility 4.39
MI AVG 4.30
Rank #39 / 142
-26% +2%
$0
Facility $0
MI AVG $87.6k
Rank #1 / 145
16
Facility 16
MI AVG 33.5
Rank #28 / 144
2.0
Facility 2.0
MI AVG 5.2
Rank #5 / 144
- 99 -
59
Facility 59
MI AVG 39
Rank #137 / 703
Rosemary Gardner
$10.5M
Facility $10.5M
MI AVG $15.8M
Rank #89 / 143
$6.6M
Facility $6.6M
MI AVG $5.6M
Rank #69 / 143
62.8%
Facility 62.8%
MI AVG 39%
Rank #32 / 143
235374
Allegria Village
NH
AL
IL
MC
Dearborn
132
Facility 132
MI AVG 75
Rank #55 / 435
53.0%
Facility 53.0%
MI AVG 75.8%
Rank #185 / 395
-30%
4.72
Facility 4.72
MI AVG 4.30
Rank #32 / 142
-20% +10%
$0
Facility $0
MI AVG $87.6k
Rank #1 / 145
16
Facility 16
MI AVG 33.5
Rank #28 / 144
3.2
Facility 3.2
MI AVG 5.2
Rank #28 / 144
1 81 D-
52
Facility 52
MI AVG 39
Rank #201 / 703
Firo Operator LLC
$30.4M
Facility $30.4M
MI AVG $15.8M
Rank #8 / 143
$17.0M
Facility $17.0M
MI AVG $5.6M
Rank #9 / 143
56%
Facility 56%
MI AVG 39%
Rank #48 / 143
235593
Qualicare Nursing Home
NH
HC
PC
RC
Detroit (Islandview)
96
Facility 96
MI AVG 75
Rank #143 / 435
94.1%
Facility 94.1%
MI AVG 75.8%
Rank #16 / 395
+24%
3.26
Facility 3.26
MI AVG 4.30
Rank #135 / 142
-14% -24%
$0
Facility $0
MI AVG $87.6k
Rank #1 / 145
15
Facility 15
MI AVG 33.5
Rank #24 / 144
2.5
Facility 2.5
MI AVG 5.2
Rank #9 / 144
1 93 A+
48
Facility 48
MI AVG 39
Rank #232 / 703
Carney Bradford
$10.9M
Facility $10.9M
MI AVG $15.8M
Rank #57 / 143
$6.0M
Facility $6.0M
MI AVG $5.6M
Rank #77 / 143
54.9%
Facility 54.9%
MI AVG 39%
Rank #111 / 143
235622
Westwood Nursing Center
NH
NC
Detroit (Harmony Village)
108
Facility 108
MI AVG 75
Rank #104 / 435
65.1%
Facility 65.1%
MI AVG 75.8%
Rank #145 / 395
-14%
3.15
Facility 3.15
MI AVG 4.30
Rank #138 / 142
-27% -27%
$45.9k
Facility $45.9k
MI AVG $87.6k
Rank #108 / 145
44
Facility 44
MI AVG 33.5
Rank #99 / 144
4.9
Facility 4.9
MI AVG 5.2
Rank #68 / 144
- 107 -
76
Facility 76
MI AVG 39
Rank #47 / 703
Amee Patel
$7.5M
Facility $7.5M
MI AVG $15.8M
Rank #64 / 143
$5.2M
Facility $5.2M
MI AVG $5.6M
Rank #102 / 143
70%
Facility 70%
MI AVG 39%
Rank #135 / 143
235444
The Orchards at Northwest
NH
AL
MC
RC
Detroit (Hubbell-Puritan)
154
Facility 154
MI AVG 75
Rank #29 / 435
83.3%
Facility 83.3%
MI AVG 75.8%
Rank #61 / 395
+10%
3.79
Facility 3.79
MI AVG 4.30
Rank #94 / 142
-61% -12%
$15.9k
Facility $15.9k
MI AVG $87.6k
Rank #96 / 145
39
Facility 39
MI AVG 33.5
Rank #94 / 144
6.5
Facility 6.5
MI AVG 5.2
Rank #102 / 144
1 113 -
51
Facility 51
MI AVG 39
Rank #208 / 703
Northwest Opco Holdco LLC
$12.9M
Facility $12.9M
MI AVG $15.8M
Rank #93 / 143
$6.2M
Facility $6.2M
MI AVG $5.6M
Rank #84 / 143
48.1%
Facility 48.1%
MI AVG 39%
Rank #52 / 143
235539

Financial Assistance for
Nursing Home in Michigan

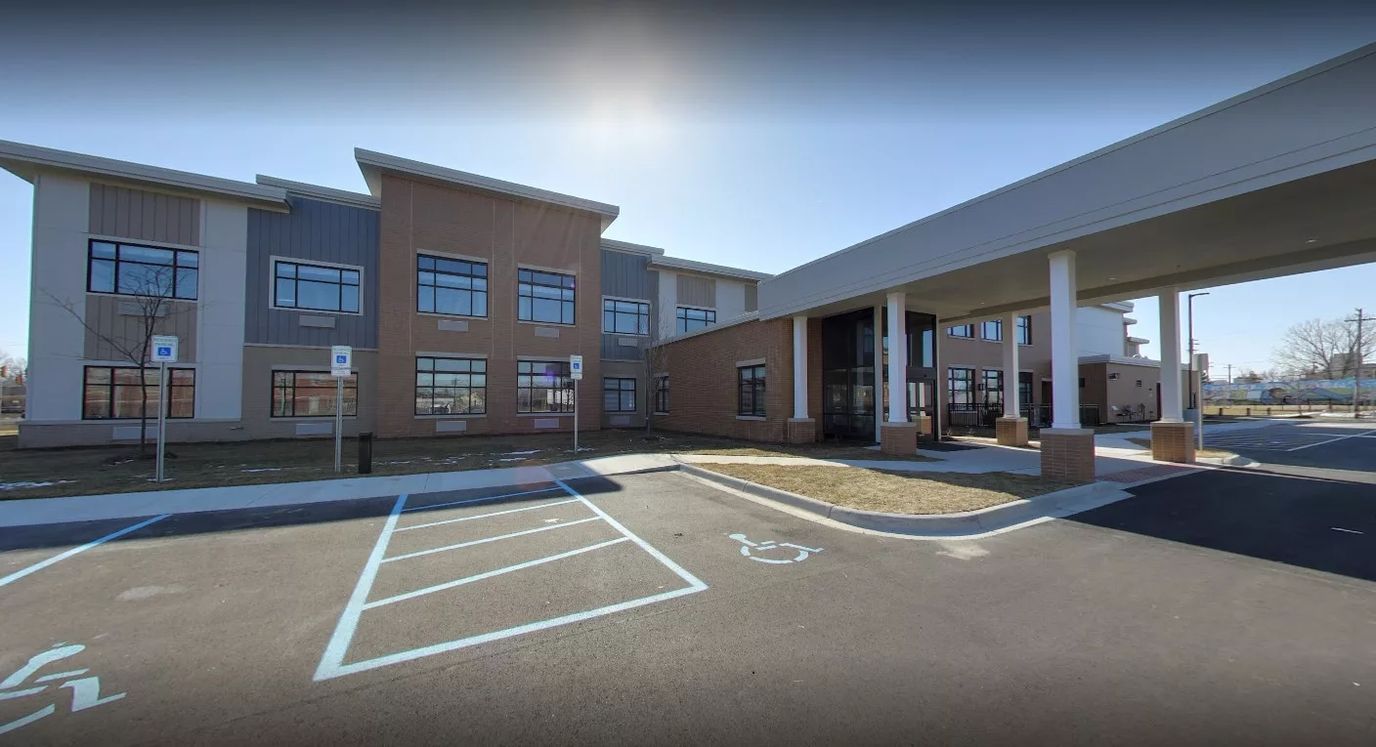
Qualicare Nursing Home is located in Detroit, Michigan.
Here are the financial assistance programs available to residents in Michigan.

Get Financial aid guidance

MI Choice Waiver

Michigan Medicaid MI Choice Waiver

Age 65+ or disabled
General Michigan resident, Medicaid- eligible, nursing home-level care need.
Income Limits (2025) ~$2,829/month 300% FBR, individual
Asset Limits $2,000 (individual), $3,000 (couple).
MI

Delivered through regional waiver agents; waitlists possible.

Benefits
Personal care (5-7 hours/day) Respite care (240 hours/year) Home modifications ($1,500 avg.) Adult day care ($65/day)

Home Help Program

Michigan Home Help

Age 65+ or disabled
General Michigan resident, Medicaid- eligible or low-income.
Income Limits ~$1,732/month individual, Medicaid threshold
Asset Limits $2,000 individual
MI

Can hire family caregivers; less intensive than waiver.

Benefits
Personal care (up to 60 hours/month) Homemaker services Respite (varies)

Program of All-Inclusive Care for the Elderly (PACE)

Michigan PACE

Age 55+
General Michigan resident, nursing home-level care need, safe with PACE support.
Income Limits (2025) ~$2,829/month (Medicaid-eligible); private pay option available.
Asset Limits $2,000 (individual), $3,000 (couple).
MI

16 PACE centers (e.g., Ingham, Wayne counties); expanding slowly.

Benefits
Personal care (5-7 hours/day) Medical care Meals Transportation Therapy Respite

Medicare Savings Program (MSP)

Michigan Medicare Savings Program

Age 65+ or disabled
General Michigan resident, Medicare Part A/B.
Income Limits (2025) ~$2,510/month (QMB), ~$3,380/month (SLMB), ~$3,598/month (QI)—individual.
Asset Limits $9,430 (individual), $14,130 (couple).
MI

Three tiers; no waitlist; includes Extra Help for Part D.

Benefits
Covers Part B premiums ($174.70/month) Deductibles ($240/year) Copays (~20%)

National Family Caregiver Support Program (NFCSP) Respite

Michigan NFCSP Respite Care

Age
General Caregivers of 60+ needing care or 55+ caregivers of others; Michigan resident; functional needs (2+ ADLs).
Income Limits (2025) Prioritizes ~$24,980/year (individual); no strict cap.
Asset Limits Not assessed; need-based.
MI

16 AAAs; prioritizes low-income, rural caregivers.

Benefits
Respite (4-6 hours/week or 5 days/year) Adult day care ($60/day) Caregiver training

VA Aid and Attendance (A&A) and Housebound Benefits

Michigan VA Aid and Attendance/Housebound

Age 65+ or disabled veteran/spouse
General Michigan resident, wartime service, need for ADL help (A&A) or homebound.
Income Limits (2025) Net income < ~$1,984/month (veteran with dependent, A&A); pension offsets income.
Asset Limits ~$155,356 net worth limit
MI

High veteran demand in urban/rural areas.

Benefits
Cash (~$1,433-$2,642/month veteran, ~$951-$1,318 spouse) for care costs

Frequently Asked Questions about Qualicare Nursing Home

What neighborhood is Qualicare Nursing Home in?

Qualicare Nursing Home is in the Islandview neighborhood of Detroit.

Is Qualicare Nursing Home in a walkable area?

Qualicare Nursing Home has a walk score of 48. Somewhat walkable. A few nearby services may be reachable on foot, but most trips require transportation.

What is the occupancy rate at Qualicare Nursing Home?

Qualicare Nursing Home's occupancy is 94.1%.

Does Qualicare Nursing Home operate as a for-profit or non-profit?

Qualicare Nursing Home is registered as a for-profit in MI.

Are there photos of Qualicare Nursing Home?

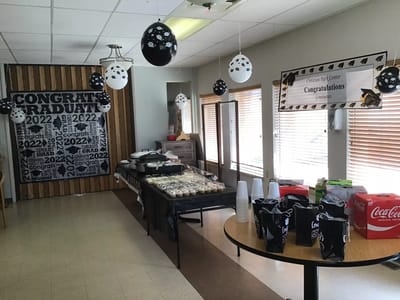
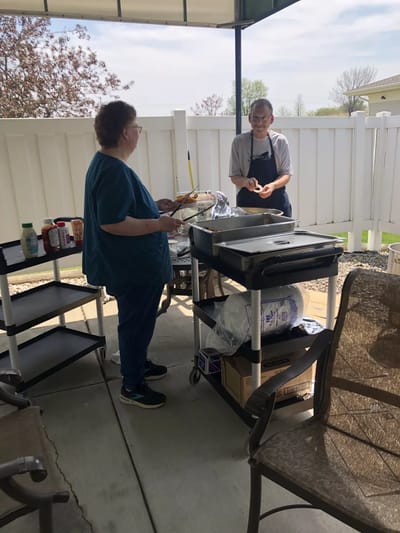
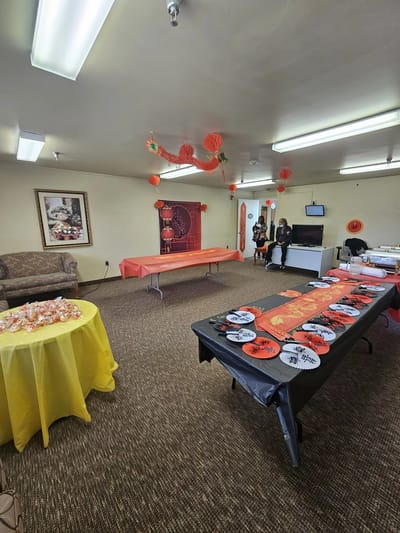
Yes — there are 4 photos of Qualicare Nursing Home in the photo gallery on this page.

What is the address of Qualicare Nursing Home?

Qualicare Nursing Home is located at 695 E Grand Blvd, Detroit, MI 48207.

What is the phone number of Qualicare Nursing Home?

(313) 925-6655 will put you in contact with the team at Qualicare Nursing Home.

Guides for Better Senior Living

Care Cost Calculator: See Prices in Your Area

Nursing Home Data Explorer

Don’t Wait Too Long: 7 Red Flag Signs Your Parent Needs Assisted Living Now

The True Cost of Assisted Living in 2025 – And How Families Are Paying For It

Understanding Senior Living Costs: Pricing Models, Discounts & Financial Assistance