Christian Health Center of Louisville
CMS overall rating Info CMS (the Centers for Medicare & Medicaid Services) is the federal agency that rates nursing home quality. Its Overall Rating runs from 1 to 5 stars, combining health inspections, staffing, and quality measures, with inspections weighted most heavily.

Christian Health Center of Louisville

CMS overall rating Info CMS (the Centers for Medicare & Medicaid Services) is the federal agency that rates nursing home quality. Its Overall Rating runs from 1 to 5 stars, combining health inspections, staffing, and quality measures, with inspections weighted most heavily.
Calculator: See prices in your area
Christian Health Center of Louisville accepts Medicare, Medicaid, and private pay.

Overview of Christian Health Center of Louisville

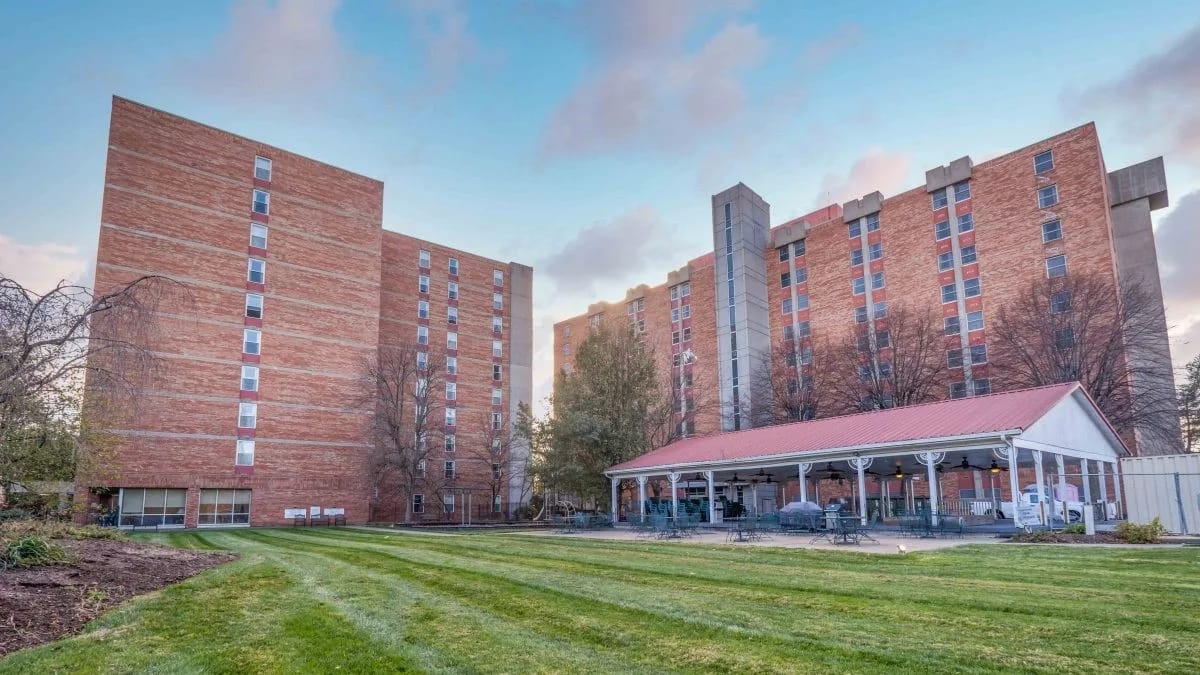
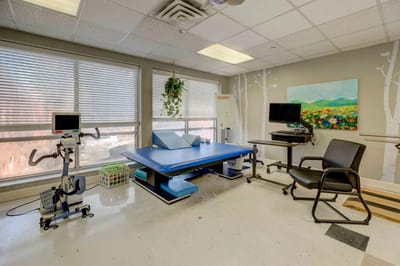
Christian Health Center of Louisville has been a cherished haven for seniors since its inception in 1884. Steeped in history and tradition, this esteemed facility provides a homey backdrop for seniors. Their staff is available 24 hours a day, providing exceptional support for both short-term rehabilitation and long-term skilled nursing needs. Various therapies are crafted to suit distinct circumstances, while private and semi-private rooms offer unmatched comfort and privacy. 
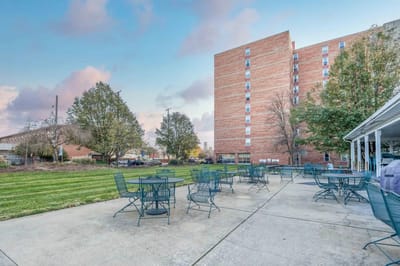
With an on-site chaplain, residents also have access to spiritual support that nurtures their faith and provides comfort during challenging times. The dining service is a culinary delight, offering delicious and nutritious meals, while the salon and barber shop renders opportunities for self-care. The outdoor spaces are a true treasure as well. With a balcony and other outdoor areas, residents can enjoy morning walks amidst the refreshing natural surroundings. These spaces provide opportunities for rejuvenation, and connection with nature, promoting holistic wellness in their twilight years.

(502) 778-0001

Quality ratings

Measured by Centers for Medicare & Medicaid Services (CMS)

Overall rating Info The Overall CMS Rating combines results from health inspections, staffing levels and quality measures. Health inspections carry the most weight. Staffing and quality scores can increase or decrease the final rating based on performance compared to state and national standards.
▼ 64.5% Below KY avg. ▼ 64.5% Below KY avg.Click the badge to see the full State ranking.Click here to see the full State ranking.
Health Inspection Info Based on the results of the facility's three most recent standard inspections and any complaint investigations. CMS reviews the number, scope, and severity of deficiencies, with more recent findings weighted more heavily.
▼ 31.4% Below KY avg. ▼ 31.4% Below KY avg.Click the badge to see the full State ranking.Click here to see the full State ranking.
Staffing Info Measures average nursing staff hours per resident per day, including Registered Nurses (RNs) and total nursing staff. Ratings are adjusted based on the level of care residents require and are compared to state and national benchmarks.
▼ 62.5% Below KY avg. ▼ 62.5% Below KY avg.Click the badge to see the full State ranking.Click here to see the full State ranking.
Quality Measures Info Based on clinical and physical health indicators reported to CMS, such as hospital readmissions, falls, pressure ulcers, and improvements in mobility. These measures reflect how well residents' health needs are being managed.
▲ 3.6% Above KY avg. ▲ 3.6% Above KY avg.Click the badge to see the full State ranking.Click here to see the full State ranking.

Staffing hours breakdown

Info Daily nursing hours per resident by staff type, reported to CMS. Higher is generally better — compare this facility to state and national averages to see where staffing stands.

Hours per resident per day — compared to Kentucky state averages

Total nursing care / resident Info This home is ranked 74th out of 184 homes in Kentucky for nurse hours. Total adjusted nursing hours per resident per day, combining RN, LPN, and aide time. CMS adjusts this for case-mix so facilities can be fairly compared.
3h 27m per day
Rank #74 / 184Nurse hours — State benchmarkedThis home is ranked 74th out of 184 homes in Kentucky for nurse hours. Shows adjusted nurse hours per resident per day benchmarked to the Kentucky average, with a ranking across 184 Kentucky SNFs. More hours mean more direct care. The national average is about 3.5 hrs; below 3.0 is a red flag.Click the rank badge to see the full State ranking.Click here to see the full State ranking.
This facility Kentucky avg (3h 45m per day)
vs Kentucky avg
-8%

5 of 6 metrics below state avg

Standout metric LPN / LVN is +8% above state avg
Staff typeHours / Day / Residentvs state avg
Registered Nurse (RN) Info RNs hold the highest nursing license and can assess residents, interpret test results, and direct care plans. More RN hours per day often signals stronger clinical oversight and faster response to health changes. 29m per day ▼ 37% State avg: 46m per day · National avg: 41m per day
LPN / LVN Info Licensed Practical Nurses (LPNs) or Licensed Vocational Nurses (LVNs) deliver routine hands-on care — medication administration, wound dressing, and monitoring vital signs. They work under RN supervision and make up a large share of daily bedside care. 53m per day ▲ 8% State avg: 49m per day · National avg: 52m per day
Nurse Aide Info Certified Nurse Aides (CNAs) provide the most direct day-to-day assistance: bathing, dressing, feeding, and mobility. Nurse aide hours are typically the largest staffing category and directly affect residents' quality of life. 2h 10m per day ▼ 10% State avg: 2h 25m per day · National avg: 2h 21m per day
Weekend Total Nursing Info Combined nursing hours (RN + LPN + Nurse Aide) per resident per day on weekends. Staffing often drops on weekends — this figure reveals whether the facility maintains adequate coverage outside of weekday hours. 2h 49m per day ▼ 19% State avg: 3h 29m per day · National avg: 3h 26m per day
Physical Therapist Info Hours per resident per day provided by licensed Physical Therapists (PTs) or PT Assistants. PT services help residents recover mobility after injury or illness and are especially important for post-acute (short-stay) rehabilitation. 3m per day ▼ 25% State avg: 4m per day · National avg: 4m per day
Weekend RN Info Registered nurse hours specifically on weekends. Facilities sometimes reduce RN presence on Saturdays and Sundays — a low weekend RN figure compared to weekday hours can indicate reduced clinical oversight when most administrative staff are absent. 24m per day ▼ 23% State avg: 31m per day · National avg: 29m per day

Capacity and availability

This home usually has availability

Lower occupancy than the Kentucky average: 81.3%
Occupancy rate
71.5% Rank #170 / 202Occupancy rate — State benchmarkedThis home is ranked 170th out of 202 homes in Kentucky for occupancy rate. Shows this facility's occupancy rate versus the Kentucky average, with its Statewide rank out of 202. Higher occupancy signals strong local demand and financial stability.Click the rank badge to see the full State ranking.Click here to see the full State ranking.
Avg. Length of Stay
163 days
Walk Score
Walk Score: 83 / 100 Rank #7 / 423Walk Score — State benchmarkedThis home is ranked 7th out of 423 homes in Kentucky for walk score. Shows how walkable this facility's neighborhood is compared to the average Walk Score across Kentucky SNFs. Higher scores benefit residents, families, and staff.Click the rank badge to see the full State ranking.Click here to see the full State ranking.
Very walkable. Most errands can be accomplished on foot, and many essentials are within a short walk.

Contact Christian Health Center of Louisville

Staffing Data

Reporting period: October 1 – December 31, 2025 (Q4 2025). Source: CMS Payroll-Based Journal report.

Total staff 245
Employees 137
Contractors 108
Staff to resident ratio 2.36 : 1
37% more staff per resident than Kentucky average
Kentucky average ratio: 1.72 : 1 Kentucky average ratio: 1.72 : 1See full Kentucky ranking
Avg staff/day 59
Average shift 8 hours
6% worse than Kentucky average
Kentucky average: 8.5 hours Kentucky average shift: 8.5 hoursSee full Kentucky ranking
Total staff hours (quarter) 43,361

Nursing staff breakdown

Q4 2025 · Oct 1 – Dec 31 More info This data comes from the CMS Payroll-Based Journal report covering October 1 – December 31, 2025.
Registered Nurse

Manages medical care and health needs.

RN Staff Info 7 total: 6 full-time employees and 1 contractor. 7
Average shift length Info Average shift length. Calculated as total hours divided by days worked and average staff per day. 9.4 hours
Licensed Practical Nurse

Assists with medical care and medications.

LPN Staff Info 67 total: 23 full-time employees and 44 contractors. 67
Average shift length Info Average shift length. Calculated as total hours divided by days worked and average staff per day. 9.4 hours
Certified Nursing Assistant

Helps with daily care and mobility.

CNA Staff Info 124 total: 61 full-time employees and 63 contractors. 124
Average shift length Info Average shift length. Calculated as total hours divided by days worked and average staff per day. 7.6 hours

Contractor staffing

Q4 2025 · Oct 1 – Dec 31 More info This data comes from the CMS Payroll-Based Journal report covering October 1 – December 31, 2025.

Total hours from contractors

5.7%

2,462 contractor hours this quarter

Certified Nursing Assistant: 63 Licensed Practical Nurse: 44 Registered Nurse: 1

Staff by category

Q4 2025 · Oct 1 – Dec 31 More info This data comes from the CMS Payroll-Based Journal report covering October 1 – December 31, 2025.
Certified Nursing Assistant616312419,73692100%7.6
Licensed Practical Nurse2344677,59592100%9.4
Physical Therapist110112,84992100%7.6
RN Director of Nursing7072,57592100%8.5
Registered Nurse6172,42592100%9.4
Medication Aide/Technician7071,8039199%8.5
Clinical Nurse Specialist6061,2057076%8.2
Physical Therapy Aide3038996773%6.9
Other Dietary Services Staff2027338997%6.3
Dietitian1015125964%8.7
Mental Health Service Worker1014886166%8
Respiratory Therapy Technician2024816571%7.1
Speech Language Pathologist1014756267%7.7
Administrator2024165155%8
Nurse Practitioner1014165257%8
Physical Therapy Assistant1014055964%6.9
Qualified Social Worker2023506166%5.7
124 Certified Nursing Assistant
% of Days 100%
67 Licensed Practical Nurse
% of Days 100%
11 Physical Therapist
% of Days 100%
7 RN Director of Nursing
% of Days 100%
7 Registered Nurse
% of Days 100%
7 Medication Aide/Technician
% of Days 99%
6 Clinical Nurse Specialist
% of Days 76%
3 Physical Therapy Aide
% of Days 73%
2 Other Dietary Services Staff
% of Days 97%
1 Dietitian
% of Days 64%
1 Mental Health Service Worker
% of Days 66%
2 Respiratory Therapy Technician
% of Days 71%
1 Speech Language Pathologist
% of Days 67%
2 Administrator
% of Days 55%
1 Nurse Practitioner
% of Days 57%
1 Physical Therapy Assistant
% of Days 64%
2 Qualified Social Worker
% of Days 66%

Penalties and fines

Federal penalties imposed by CMS for regulatory violations, including civil money penalties (fines) and denials of payment for new Medicare/Medicaid admissions.

Source: CMS Penalties Database

No penalties in the past 3 years

No civil money penalties or payment denials were reported in the last 3 years.

Quality of care over time

These measures show how residents usually do over time at this home, based on health outcomes and preventive care.

High-risk clinical events score Info A composite score based on pressure ulcers, falls with injury, weight loss, walking ability decline, and activities of daily living decline. 8.0
24% better than Kentucky average

Kentucky average: 10.5

Functional decline score Info A composite score based on activities of daily living decline, walking ability decline, and incontinence. 14.2
25% better than Kentucky average

Kentucky average: 18.9

Long-stay resident measures
Above average Kentucky avg: 3.5 Info CMS star rating based on long-stay quality measure performance. 5 stars = significantly above average, 1 star = significantly below average.
Need for Help with Daily Activities Increased Info Percent of long-stay residents whose need for help with daily activities has increased 9.3%
45% better than Kentucky average

Kentucky average: 16.8%

Walking Ability Worsened Info Percent of long-stay residents whose ability to move independently worsened 15.5%
21% better than Kentucky average

Kentucky average: 19.6%

Low Risk Residents with Bowel/Bladder Incontinence Info Percent of low risk long-stay residents who lose control of their bowels or bladder 17.8%
13% better than Kentucky average

Kentucky average: 20.5%

Falls with Major Injury Info Percent of long-stay residents experiencing one or more falls with major injury 3.6%
In line with Kentucky average

Kentucky average: 3.8%

High Risk Residents with Pressure Ulcers Info Percent of long-stay high risk residents with pressure ulcers 3.5%
39% better than Kentucky average

Kentucky average: 5.8%

Urinary Tract Infection Info Percent of long-stay residents with a urinary tract infection 1.6%
17% better than Kentucky average

Kentucky average: 1.9%

Lost Too Much Weight Info Percent of long-stay residents who lose too much weight 8.2%
21% worse than Kentucky average

Kentucky average: 6.8%

Depressive Symptoms Info Percent of long-stay residents who have depressive symptoms 0.3%
98% better than Kentucky average

Kentucky average: 14.3%

Antipsychotic Use Info Percent of long-stay residents who received an antipsychotic medication 13.0%
17% better than Kentucky average

Kentucky average: 15.6%

Pneumococcal Vaccine Info Percent of long-stay residents assessed and appropriately given the pneumococcal vaccine 97.9%
In line with Kentucky average

Kentucky average: 93.9%

Influenza Vaccine Info Percent of long-stay residents assessed and appropriately given the seasonal influenza vaccine 95.7%
In line with Kentucky average

Kentucky average: 96.2%

Hospitalizations per 1,000 days Info Number of hospitalizations per 1,000 long-stay resident days. 1.85
In line with Kentucky average

Kentucky average: 1.87

ED visits per 1,000 days Info Number of outpatient emergency department visits per 1,000 long-stay resident days. 1.36
38% better than Kentucky average

Kentucky average: 2.19

Short-stay resident measures
Below average Kentucky avg: 2.2 Info CMS star rating based on short-stay quality measure performance. 5 stars = much above average, 1 star = much below average.
Pneumococcal Vaccine Info Percent of short-stay residents assessed and appropriately given the pneumococcal vaccine 67.7%
19% worse than Kentucky average

Kentucky average: 83.7%

Antipsychotic medication increase Info Percent of short-stay residents who newly received an antipsychotic medication 3.1%
61% worse than Kentucky average

Kentucky average: 1.9%

Influenza Vaccine Info Percent of short-stay residents assessed and appropriately given the seasonal influenza vaccine 73.7%
12% worse than Kentucky average

Kentucky average: 83.6%

Re-hospitalized after SNF stay Info Percentage of short-stay residents who were re-hospitalized after their nursing home admission. 23.6%
In line with Kentucky average

Kentucky average: 24.5%

Emergency department visits Info Percentage of short-stay residents who had an outpatient emergency department visit. 13.3%
In line with Kentucky average

Kentucky average: 13.9%

Falls with major injury Info Percentage of SNF residents who experience falls with major injury during their stay. 0.0%
100% better than Kentucky average

Kentucky average: 0.8%

Ability to care for self at discharge Info Percentage of residents at or above expected ability to care for themselves at discharge. 48.4%
10% worse than Kentucky average

Kentucky average: 53.7%

Successful return to home or community Info Rate of successful return to home or community from a skilled nursing facility. 61.6%
22% better than Kentucky average

Kentucky average: 50.6%

Breakdown by payment type

Medicare

19% of new residents, usually for short-term rehab.

Typical stay 1 - 2 months

Private pay

72% of new residents, often for short stays.

Typical stay 1 months

Medicaid

8% of new residents, often for long-term daily care.

Typical stay 4 - 5 years

Facility Characteristics

Source: CMS Long-Term Care Facility Characteristics (Data as of Jan 2026)

Total residents 104
Medicare
7
6.7% of residents
Medicaid
86
82.7% of residents
Private pay or other
11
10.6% of residents
Programs & Services
Residents Group

Residents meet regularly to discuss policies, care quality, and activities

Active Resident Council

Organized group of residents that meets regularly to discuss facility policies, quality of life, and activities.

Finances and operations

Voluntary non-profit community
Home revenue
$12.9M
Operating deficit
-$3.1M
Voluntary non-profit community
Home revenue
$12.9M Rank #57 / 188Revenue — State benchmarkedThis home is ranked 57th out of 188 homes in Kentucky for revenue. Shows this facility's annual revenue compared to the Kentucky SNF average. Higher revenue generally means more resources for staffing and capital — read alongside Payroll %.Click the rank badge to see the full State ranking.Click here to see the full State ranking.
Operating deficit
-$3.1M
Payroll costs Info The portion of the home's budget spent on staff, including nurses, caregivers, and other employees who support care and operations. Rank #24 / 188Payroll — State benchmarkedThis home is ranked 24th out of 188 homes in Kentucky for payroll. Shows total annual staff payroll benchmarked to the Kentucky average. Higher payroll investment relative to peers often signals better staffing and less reliance on cheaper contract labor.Click the rank badge to see the full State ranking.Click here to see the full State ranking.
$8.2M
63.5% of revenue Rank #12 / 188Payroll % — State benchmarkedThis home is ranked 12th out of 188 homes in Kentucky for payroll %. Shows payroll as a percentage of revenue versus the Kentucky average. Well-run Kentucky SNFs typically land around 51–61% — the top third Statewide. Below 25% may signal understaffing or heavy agency use — read with Staffing ratings.Click the rank badge to see the full State ranking.Click here to see the full State ranking.
Other operating costs Info All remaining costs needed to run the home, such as food, utilities, building maintenance, supplies and administrative expenses.
$7.8M
Total costs $16.0M

Who this home usually serves

TYPE OF STAY

Primarily short stays

Residents typically stay for brief periods, with frequent admissions and discharges throughout the year.

Places of interest near Christian Health Center of Louisville

Address 0.5 miles from city center Info Estimated distance in miles from Louisville's city center to Christian Health Center of Louisville's address, calculated via Google Maps. — 0.61 miles to nearest hospital (Norton Healthcare, Inc.)

Calculate Travel Distance to Christian Health Center of Louisville

Add your location

Address

Financial Assistance for
Nursing Home in Kentucky

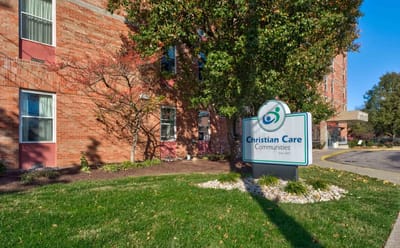
Christian Health Center of Louisville is located in Louisville, Kentucky.
Here are the financial assistance programs available to residents in Kentucky.

Get Financial aid guidance

Home and Community Based Waiver

Kentucky Medicaid HCB Waiver

Age 65+ or disabled
General Kentucky resident, Medicaid-eligible, nursing home-level care need.
Income Limits (2025) ~$2,829/month 300% FBR, individual
Asset Limits $2,000 (individual), $3,000 (couple).
KY

Rural focus; waitlists possible.

Benefits
Personal care (5-7 hours/day) Respite (240 hours/year) Homemaker services Home modifications

Hart-Supported Living Program

KY Hart-Supported Living

Age 65+ or disabled
General Kentucky resident.
Income Limits No strict limit; prioritizes low-income.
Asset Limits Not applicable.
KY

Competitive grants; limited availability.

Benefits
In-home support (up to 10 hours/week) Respite (varies) Adaptive equipment (~$500 avg.)

Kentucky Homecare Program

Kentucky Homecare Program

Age 60+
General Kentucky resident, at risk of nursing home placement, not eligible for Medicaid waivers.
Income Limits (2025) No strict limit; prioritizes low-income ~$24,980/year individual
Asset Limits Not assessed; need-based focus.
KY

15 AAAs; rural focus; not in nursing homes.

Benefits
Personal care (4-6 hours/day) Respite (5 days/year) Chore services Meal delivery ($7/meal) Minor home repairs

Medicare Savings Program (MSP)

Kentucky Medicare Savings Program

Age 65+ or disabled
General Kentucky resident, Medicare Part A/B.
Income Limits (2025) ~$2,510/month (QMB), ~$3,380/month (SLMB), ~$3,598/month (QI)—individual.
Asset Limits $9,430 (individual), $14,130 (couple).
KY

Three tiers; no waitlist; auto Extra Help for Part D.

Benefits
Covers Part B premiums ($174.70/month) Deductibles ($240/year) Copays (~20%)

National Family Caregiver Support Program (NFCSP) Respite

Kentucky NFCSP Respite Care

Age
General Caregivers of 60+ needing care or 55+ caregivers of others; Kentucky resident; functional needs (2+ ADLs).
Income Limits (2025) Prioritizes ~$24,980/year (individual); no strict cap.
Asset Limits Not assessed; need-based.
KY

15 AAAs; prioritizes low-income, rural caregivers.

Benefits
Respite (4-6 hours/week or 5 days/year) Adult day care ($55/day) Caregiver training Supplies (~$500/year)

Kentucky Family Caregiver Program

Kentucky Family Caregiver Program

Age
General Grandparents (often 55+) as primary caregivers to grandchildren under 18, Kentucky resident, not on Kinship Care.
Income Limits (2025) ~$31,225/year (individual); varies by AAA.
Asset Limits Not strictly assessed; need-based.
KY

Max $1,500/year; statewide via AAAs.

Benefits
Grants (~$500-$1,500/year) for respite Supplies Care costs; counseling Training

VA Aid and Attendance (A&A) and Housebound Benefits

Kentucky VA Aid and Attendance/Housebound

Age 65+ or disabled veteran/spouse
General Kentucky resident, wartime service, need for ADL help (A&A) or homebound.
Income Limits (2025) Net income < ~$1,984/month (veteran with dependent, A&A); pension offsets income.
Asset Limits ~$155,356 net worth limit
KY

High veteran demand in rural areas.

Benefits
Cash (~$1,433-$2,642/month veteran, ~$951-$1,318 spouse) for care costs (e.g., in-home, assisted living)

Compare Nursing Home around Louisville

The information below is reported by the Kentucky Cabinet for Health and Family Services, Office of Inspector General.

5 facilities compared · CMS & KY Dept. of Health data

Filter by care type
Vitality Living Springdale
NH

Nursing Home Licensed facility providing 24/7 skilled nursing care for residents with complex, ongoing medical needs. Staffed by RNs, LPNs, and CNAs. Inspected and star-rated annually by CMS. Accepts Medicare (short-term rehab) and Medicaid (long-term care).

AL

Assisted Living A licensed, long-term care setting for seniors or individuals with disabilities who need help with daily activities — like bathing, dressing, and medication management — but not 24-hour skilled nursing. Offers housing, meals, and around-the-clock support while aiming to maximize resident independence.

IL

Independent Living Lifestyle-focused communities for older adults offering dining, activities, and transportation with minimal personal care. Best for active, independent seniors who want community without medical support.

MC

Memory Care Secured, specialized care for people living with Alzheimer's or dementia. Staff trained in cognitive impairment, with higher staff-to-resident ratios and an environment designed to reduce confusion and wandering risk.

Louisville
90
Facility 90
KY AVG 83
Rank #135 / 341
--7.65 +8%+104%$021.0-47A+
25
Facility 25
KY AVG 41
Rank #315 / 423
Catherine Mueller$10.0M$6.5M65.2%185276
Nazareth Home Clifton
NH

Nursing Home Licensed facility providing 24/7 skilled nursing care for residents with complex, ongoing medical needs. Staffed by RNs, LPNs, and CNAs. Inspected and star-rated annually by CMS. Accepts Medicare (short-term rehab) and Medicaid (long-term care).

AL

Assisted Living A licensed, long-term care setting for seniors or individuals with disabilities who need help with daily activities — like bathing, dressing, and medication management — but not 24-hour skilled nursing. Offers housing, meals, and around-the-clock support while aiming to maximize resident independence.

Louisville (Clifton Heights)
144
Facility 144
KY AVG 83
Rank #25 / 341
--4.23 +1%+13%$0175.7-105A+
36
Facility 36
KY AVG 41
Rank #244 / 423
Greg Cobb$17.0M$8.0M47%185442
Brookdale Stonestreet
NH

Nursing Home Licensed facility providing 24/7 skilled nursing care for residents with complex, ongoing medical needs. Staffed by RNs, LPNs, and CNAs. Inspected and star-rated annually by CMS. Accepts Medicare (short-term rehab) and Medicaid (long-term care).

AL

Assisted Living A licensed, long-term care setting for seniors or individuals with disabilities who need help with daily activities — like bathing, dressing, and medication management — but not 24-hour skilled nursing. Offers housing, meals, and around-the-clock support while aiming to maximize resident independence.

Louisville (Prairie Village)
60
Facility 60
KY AVG 83
Rank #223 / 341
--3.24 +4%-14%$063.0-80A+
7
Facility 7
KY AVG 41
Rank #382 / 423
John Foote$14.0M$6.6M47%185462
The Willows at Springhurst
NH

Nursing Home Licensed facility providing 24/7 skilled nursing care for residents with complex, ongoing medical needs. Staffed by RNs, LPNs, and CNAs. Inspected and star-rated annually by CMS. Accepts Medicare (short-term rehab) and Medicaid (long-term care).

AL

Assisted Living A licensed, long-term care setting for seniors or individuals with disabilities who need help with daily activities — like bathing, dressing, and medication management — but not 24-hour skilled nursing. Offers housing, meals, and around-the-clock support while aiming to maximize resident independence.

Louisville
62
Facility 62
KY AVG 83
Rank #218 / 341
83.7% +3%3.32 -24%-12%$0175.7-49A+
34
Facility 34
KY AVG 41
Rank #261 / 423
Carla Sieckert$14.5M$8.3M57%185305
Christian Health Center of Louisville
NH

Nursing Home Licensed facility providing 24/7 skilled nursing care for residents with complex, ongoing medical needs. Staffed by RNs, LPNs, and CNAs. Inspected and star-rated annually by CMS. Accepts Medicare (short-term rehab) and Medicaid (long-term care).

AL

Assisted Living A licensed, long-term care setting for seniors or individuals with disabilities who need help with daily activities — like bathing, dressing, and medication management — but not 24-hour skilled nursing. Offers housing, meals, and around-the-clock support while aiming to maximize resident independence.

Louisville (Old Louisville)
122
Facility 122
KY AVG 83
Rank #47 / 341
--3.45 -73%-8%$0163.2-104-
83
Facility 83
KY AVG 41
Rank #7 / 423
-$12.9M$8.2M63.5%185029

Frequently Asked Questions about Christian Health Center of Louisville

What neighborhood is Christian Health Center of Louisville in?

Christian Health Center of Louisville is in the Old Louisville neighborhood.

Is Christian Health Center of Louisville in a walkable area?

Christian Health Center of Louisville has a walk score of 83. Very walkable. Most errands can be accomplished on foot, and many essentials are within a short walk.

Are there photos of Christian Health Center of Louisville?

Yes — there are 7 photos of Christian Health Center of Louisville in the photo gallery on this page.

What is the phone number of Christian Health Center of Louisville?

(502) 778-0001 will put you in contact with the team at Christian Health Center of Louisville.

Is Christian Health Center of Louisville Medicare or Medicaid certified?

Yes — Christian Health Center of Louisville is a CMS-certified provider of Medicare and Medicaid.

Guides for Better Senior Living

Care Cost Calculator: See Prices in Your Area

Nursing Home Data Explorer

Don’t Wait Too Long: 7 Red Flag Signs Your Parent Needs Assisted Living Now

The True Cost of Assisted Living in 2025 – And How Families Are Paying For It

Understanding Senior Living Costs: Pricing Models, Discounts & Financial Assistance

Explore Open Rooms
1 Contact details
2 What type of senior care service are you looking for?
3 What budget do you have in mind for senior care?
4 How soon do you need to find care?
5 Additional details

Thank you for your interest!

Our team will be in touch shortly to help with next steps.