


Total health inspections
1
Kentucky average 2.9
Last Health inspection on Feb 2020
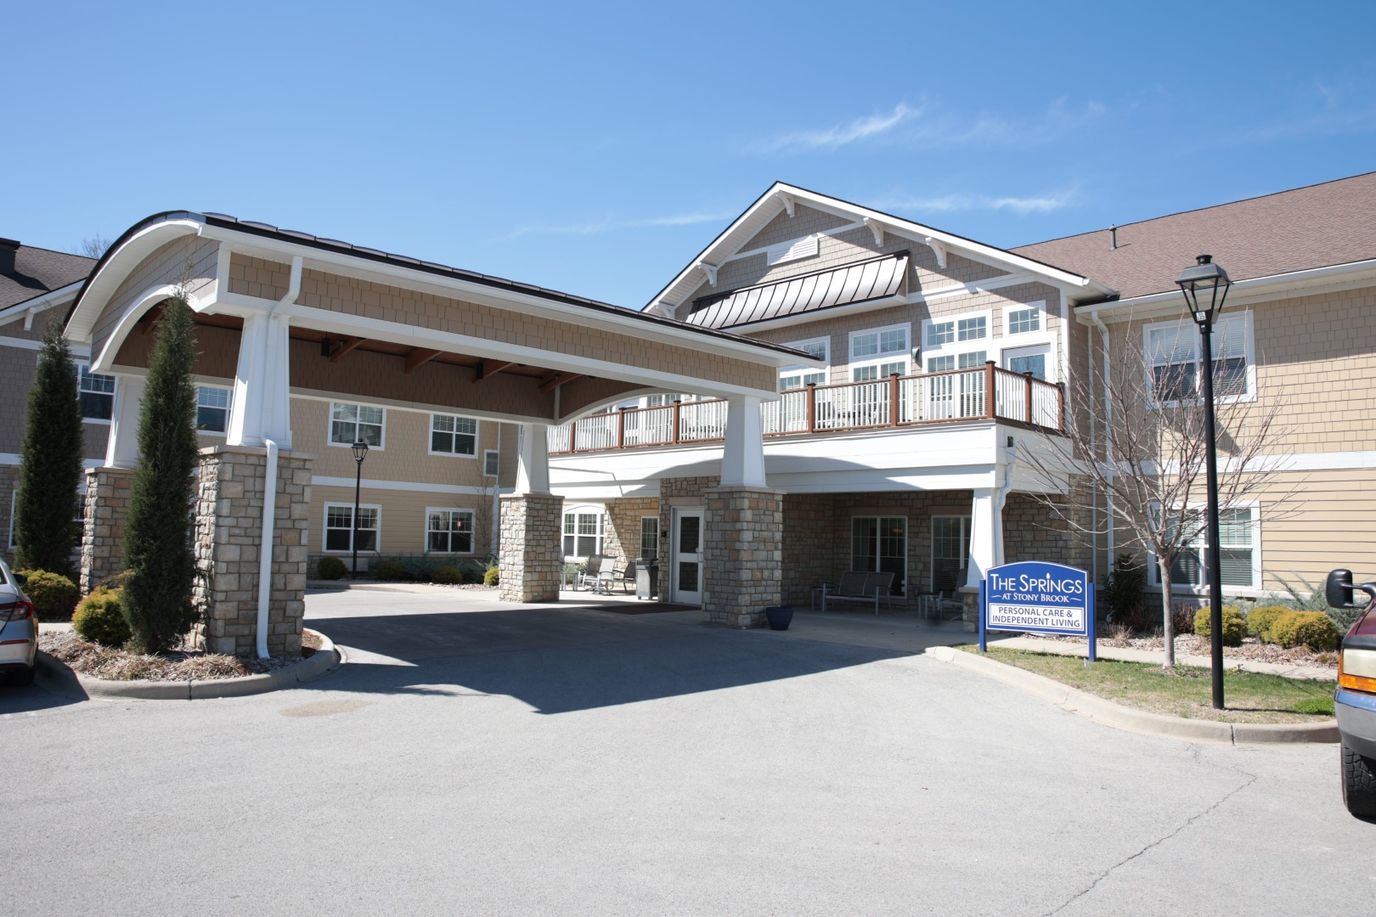
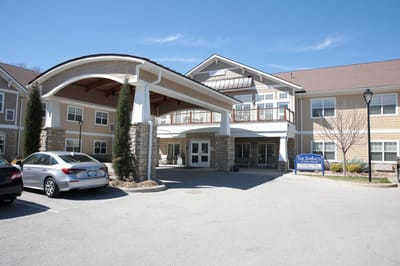
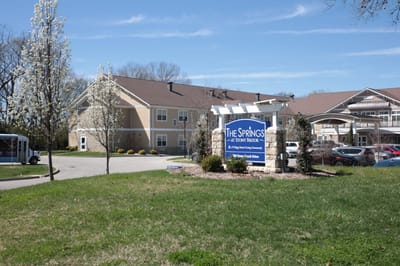
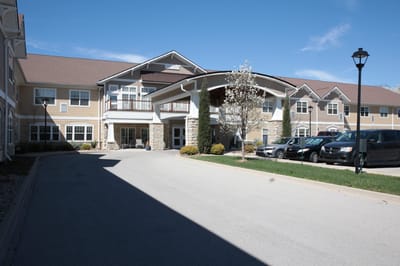
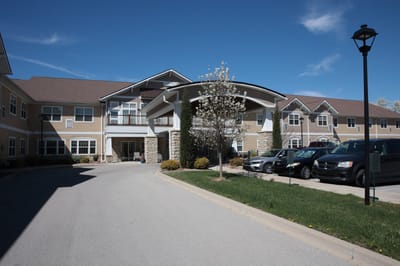
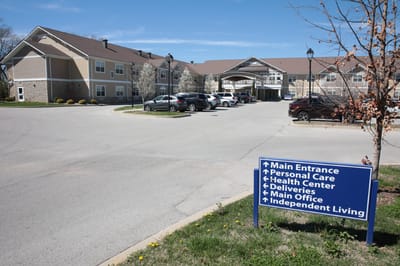
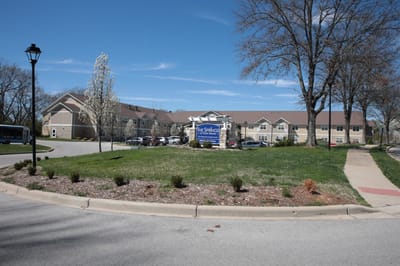
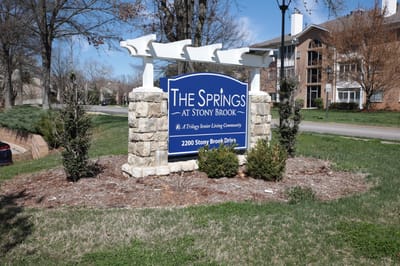
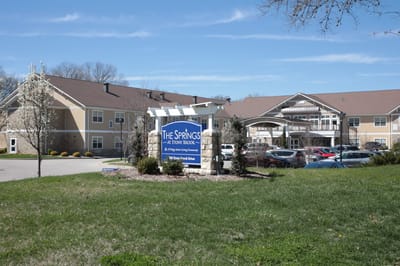

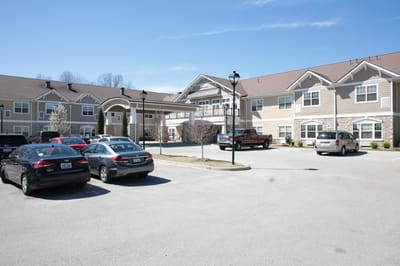
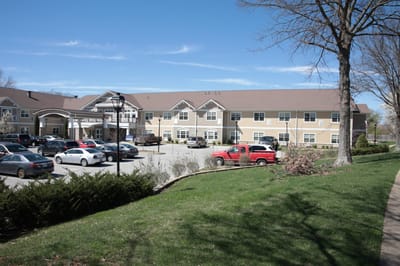
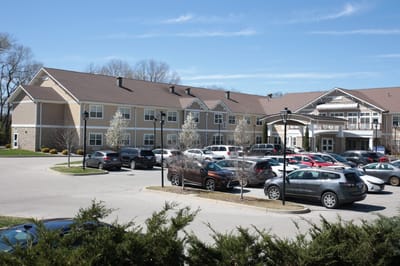
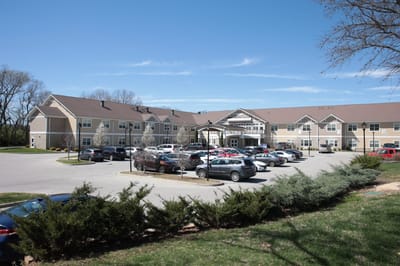
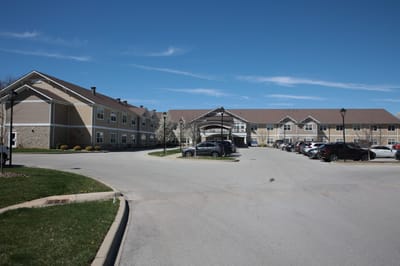
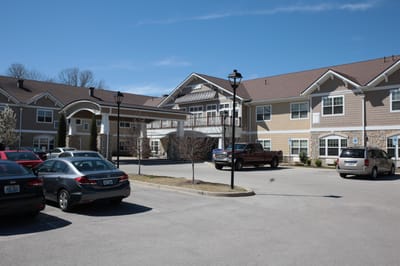
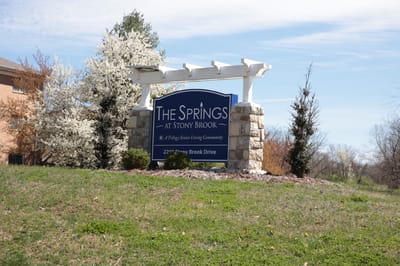
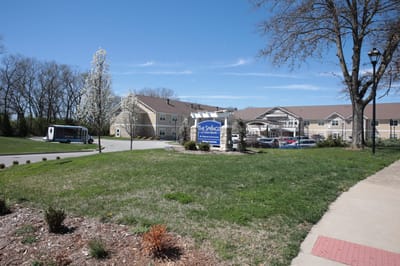
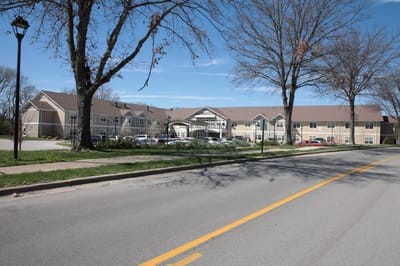
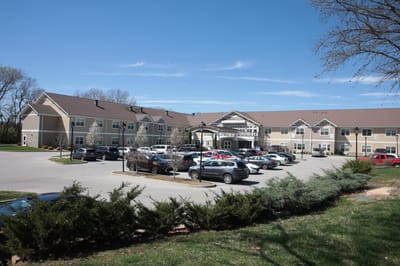
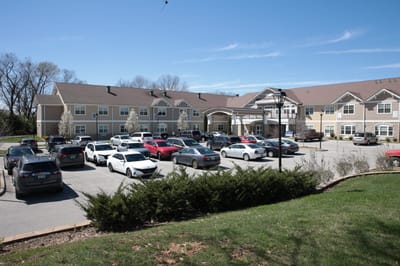
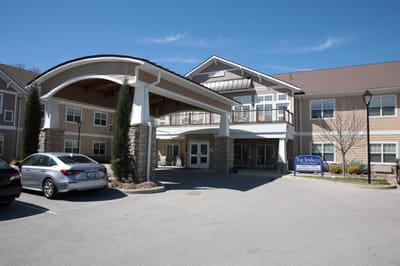
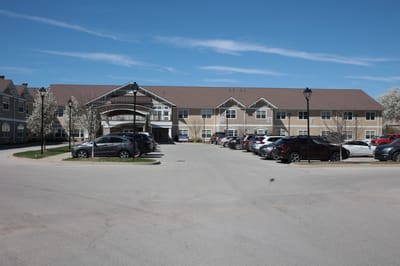
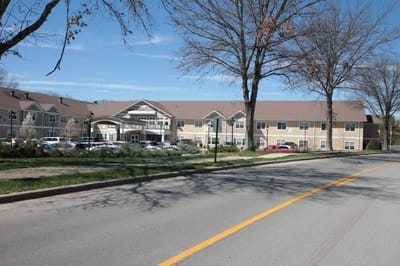
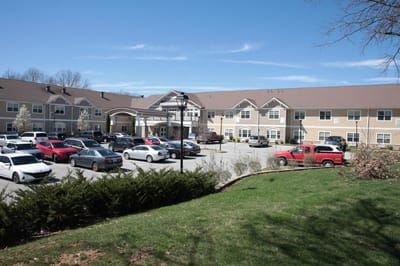

Find the care you need at The Springs at Stony Brook, a distinct community in Louisville, KY, offering independent living, assisted living, and memory care. Residents receive top-tier care for their unique needs around the clock from a compassionate and highly trained team. There’s no need to worry about household chores and daily activities, with the community helping with housekeeping and laundry.
Residents can meet new friends and gain meaningful experiences with a well-thought-out calendar of fun recreational activities and enriching programs. Mealtimes foster comfort and satisfy dietary needs with delicious and well-balanced dining options in a restaurant-style setting. The community is ideal for those looking to age in one place, especially with its different levels of care and exceptional services.
| Staff type | Hours / Day / Resident | vs state avg |
|---|---|---|
|
Registered Nurse (RN)
| 53m per day | ▲ 16% State avg: 46m per day · National avg: 41m per day |
|
LPN / LVN
| 55m per day | ▲ 13% State avg: 49m per day · National avg: 52m per day |
|
Nurse Aide
| 2h 7m per day | ▼ 13% State avg: 2h 26m per day · National avg: 2h 20m per day |
|
Weekend Total Nursing
| 3h 38m per day | ▲ 4% State avg: 3h 30m per day · National avg: 3h 26m per day |
|
Physical Therapist
| 4m per day | ▼ 11% State avg: 4m per day · National avg: 4m per day |
|
Weekend RN
| 38m per day | ▲ 21% State avg: 31m per day · National avg: 28m per day |
The Springs at Stony Brook is legally operated by Hurstbourne Healthcare, LLC, and administered by Syndey.
Key information about the people who lead and staff this community.
In Kentucky, the Cabinet for Health and Family Services, Office of Inspector General is the regulatory authority that conducts inspections and investigates complaints in all long-term care homes.
Deficiencies
| This Facility | KY Average | vs. KY Avg |
|---|---|---|---|
|
Total deficiencies
| 3 | 6 | This facility has 50% fewer total deficiencies than a typical Kentucky nursing home (3 vs. KY avg 6).↓ 50% better |
|
Deficiencies per inspection
| 1 | 1.5 | This facility has 33% fewer deficiencies per inspection than a typical Kentucky nursing home (1 vs. KY avg 1.5).↓ 33% better |
Inspections
| This Facility | KY Average | vs. KY Avg |
|---|---|---|---|
|
Total inspections
| 3 | 4 | This facility has had 25% fewer total inspections than the Kentucky average (3 vs. KY avg 4). More inspections can mean more regulatory scrutiny rather than worse care.↓ 25% fewer |
Kentucky average 2.9
Last Health inspection on Feb 2020
Kentucky average 13.5
Kentucky average 4.4
Health citations are formal notices following inspections when they fail to comply with safety and care standards.
All 3 citations resulted from standard inspections.
Kentucky average: 1.1
Kentucky average: 0.6
Reporting period: October 1 – December 31, 2025 (Q4 2025). Source: CMS Payroll-Based Journal report.
Manages medical care and health needs.
Assists with medical care and medications.
Helps with daily care and mobility.
Total hours from contractors
2,569 contractor hours this quarter
| Certified Nursing Assistant | 35 | 0 | 35 | 9,556 | 92 | 100% | 8.7 |
| Licensed Practical Nurse | 20 | 0 | 20 | 5,200 | 92 | 100% | 9.7 |
| Registered Nurse | 10 | 0 | 10 | 3,624 | 92 | 100% | 10.4 |
| Medication Aide/Technician | 12 | 0 | 12 | 3,239 | 92 | 100% | 8.6 |
| Other Dietary Services Staff | 11 | 0 | 11 | 2,223 | 88 | 96% | 6.5 |
| Clinical Nurse Specialist | 7 | 0 | 7 | 1,293 | 75 | 82% | 7.9 |
| Physical Therapy Aide | 0 | 4 | 4 | 830 | 67 | 73% | 6.7 |
| Speech Language Pathologist | 0 | 2 | 2 | 558 | 68 | 74% | 5.8 |
| Qualified Social Worker | 0 | 3 | 3 | 485 | 70 | 76% | 6.5 |
| Nurse Practitioner | 1 | 0 | 1 | 480 | 60 | 65% | 8 |
| Administrator | 1 | 0 | 1 | 472 | 59 | 64% | 8 |
| Mental Health Service Worker | 2 | 0 | 2 | 471 | 60 | 65% | 7.9 |
| Dietitian | 2 | 0 | 2 | 462 | 56 | 61% | 7.9 |
| RN Director of Nursing | 1 | 0 | 1 | 409 | 42 | 46% | 9.7 |
| Respiratory Therapy Technician | 0 | 4 | 4 | 361 | 67 | 73% | 5.2 |
| Physical Therapy Assistant | 0 | 6 | 6 | 309 | 62 | 67% | 4.9 |
| Nurse Aide in Training | 1 | 0 | 1 | 74 | 7 | 8% | 10.6 |
| Occupational Therapy Assistant | 3 | 0 | 3 | 37 | 53 | 58% | 0.6 |
| Medical Director | 0 | 1 | 1 | 27 | 26 | 28% | 1 |
Federal penalties imposed by CMS for regulatory violations, including civil money penalties (fines) and denials of payment for new Medicare/Medicaid admissions.
Source: CMS Penalties Database
No penalties in the past 3 years
No civil money penalties or payment denials were reported in the last 3 years.
These measures show how residents usually do over time at this home, based on health outcomes and preventive care.
Kentucky average: 10.5
Kentucky average: 18.9
Kentucky average: 16.8%
Kentucky average: 19.6%
Kentucky average: 20.5%
Kentucky average: 3.8%
Kentucky average: 5.8%
Kentucky average: 1.9%
Kentucky average: 6.8%
Kentucky average: 14.3%
Kentucky average: 15.6%
Kentucky average: 93.9%
Kentucky average: 96.2%
Kentucky average: 1.87
Kentucky average: 2.19
Kentucky average: 83.7%
Kentucky average: 1.9%
Kentucky average: 83.6%
Kentucky average: 24.5%
Kentucky average: 13.9%
Kentucky average: 0.8%
Kentucky average: 53.7%
Kentucky average: 50.6%
Quality measures are calculated from Minimum Data Set (MDS) assessments. For most measures, lower percentages indicate better care quality.
59% of new residents, usually for short-term rehab.
35% of new residents, often for short stays.
6% of new residents, often for long-term daily care.
Source: CMS Long-Term Care Facility Characteristics (Data as of Jan 2026)
Residents meet regularly to discuss policies, care quality, and activities
Organized group of residents that meets regularly to discuss facility policies, quality of life, and activities.
Data sourced from CMS Long-Term Care Facility Characteristics quarterly report. Payer mix reflects the current resident census by primary payment source.
Historical financial and operational data for The Springs at Stony Brook from 2020–2023, based on CMS SNF Cost Reports.
Key figures below are for fiscal year ending in 12/2023.
Based on CMS SNF Cost Report for fiscal year ending in 12/2023.
No pets allowed
Housing Options: Studio / 1 Bed / 2 Bed
Building Type: 2-story
Beauty Services
Transportation Services
Housekeeping Services
Social and Recreational Activities
Exercise Programs

On-site Medical Care and Health Services
Most residents typically stay for a few weeks or months before returning home or moving on.
Most new residents arrive under Medicare (59% of admissions), and a typical Medicare stay runs around 20 days.
Coverage residents most often arrive under.
Coverage residents most often leave under.
![]() 9.2 miles from city center
9.2 miles from city center
![]() Estimated distance in miles from Louisville's city center to The Springs at Stony Brook's address, calculated via Google Maps.
Estimated distance in miles from Louisville's city center to The Springs at Stony Brook's address, calculated via Google Maps.
Add your location
Info below is compiled from CMS reports & the KY Cabinet for Health & Family Services (CHFS), senior community websites & trusted data sources such as Walk Score & BBB.
Communities are listed from highest to lowest based on our ranking methodology.
| Westport Place Health Campus | NH AL RC SNF | Louisville | 22
Facility
22
KY AVG
82
Rank
#325 / 341 | - | - | 3.44
Facility
3.44
KY AVG
3.75
Rank
#74 / 189 | +46% | -8% | $0
Facility
$0
KY AVG
$65.4k
Rank
#1 / 195 | 5
Facility
5
KY AVG
13.5
Rank
#19 / 191 | 2.5
Facility
2.5
KY AVG
4.4
Rank
#30 / 191 | - | 55 | - |
47
Facility
47
KY AVG
41
Rank
#183 / 423 | Lauren Powers | $11.5MFiscal year ending 12/2023
Facility
$11.5MFiscal year ending 12/2023
KY AVG
$10.5M
Rank
#51 / 192 | $5.9MFiscal year ending 12/2023
Facility
$5.9MFiscal year ending 12/2023
KY AVG
$4.0M
Rank
#46 / 192 | 50.9%Fiscal year ending 12/2023
Facility
50.9%Fiscal year ending 12/2023
KY AVG
40.7%
Rank
#83 / 192 | 185466 | ||||
| Signature HealthCARE at Rockford Rehab & Wellness Center | NH PC RC SNF | Louisville | 110
Facility
110
KY AVG
82
Rank
#70 / 341 |
90.0%
Facility
90.0%
KY AVG
84.3
Rank
#72 / 168 | +7% | 3.29
Facility
3.29
KY AVG
3.75
Rank
#91 / 189 | +22% | -12% | $0
Facility
$0
KY AVG
$65.4k
Rank
#1 / 195 | 11
Facility
11
KY AVG
13.5
Rank
#87 / 191 | 3.7
Facility
3.7
KY AVG
4.4
Rank
#79 / 191 | 3 | 99 | - |
38
Facility
38
KY AVG
41
Rank
#231 / 423 | LP Louisville Quinn Drive, LLC | $10.2MFiscal year ending 12/2023
Facility
$10.2MFiscal year ending 12/2023
KY AVG
$10.5M
Rank
#74 / 192 | $4.3MFiscal year ending 12/2023
Facility
$4.3MFiscal year ending 12/2023
KY AVG
$4.0M
Rank
#79 / 192 | 42.5%Fiscal year ending 12/2023
Facility
42.5%Fiscal year ending 12/2023
KY AVG
40.7%
Rank
#111 / 192 | 185311 | ||||
| The Springs at Stony Brook | NH ADC AL IL MC SNF | Louisville | 106
Facility
106
KY AVG
82
Rank
#79 / 341 | - | - | 3.30
Facility
3.30
KY AVG
3.75
Rank
#91 / 189 | -27% | -12% | $0
Facility
$0
KY AVG
$65.4k
Rank
#1 / 195 | 3
Facility
3
KY AVG
13.5
Rank
#6 / 191 | 3.0
Facility
3.0
KY AVG
4.4
Rank
#47 / 191 | - | 66 | - |
28
Facility
28
KY AVG
41
Rank
#292 / 423 | Hurstbourne Healthcare, LLC | $11.1MFiscal year ending 12/2023
Facility
$11.1MFiscal year ending 12/2023
KY AVG
$10.5M
Rank
#71 / 192 | $6.4MFiscal year ending 12/2023
Facility
$6.4MFiscal year ending 12/2023
KY AVG
$4.0M
Rank
#44 / 192 | 57.2%Fiscal year ending 12/2023
Facility
57.2%Fiscal year ending 12/2023
KY AVG
40.7%
Rank
#45 / 192 | 185485 | ||||
| Nazareth Home Clifton | NH IL MC SNF | Louisville (Clifton Heights) | 144
Facility
144
KY AVG
82
Rank
#24 / 341 | - | - | 4.23
Facility
4.23
KY AVG
3.75
Rank
#24 / 189 | +1% | +13% | $0
Facility
$0
KY AVG
$65.4k
Rank
#1 / 195 | 17
Facility
17
KY AVG
13.5
Rank
#132 / 191 | 5.7
Facility
5.7
KY AVG
4.4
Rank
#144 / 191 | - | 105 | A+ |
36
Facility
36
KY AVG
41
Rank
#244 / 423 | Greg Cobb | $13.3MFiscal year ending 08/2024
Facility
$13.3MFiscal year ending 08/2024
KY AVG
$10.5M
Rank
#25 / 192 | $8.0MFiscal year ending 08/2024
Facility
$8.0MFiscal year ending 08/2024
KY AVG
$4.0M
Rank
#29 / 192 | 59.8%Fiscal year ending 08/2024
Facility
59.8%Fiscal year ending 08/2024
KY AVG
40.7%
Rank
#86 / 192 | 185442 | ||||
| Signature Healthcare at Jefferson Manor Rehab and We | NH SNF | Louisville | 100
Facility
100
KY AVG
82
Rank
#97 / 341 |
89.0%
Facility
89.0%
KY AVG
84.3
Rank
#83 / 168 | +6% | 3.60
Facility
3.60
KY AVG
3.75
Rank
#52 / 189 | +53% | -4% | $0
Facility
$0
KY AVG
$65.4k
Rank
#1 / 195 | 14
Facility
14
KY AVG
13.5
Rank
#110 / 191 | 4.7
Facility
4.7
KY AVG
4.4
Rank
#116 / 191 | - | 89 | - |
55
Facility
55
KY AVG
41
Rank
#126 / 423 | Robert Cooper | $9.1MFiscal year ending 12/2023
Facility
$9.1MFiscal year ending 12/2023
KY AVG
$10.5M
Rank
#83 / 192 | $3.6MFiscal year ending 12/2023
Facility
$3.6MFiscal year ending 12/2023
KY AVG
$4.0M
Rank
#107 / 192 | 39.2%Fiscal year ending 12/2023
Facility
39.2%Fiscal year ending 12/2023
KY AVG
40.7%
Rank
#143 / 192 | 185169 |
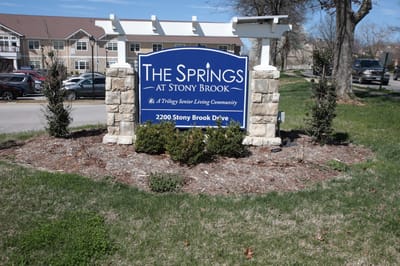
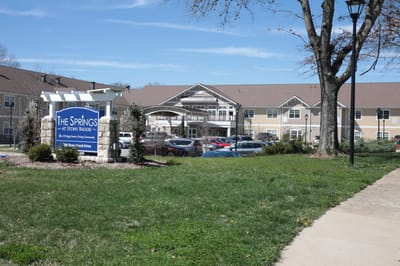
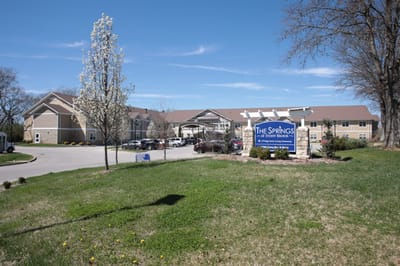
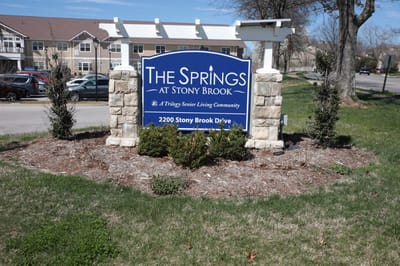
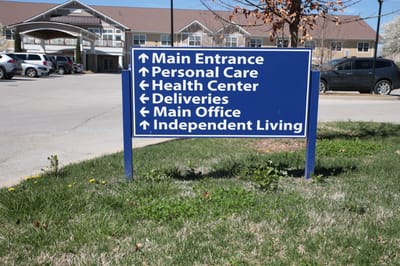
The Springs at Stony Brook is located in Louisville, Kentucky.
Here are the financial assistance programs available to residents in Kentucky.
The Springs at Stony Brook is legally operated by Hurstbourne Healthcare, LLC, and administered by Syndey.
The Springs at Stony Brook has a walk score of 28. Somewhat walkable. A few nearby services may be reachable on foot, but most trips require transportation.
According to KY state health department records, The Springs at Stony Brook's license number is 100645.
According to KY state health department records, The Springs at Stony Brook's license expires on October 31, 2026.
The Springs at Stony Brook's occupancy is 72.4%.
The Springs at Stony Brook has been operating for approximately 9 years, based on available licensing and registration records.
No, The Springs at Stony Brook has a no-pet policy.
Care Cost Calculator: See Prices in Your Area
Nursing Home Data Explorer
Don’t Wait Too Long: 7 Red Flag Signs Your Parent Needs Assisted Living Now
The True Cost of Assisted Living in 2025 – And How Families Are Paying For It
Understanding Senior Living Costs: Pricing Models, Discounts & Financial Assistance


