


Total health inspections
6
Massachusetts average 4.5
Last Health inspection on Feb 2025
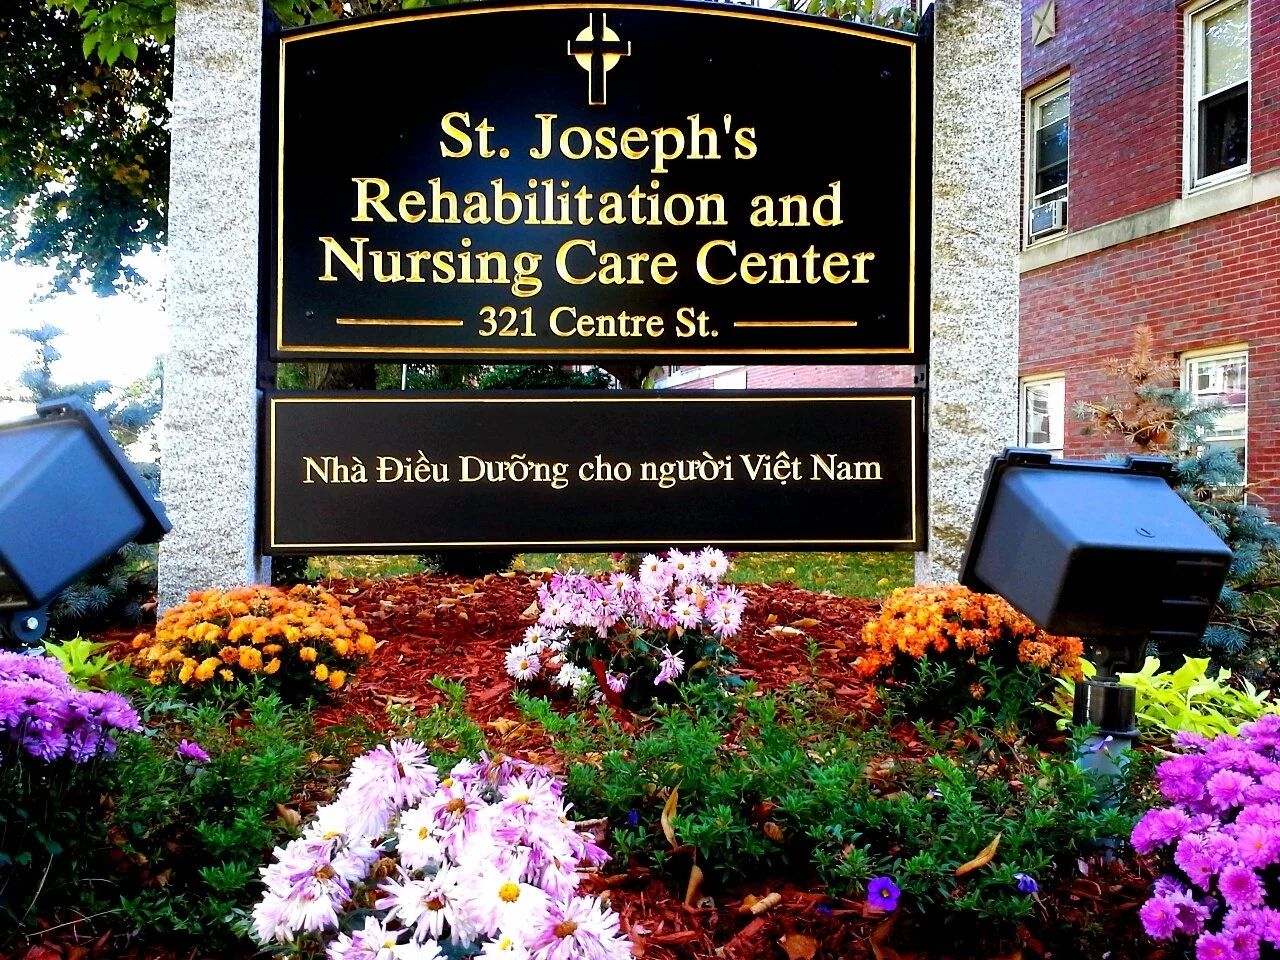


Housed at 321 Centre St in Dorchester’s heart, just half a mile from the neighborhood center, St. Joseph Rehabilitation and Nursing Center operates as a 123-bed skilled nursing facility under Landmark Health Solutions, LLC. The community holds Joint Commission accreditation and centers on short-term Medicare-covered rehabilitation for post-acute patients.
Between 2022 and early 2025, the facility documented 50 citations; averaging 10.8 annually, more than triple Massachusetts’ typical rate of 3.5 per year.
The February 2025 inspection cataloged 13 deficiencies across multiple care domains: staff failed to maintain resident dignity during meals, medication carts sat unlocked and unattended, prescribed physician orders went unimplemented, call bells malfunctioned, and infection control protocols broke down.
Two substantiated complaint investigations uncovered serious medication errors. In July 2024, overmedication with Eliquis required a resident to be hospitalized for blood transfusions. In February 2023, a resident went nine days without anticonvulsant medication, triggering seizures that led to emergency transfer.
The citation landscape includes six serious-level violations alongside 44 moderate deficiencies, with no critical citations recorded.
The facility incurred $138,000 in federal fines since 2024; nearly double the state average.
Staffing runs 3 hours 54 minutes of nursing care per resident daily, slightly below the 4-hour-18-minute state benchmark. The facility employs 145 staff: 26 nurses, 19 licensed practical nurses, and 60 aides.
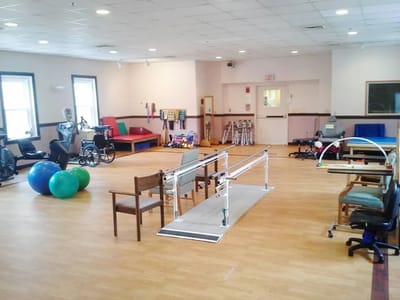
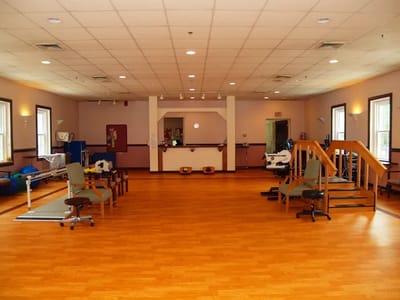
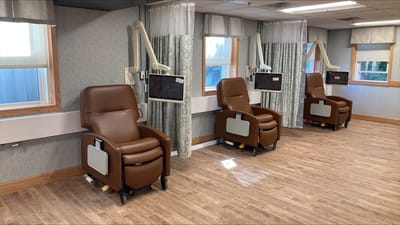
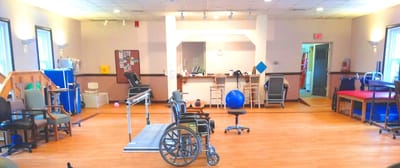
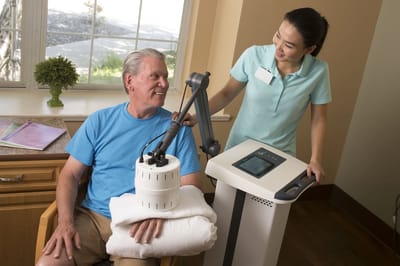
Physical therapy stands as a distinct strength at 8 minutes per resident per day, twice the state average. Post-acute rehabilitation outcomes are strong. Short-stay residents returning successfully to home or community reached 65.8%, exceeding the state average by 30%. Self-care ability at discharge sits at 62.3%, 16% above state norms.
Current occupancy of 31.7% ranks 90th among 92 Massachusetts nursing homes and runs 61% below state average, a steep decline from 92.6% occupancy in 2022. The 2023 operating loss reached $2.0 million, with a negative profit margin of 9.4%. The facility sits in a highly walkable Dorchester location accessible by foot to nearby services and hospitals.
The inspection record reveals persistent operational vulnerabilities, and the facility faces acute financial and occupancy pressure, positioning it for residents who can tolerate uncertainty.
| Staff type | Hours / Day / Resident | vs state avg |
|---|---|---|
|
Registered Nurse (RN)
| 53m per day | ▲ 35% State avg: 39m per day · National avg: 41m per day |
|
LPN / LVN
| 39m per day | ▼ 33% State avg: 58m per day · National avg: 52m per day |
|
Nurse Aide
| 2h 7m per day | ▼ 7% State avg: 2h 16m per day · National avg: 2h 21m per day |
|
Weekend Total Nursing
| 3h 7m per day | ▼ 9% State avg: 3h 27m per day · National avg: 3h 26m per day |
|
Physical Therapist
| 8m per day | ▲ 102% State avg: 4m per day · National avg: 4m per day |
|
Weekend RN
| 34m per day | ▲ 21% State avg: 28m per day · National avg: 29m per day |
Key information about the people who lead and staff this community.
In Massachusetts, the Executive Office of Elder Affairs (for assisted living facilities) and the Department of Public Health (for nursing homes) are the agencies authorized to inspect and report on facility safety.
Citations
| This Facility | MA Average | vs. MA Avg |
|---|---|---|---|
|
Total citations
| 43 | 14 | This facility has 207% more total citations than a typical Massachusetts nursing home (43 vs. MA avg 14).↑ 207% worse |
|
Citations per year
| 10.8 | 3.5 | This facility has 209% more citations per year than a typical Massachusetts nursing home (10.8 vs. MA avg 3.5).↑ 209% worse |
Massachusetts average 4.5
Last Health inspection on Feb 2025
Massachusetts average 32.7
Massachusetts average 7.24
Health citations are formal notices following inspections when they fail to comply with safety and care standards.
44 of 50 citations resulted from standard inspections; and 6 of 50 resulted from complaint investigations.
Massachusetts average: 0.3
Massachusetts average: 1.5
Reporting period: October 1 – December 31, 2025 (Q4 2025). Source: CMS Payroll-Based Journal report.
Manages medical care and health needs.
Assists with medical care and medications.
Helps with daily care and mobility.
Total hours from contractors
234 contractor hours this quarter
| Certified Nursing Assistant | 60 | 0 | 60 | 22,811 | 92 | 100% | 8.1 |
| Registered Nurse | 26 | 0 | 26 | 8,079 | 92 | 100% | 9.3 |
| Licensed Practical Nurse | 19 | 0 | 19 | 6,933 | 92 | 100% | 9.3 |
| Physical Therapy Assistant | 5 | 0 | 5 | 2,288 | 82 | 89% | 7.7 |
| Respiratory Therapy Technician | 4 | 0 | 4 | 1,455 | 70 | 76% | 7.9 |
| Other Dietary Services Staff | 6 | 0 | 6 | 1,348 | 92 | 100% | 6.6 |
| Qualified Social Worker | 2 | 0 | 2 | 934 | 71 | 77% | 8.1 |
| Clinical Nurse Specialist | 2 | 0 | 2 | 912 | 64 | 70% | 8 |
| Mental Health Service Worker | 2 | 2 | 4 | 854 | 63 | 68% | 7.9 |
| Nurse Practitioner | 1 | 0 | 1 | 504 | 63 | 68% | 8 |
| Speech Language Pathologist | 2 | 0 | 2 | 498 | 64 | 70% | 7.5 |
| Administrator | 1 | 0 | 1 | 484 | 61 | 66% | 7.9 |
| Dietitian | 1 | 0 | 1 | 472 | 59 | 64% | 8 |
| Physical Therapy Aide | 1 | 0 | 1 | 445 | 58 | 63% | 7.7 |
| Occupational Therapy Aide | 2 | 0 | 2 | 369 | 47 | 51% | 7.8 |
| Other Physician | 0 | 4 | 4 | 114 | 20 | 22% | 3.8 |
| Occupational Therapy Assistant | 0 | 3 | 3 | 53 | 44 | 48% | 1.1 |
| Medical Director | 0 | 1 | 1 | 39 | 12 | 13% | 3.3 |
| Qualified Activities Professional | 0 | 1 | 1 | 6 | 5 | 5% | 1.2 |
Includes penalties issued in 2024
Federal penalties imposed by CMS for regulatory violations, including civil money penalties (fines) and denials of payment for new Medicare/Medicaid admissions.
Source: CMS Penalties Database (Data as of Jan 2026)
Massachusetts average: $72K
Massachusetts average: 1.7
Massachusetts average: 0.1
Penalties are imposed by CMS for violations of federal nursing home regulations.
2 penalties in the past 3 years
Multiple penalties were reported in the last 3 years.
Last updated: Jan 2026
These measures show how residents usually do over time at this home, based on health outcomes and preventive care.
Massachusetts average: 10.2
Massachusetts average: 20.0
Massachusetts average: 18.7%
Massachusetts average: 19.3%
Massachusetts average: 22.1%
Massachusetts average: 3.6%
Massachusetts average: 4.7%
Massachusetts average: 2.1%
Massachusetts average: 5.2%
Massachusetts average: 10.7%
Massachusetts average: 20.3%
Massachusetts average: 91.9%
Massachusetts average: 94.8%
Massachusetts average: 1.86
Massachusetts average: 1.54
Massachusetts average: 76.7%
Massachusetts average: 1.3%
Massachusetts average: 77.7%
Massachusetts average: 25.8%
Massachusetts average: 11.8%
Massachusetts average: 0.8%
Massachusetts average: 53.7%
Massachusetts average: 50.6%
Quality measures are calculated from Minimum Data Set (MDS) assessments. For most measures, lower percentages indicate better care quality.
79% of new residents, usually for short-term rehab.
20% of new residents, often for short stays.
1% of new residents, often for long-term daily care.
Source: CMS Long-Term Care Facility Characteristics (Data as of Jan 2026)
Residents meet regularly to discuss policies, care quality, and activities
Family members meet regularly to discuss policies, care quality, and activities
Organized group of family members that meets regularly to discuss facility policies, resident care, and activities.
Organized group of residents that meets regularly to discuss facility policies, quality of life, and activities.
Data sourced from CMS Long-Term Care Facility Characteristics quarterly report. Payer mix reflects the current resident census by primary payment source.
Historical financial and operational data for St. Joseph Rehabilitation and Nursing Center from 2011–2023, based on CMS SNF Cost Reports.
Based on CMS SNF Cost Report for fiscal year ending in 12/2023.
Most residents typically stay for a few weeks or months before returning home or moving on.
Most new residents arrive under Medicare (79% of admissions), and a typical Medicare stay runs around 30 days.
Coverage residents most often arrive under.
Coverage residents most often leave under.

![]() 0.5 miles from city center
0.5 miles from city center
![]() Estimated distance in miles from Dorchester's city center to St. Joseph Rehabilitation and Nursing Center's address, calculated via Google Maps.
— 3.06 miles to nearest hospital (Beth Israel Deaconess Hospitalu2013Milton)
Estimated distance in miles from Dorchester's city center to St. Joseph Rehabilitation and Nursing Center's address, calculated via Google Maps.
— 3.06 miles to nearest hospital (Beth Israel Deaconess Hospitalu2013Milton)
Add your location
The information below is reported by the Massachusetts Executive Office of Elder Affairs and Department of Public Health.
| The Boston Home Inc | NH RC | Dorchester Center (Dorchester) | 96
Facility
96
MA AVG
94
Rank
#109 / 280 |
96.6%
Facility
96.6%
MA AVG
82%
Rank
#5 / 96 | +18% | 5.17
Facility
5.17
MA AVG
3.93
Rank
#7 / 93 | -18% | +32% | $0
Facility
$0
MA AVG
$76.6k
Rank
#1 / 94 | 8
Facility
8
MA AVG
32.7
Rank
#7 / 93 | 8.0
Facility
8.0
MA AVG
7.2
Rank
#64 / 93 | - | 93 | - |
76
Facility
76
MA AVG
53
Rank
#146 / 499 | Christine Reilly | $15.6M
Facility
$15.6M
MA AVG
$17.4M
Rank
#35 / 96 | $14.5M
Facility
$14.5M
MA AVG
$6.5M
Rank
#11 / 96 | 92.6%
Facility
92.6%
MA AVG
43.6%
Rank
#11 / 96 | 225434 | ||||
| Hebrew SeniorLife | NH AL HC IL MC PC | Boston (Roslindale) | 50
Facility
50
MA AVG
94
Rank
#235 / 280 | - | - | 4.65
Facility
4.65
MA AVG
3.93
Rank
#12 / 93 | +18% | +18% | $0
Facility
$0
MA AVG
$76.6k
Rank
#1 / 94 | 11
Facility
11
MA AVG
32.7
Rank
#9 / 93 | 3.7
Facility
3.7
MA AVG
7.2
Rank
#16 / 93 | - | 32 | - |
38
Facility
38
MA AVG
53
Rank
#324 / 499 | - | - | - | - | 225759 | ||||
| St. Joseph Rehabilitation and Nursing Center | NH HC MC NC | Dorchester | 123
Facility
123
MA AVG
94
Rank
#55 / 280 |
31.7%
Facility
31.7%
MA AVG
82%
Rank
#93 / 96 | -61% | 3.90
Facility
3.90
MA AVG
3.93
Rank
#43 / 93 | +40% | -1% | $82.6k
Facility
$82.6k
MA AVG
$76.6k
Rank
#84 / 94 | 50
Facility
50
MA AVG
32.7
Rank
#82 / 93 | 8.3
Facility
8.3
MA AVG
7.2
Rank
#65 / 93 | 6 | 39 | A+ |
83
Facility
83
MA AVG
53
Rank
#102 / 499 | Landmark Health Solutions, LLC | $15.5M
Facility
$15.5M
MA AVG
$17.4M
Rank
#46 / 96 | $9.9M
Facility
$9.9M
MA AVG
$6.5M
Rank
#50 / 96 | 63.6%
Facility
63.6%
MA AVG
43.6%
Rank
#56 / 96 | 225493 | ||||
| Sherrill House | NH HC MC PC | Boston (Jamaica Hills) | 196
Facility
196
MA AVG
94
Rank
#9 / 280 |
79.7%
Facility
79.7%
MA AVG
82%
Rank
#59 / 96 | -3% | 3.94
Facility
3.94
MA AVG
3.93
Rank
#43 / 93 | +88% | 0% | $0
Facility
$0
MA AVG
$76.6k
Rank
#1 / 94 | 27
Facility
27
MA AVG
32.7
Rank
#47 / 93 | 3.9
Facility
3.9
MA AVG
7.2
Rank
#18 / 93 | - | 165 | - |
78
Facility
78
MA AVG
53
Rank
#133 / 499 | Joao Santos | $24.8M
Facility
$24.8M
MA AVG
$17.4M
Rank
#12 / 96 | $20.1M
Facility
$20.1M
MA AVG
$6.5M
Rank
#5 / 96 | 81.1%
Facility
81.1%
MA AVG
43.6%
Rank
#7 / 96 | 225201 | ||||
| Edgar P. Benjamin Healthcare Center | NH PC RC | Boston (Mission Hill) | 205
Facility
205
MA AVG
94
Rank
#7 / 280 |
49.3%
Facility
49.3%
MA AVG
82%
Rank
#91 / 96 | -40% | 3.45
Facility
3.45
MA AVG
3.93
Rank
#72 / 93 | +36% | -12% | $95.0k
Facility
$95.0k
MA AVG
$76.6k
Rank
#85 / 94 | 32
Facility
32
MA AVG
32.7
Rank
#60 / 93 | 5.3
Facility
5.3
MA AVG
7.2
Rank
#34 / 93 | 2 | 80 | - |
82
Facility
82
MA AVG
53
Rank
#108 / 499 | Tony Francis | $9.3M
Facility
$9.3M
MA AVG
$17.4M
Rank
#83 / 96 | $8.3M
Facility
$8.3M
MA AVG
$6.5M
Rank
#64 / 96 | 89.7%
Facility
89.7%
MA AVG
43.6%
Rank
#4 / 96 | 225654 |
St. Joseph Rehabilitation and Nursing Center is located in Dorchester, Massachusetts.
Here are the financial assistance programs available to residents in Massachusetts.
St. Joseph Rehabilitation and Nursing Center has a walk score of 83. Very walkable. Most errands can be accomplished on foot, and many essentials are within a short walk.
St. Joseph Rehabilitation and Nursing Center's occupancy is 91.1%.
Yes — see the floorplan options available at St. Joseph Rehabilitation and Nursing Center on this page.
St. Joseph Rehabilitation and Nursing Center is registered as a for-profit in MA.
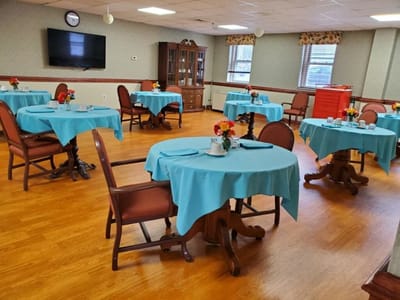
Yes — there are 55 photos of St. Joseph Rehabilitation and Nursing Center in the photo gallery on this page.
St. Joseph Rehabilitation and Nursing Center is located at 321 Centre St, Dorchester, MA 02122.
(617) 825-6320 will put you in contact with the team at St. Joseph Rehabilitation and Nursing Center.
Care Cost Calculator: See Prices in Your Area
Nursing Home Data Explorer
Don’t Wait Too Long: 7 Red Flag Signs Your Parent Needs Assisted Living Now
The True Cost of Assisted Living in 2025 – And How Families Are Paying For It
Understanding Senior Living Costs: Pricing Models, Discounts & Financial Assistance


