


Total staff
92
Employees
85
Contractors
7
Edgar P. Benjamin Healthcare Center offers an inviting community with fine hospitality. The nursing home promotes social activities, education programs, spiritual and religious activities, and arts and crafts to its residents to cultivate their mental and physical abilities. Skilled nursing and rehabilitation for residents each get personalized care that focuses on their specific and unique needs.
A personal touch approach is the key feature of the nursing home’s service. Management ensures that services are delivered with compassion and kindness, so that residents can feel comfortable and secure in the community. A few of their essential amenities and services that help with residential lifestyle include medication management, and geriatric care are offered; their 24-hour skilled nursing care services provide compassionate care as it is their utmost priority.
| Staff type | Hours / Day / Resident | vs state avg |
|---|---|---|
|
Registered Nurse (RN)
| 45m per day | ▲ 16% State avg: 39m per day · National avg: 41m per day |
|
LPN / LVN
| 30m per day | ▼ 48% State avg: 58m per day · National avg: 52m per day |
|
Nurse Aide
| 2h 14m per day | ■ Avg State avg: 2h 16m per day · National avg: 2h 21m per day |
|
Weekend Total Nursing
| 3h 17m per day | ▼ 5% State avg: 3h 27m per day · National avg: 3h 26m per day |
|
Physical Therapist
| 2m per day | ▼ 45% State avg: 4m per day · National avg: 4m per day |
|
Weekend RN
| 45m per day | ▲ 62% State avg: 28m per day · National avg: 29m per day |
Reporting period: October 1 – December 31, 2025 (Q4 2025). Source: CMS Payroll-Based Journal report.
Manages medical care and health needs.
Assists with medical care and medications.
Helps with daily care and mobility.
Total hours from contractors
229 contractor hours this quarter
| Certified Nursing Assistant | 44 | 0 | 44 | 16,538 | 92 | 100% | 7.8 |
| Registered Nurse | 12 | 4 | 16 | 4,508 | 92 | 100% | 8.8 |
| Licensed Practical Nurse | 12 | 3 | 15 | 2,732 | 92 | 100% | 7.8 |
| RN Director of Nursing | 2 | 0 | 2 | 963 | 71 | 77% | 8.2 |
| Clinical Nurse Specialist | 2 | 0 | 2 | 677 | 72 | 78% | 6.1 |
| Dietitian | 1 | 0 | 1 | 412 | 57 | 62% | 7.2 |
| Nurse Practitioner | 1 | 0 | 1 | 398 | 55 | 60% | 7.2 |
| Other Dietary Services Staff | 2 | 0 | 2 | 340 | 45 | 49% | 7.1 |
| Physical Therapy Assistant | 1 | 0 | 1 | 318 | 60 | 65% | 5.3 |
| Occupational Therapy Aide | 1 | 0 | 1 | 282 | 40 | 43% | 7 |
| Respiratory Therapy Technician | 3 | 0 | 3 | 268 | 53 | 58% | 4.3 |
| Physical Therapy Aide | 2 | 0 | 2 | 131 | 22 | 24% | 5.5 |
| Mental Health Service Worker | 1 | 0 | 1 | 115 | 26 | 28% | 4.4 |
| Qualified Social Worker | 1 | 0 | 1 | 9 | 2 | 2% | 4.5 |
Includes penalties issued in 2025
Federal penalties imposed by CMS for regulatory violations, including civil money penalties (fines) and denials of payment for new Medicare/Medicaid admissions.
Source: CMS Penalties Database (Data as of Jan 2026)
Massachusetts average: $72K
Massachusetts average: 1.7
Massachusetts average: 0.1
Penalties are imposed by CMS for violations of federal nursing home regulations.
1 penalty in the past 3 years
Jul 10, 2025 · $93K
Last updated: Jan 2026
These measures show how residents usually do over time at this home, based on health outcomes and preventive care.
Massachusetts average: 10.2
Massachusetts average: 20.0
Massachusetts average: 18.7%
Massachusetts average: 19.3%
Massachusetts average: 22.1%
Massachusetts average: 3.6%
Massachusetts average: 4.7%
Massachusetts average: 2.1%
Massachusetts average: 5.2%
Massachusetts average: 10.7%
Massachusetts average: 20.3%
Massachusetts average: 91.9%
Massachusetts average: 94.8%
Massachusetts average: 1.86
Massachusetts average: 1.54
Massachusetts average: 76.7%
Massachusetts average: 1.3%
Massachusetts average: 77.7%
Quality measures are calculated from Minimum Data Set (MDS) assessments. For most measures, lower percentages indicate better care quality.
6% of new residents, usually for short-term rehab.
42% of new residents, often for short stays.
52% of new residents, often for long-term daily care.
Source: CMS Long-Term Care Facility Characteristics (Data as of Jan 2026)
Data sourced from CMS Long-Term Care Facility Characteristics quarterly report. Payer mix reflects the current resident census by primary payment source.
Historical financial and operational data for Edgar P. Benjamin Healthcare Center from 2011–2023, based on CMS SNF Cost Reports.
Key figures below are for fiscal year ending in 12/2023.
Based on CMS SNF Cost Report for fiscal year ending in 12/2023.
Most residents stay for extended periods and receive ongoing daily care.
Most new residents arrive under Medicaid (52% of admissions), and a typical Medicaid stay runs around 1 - 2 years.
Coverage residents most often arrive under.
Coverage residents most often leave under.
![]() 3.1 miles from city center
3.1 miles from city center
![]() Estimated distance in miles from Boston's city center to Edgar P. Benjamin Healthcare Center's address, calculated via Google Maps.
— 0.3 miles to nearest hospital (Jamaica Plain VA Medical Center)
Estimated distance in miles from Boston's city center to Edgar P. Benjamin Healthcare Center's address, calculated via Google Maps.
— 0.3 miles to nearest hospital (Jamaica Plain VA Medical Center)
Add your location
The information below is reported by the Massachusetts Executive Office of Elder Affairs and Department of Public Health.
| Hebrew SeniorLife | NH AL HC HOS IL MC PC SNF | Boston (Roslindale) | 50
Facility
50
MA AVG
94
Rank
#232 / 276 |
63.2%
Facility
63.2%
MA AVG
78.3
Rank
#71 / 81 | -19% | 4.65
Facility
4.65
MA AVG
3.93
Rank
#12 / 93 | +18% | +18% | $0
Facility
$0
MA AVG
$76.6k
Rank
#1 / 94 | 11
Facility
11
MA AVG
32.7
Rank
#9 / 93 | 3.7
Facility
3.7
MA AVG
7.2
Rank
#16 / 93 | - | 32 | - |
38
Facility
38
MA AVG
53
Rank
#324 / 498 | - | - | - | - | 225759 | ||||
| The Boston Home Inc | NH RC SNF | Dorchester Center (Dorchester) | 96
Facility
96
MA AVG
94
Rank
#108 / 276 |
97.0%
Facility
97.0%
MA AVG
78.3
Rank
#3 / 81 | +24% | 5.17
Facility
5.17
MA AVG
3.93
Rank
#7 / 93 | -18% | +32% | $0
Facility
$0
MA AVG
$76.6k
Rank
#1 / 94 | 8
Facility
8
MA AVG
32.7
Rank
#7 / 93 | 8.0
Facility
8.0
MA AVG
7.2
Rank
#64 / 93 | - | 93 | - |
76
Facility
76
MA AVG
53
Rank
#146 / 498 | Christine Reilly | $15.6MFiscal year ending 12/2023
Facility
$15.6MFiscal year ending 12/2023
MA AVG
$17.4M
Rank
#35 / 96 | $14.5MFiscal year ending 12/2023
Facility
$14.5MFiscal year ending 12/2023
MA AVG
$6.5M
Rank
#11 / 96 | 92.6%Fiscal year ending 12/2023
Facility
92.6%Fiscal year ending 12/2023
MA AVG
43.6%
Rank
#12 / 96 | 225434 | ||||
| St. Joseph Rehabilitation and Nursing Center | NH HOS MC SNF | Dorchester | 123
Facility
123
MA AVG
94
Rank
#55 / 276 |
31.7%
Facility
31.7%
MA AVG
78.3
Rank
#78 / 81 | -60% | 3.90
Facility
3.90
MA AVG
3.93
Rank
#43 / 93 | +40% | -1% | $82.6k
Facility
$82.6k
MA AVG
$76.6k
Rank
#84 / 94 | 50
Facility
50
MA AVG
32.7
Rank
#82 / 93 | 8.3
Facility
8.3
MA AVG
7.2
Rank
#65 / 93 | 6 | 39 | A+ |
83
Facility
83
MA AVG
53
Rank
#102 / 498 | Landmark Health Solutions, LLC | $15.5MFiscal year ending 12/2023
Facility
$15.5MFiscal year ending 12/2023
MA AVG
$17.4M
Rank
#48 / 96 | $9.9MFiscal year ending 12/2023
Facility
$9.9MFiscal year ending 12/2023
MA AVG
$6.5M
Rank
#52 / 96 | 63.6%Fiscal year ending 12/2023
Facility
63.6%Fiscal year ending 12/2023
MA AVG
43.6%
Rank
#55 / 96 | 225493 | ||||
| Sherrill House | NH HOS MC PC SNF | Boston (Jamaica Hills) | 196
Facility
196
MA AVG
94
Rank
#9 / 276 |
84.3%
Facility
84.3%
MA AVG
78.3
Rank
#38 / 81 | +8% | 3.94
Facility
3.94
MA AVG
3.93
Rank
#43 / 93 | +88% | 0% | $0
Facility
$0
MA AVG
$76.6k
Rank
#1 / 94 | 27
Facility
27
MA AVG
32.7
Rank
#47 / 93 | 3.9
Facility
3.9
MA AVG
7.2
Rank
#18 / 93 | - | 165 | - |
78
Facility
78
MA AVG
53
Rank
#133 / 498 | Joao Santos | $24.8MFiscal year ending 12/2023
Facility
$24.8MFiscal year ending 12/2023
MA AVG
$17.4M
Rank
#12 / 96 | $20.1MFiscal year ending 12/2023
Facility
$20.1MFiscal year ending 12/2023
MA AVG
$6.5M
Rank
#5 / 96 | 81.1%Fiscal year ending 12/2023
Facility
81.1%Fiscal year ending 12/2023
MA AVG
43.6%
Rank
#8 / 96 | 225201 | ||||
| Edgar P. Benjamin Healthcare Center | NH PC RC SNF | Boston (Mission Hill) | 205
Facility
205
MA AVG
94
Rank
#7 / 276 |
39.1%
Facility
39.1%
MA AVG
78.3
Rank
#76 / 81 | -50% | 3.45
Facility
3.45
MA AVG
3.93
Rank
#72 / 93 | +36% | -12% | $95.0k
Facility
$95.0k
MA AVG
$76.6k
Rank
#85 / 94 | 32
Facility
32
MA AVG
32.7
Rank
#60 / 93 | 5.3
Facility
5.3
MA AVG
7.2
Rank
#34 / 93 | 2 | 80 | - |
82
Facility
82
MA AVG
53
Rank
#108 / 498 | Tony Francis | $9.3MFiscal year ending 12/2023
Facility
$9.3MFiscal year ending 12/2023
MA AVG
$17.4M
Rank
#82 / 96 | $8.3MFiscal year ending 12/2023
Facility
$8.3MFiscal year ending 12/2023
MA AVG
$6.5M
Rank
#65 / 96 | 89.7%Fiscal year ending 12/2023
Facility
89.7%Fiscal year ending 12/2023
MA AVG
43.6%
Rank
#5 / 96 | 225654 |
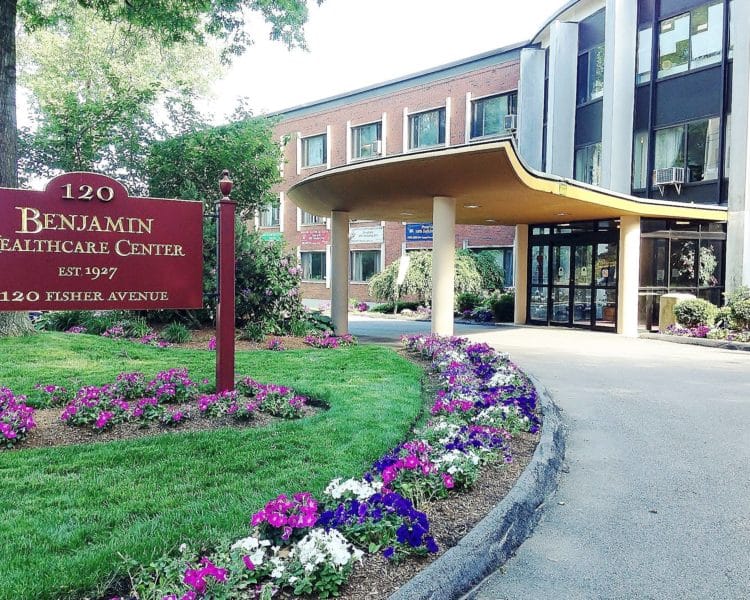
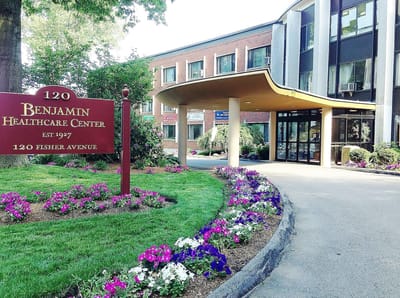
Edgar P. Benjamin Healthcare Center is located in Boston, Massachusetts.
Here are the financial assistance programs available to residents in Massachusetts.
Edgar P. Benjamin Healthcare Center is in the Mission Hill neighborhood.
Edgar P. Benjamin Healthcare Center has a walk score of 82. Very walkable. Most errands can be accomplished on foot, and many essentials are within a short walk.
Edgar P. Benjamin Healthcare Center's occupancy is 49.3%.
Edgar P. Benjamin Healthcare Center is registered as a non-profit.
Yes — there are 2 photos of Edgar P. Benjamin Healthcare Center in the photo gallery on this page.
Edgar P. Benjamin Healthcare Center is located at 120 Fisher Ave, Boston, MA 02120.
(617) 738-1500 will put you in contact with the team at Edgar P. Benjamin Healthcare Center.
Care Cost Calculator: See Prices in Your Area
Nursing Home Data Explorer
Don’t Wait Too Long: 7 Red Flag Signs Your Parent Needs Assisted Living Now
The True Cost of Assisted Living in 2025 – And How Families Are Paying For It
Understanding Senior Living Costs: Pricing Models, Discounts & Financial Assistance


