Explore Open Rooms
1 Contact details
2 What type of senior care service are you looking for?
3 What budget do you have in mind for senior care?
4 How soon do you need to find care?
5 Additional details

Thank you for your interest!

Our team will be in touch shortly to help with next steps.

Nursing Home in Boston

CMS overall rating Info The Overall CMS Rating combines results from health inspections, staffing levels and quality measures. Health inspections carry the most weight. Staffing and quality scores can increase or decrease the final rating based on performance compared to state and national standards.

Parkway Health & Rehabilitation Center

Overview of Parkway Health & Rehabilitation Center

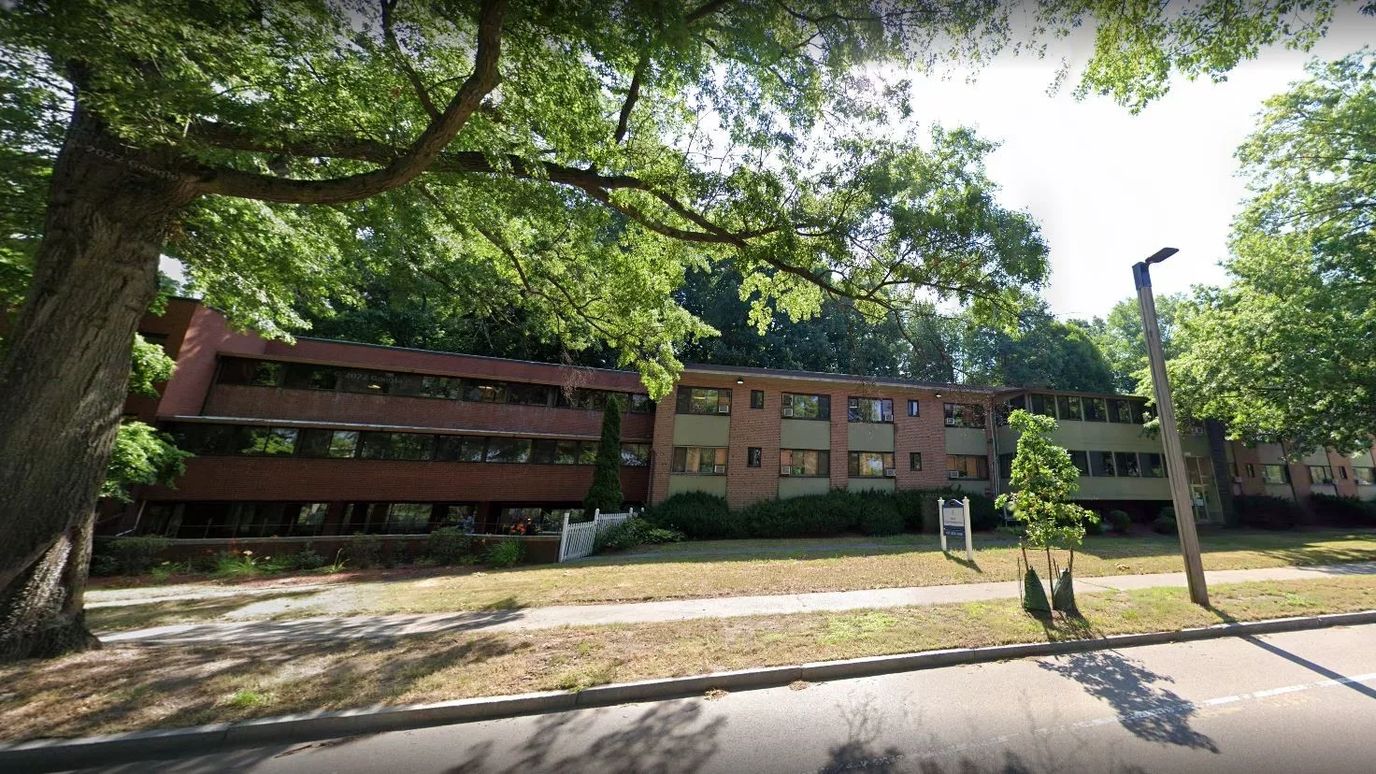
The Parkway Health and Rehabilitation Center approaches its service with the understanding that its residents need a sense of healing– both on the physical and emotional level. The staff ensures residents are inspired to grow as better individuals through their enhanced lifestyle in a vibrant and positive environment. Families of Parkway Health and Rehabilitation Center can surely rest easy knowing that their loved ones are in good hands. 
Parkway is a comprehensive and flexible nursing home that focuses on skilled nursing, wound care, memory care, hospice care, and long-term and short-term care. The residents are surely enthralled because of the warm and welcoming environment the community strives to maintain. From dining experience to outdoor walking, or relaxing reading books– Parkway aims to satisfy the body, spirit, and mind of its residents.

Quality ratings

Measured by Centers for Medicare & Medicaid Services (CMS)

Overall rating Info The Overall CMS Rating combines results from health inspections, staffing levels and quality measures. Health inspections carry the most weight. Staffing and quality scores can increase or decrease the final rating based on performance compared to state and national standards.
1/5
Massachusetts average: 2.9/5
Health Inspection Info Based on the results of the facility's three most recent standard inspections and any complaint investigations. CMS reviews the number, scope, and severity of deficiencies, with more recent findings weighted more heavily.
1/5
Massachusetts average: 2.8/5
Staffing Info Measures average nursing staff hours per resident per day, including Registered Nurses (RNs) and total nursing staff. Ratings are adjusted based on the level of care residents require and are compared to state and national benchmarks.
2/5
Massachusetts average: 3.0/5
Quality Measures Info Based on clinical and physical health indicators reported to CMS, such as hospital readmissions, falls, pressure ulcers, and improvements in mobility. These measures reflect how well residents' health needs are being managed.
2/5
Massachusetts average: 3.2/5

Nursing care per resident

Info This shows how many total hours of nursing staff time are available per resident each day. Higher numbers usually mean more staff support.
3h 12m per day

This home provides 19% less nursing time per resident than the Massachusetts average.

Massachusetts average: 3h 56m per day

Staffing hours breakdown

Info Hours of care per resident per day, broken down by staff type. Data from CMS Medicare.
Staff type Facility State avg National avg
Registered Nurse (RN) Info Registered nurse hours per resident per day. 39m per day 39m per day 41m per day
Nurse Aide Info Nurse aide hours per resident per day. 1h 53m per day 2h 16m per day 2h 21m per day
Total Nursing (Weekend) Info Total number of nurse staff hours per resident per day on weekends. 2h 44m per day 3h 27m per day 3h 26m per day
Physical Therapist Info Physical therapist staff hours per resident per day. 2m per day 4m per day 4m per day
RN (Weekend) Info Registered nurse hours per resident per day on weekends. 24m per day 28m per day 29m per day

Capacity and availability

Medium-capacity home

Offers a balance of services and community atmosphere.

Total beds 141

This home usually has availability

Lower occupancy suggests more openings may be available.

Lower demand than the Massachusetts average
Occupancy rate 73.9%
Residents per day (avg) 129
Occupancy rate
73.9%
Residents per day (avg)
129

Who this home usually serves

TYPE OF STAY

Mostly short-term rehab stays

Most residents typically stay for a few weeks or months before returning home or moving on.

Might be optimal for
Short stays Recovery Medicare-covered care

Breakdown by payment type

Medicare

69% of new residents, usually for short-term rehab.

Typical stay 11 days

Private pay

17% of new residents, often for short stays.

Typical stay 3 years

Medicaid

14% of new residents, often for long-term daily care.

Typical stay 2 - 3 years

Finances and operations

Privately-owned community
Operated by a business corporation.
Home revenue
$12.7M
Operating loss
-$2.0M
Privately-owned community Operated by a business corporation.
Home revenue
$12.7M
Operating loss
-$2.0M
Payroll costs Info The portion of the home's budget spent on staff, including nurses, caregivers, and other employees who support care and operations.
$5.9M
46.4% of revenue
Other operating costs Info All remaining costs needed to run the home, such as food, utilities, building maintenance, supplies and administrative expenses.
$8.7M
Total costs $14.6M
Walk Score
Walk Score: 54 / 100
Moderately walkable. Some errands can be accomplished on foot, with a mix of nearby amenities.

About this community

Therapy & Rehabilitation

3 services
Rehabilitation Services
Respite Care
Short-Term Rehab

Staffing & Medical

2 services
Skilled Nursing
24-Hour Staffing

Amenities & Lifestyle

0 amenities
Specific Programs24/7 Skilled Nursing, Short Term Rehabilitation, Long Term Care, Respite Care, Physical Therapy, Occupational Therapy, Speech Therapy, IV Therapy, Pain Management, Hospice Care, Dementia Management, Outpatient Dialysis, Wound Care, Peg Tube Care, Psych Services, Social Services, Medicaid Specialist, Podiatry Care, Dental/Vision/Audiology Services

Contact Parkway Health & Rehabilitation Center

Health Inspection History

Inspections
Total health inspections 11

Massachusetts average 4.5


Last Health inspection on Nov 2025

Total health citations 94

Massachusetts average 32.7

Citations per inspection
8.55

Massachusetts average 7.24


Health citations are formal notices following inspections when they fail to comply with safety and care standards.

82 of 94 citations resulted from standard inspections; and 12 of 94 resulted from complaint investigations.

Breakdown of citation severity (last 3 years)
Critical Health citations More info 0
100% better than Massachusetts average

Massachusetts average: 0.3


Serious Health citations More info 5
233% worse than Massachusetts average

Massachusetts average: 1.5

0 critical citations More info Massachusetts average: 0.3

5 serious citations More info Massachusetts average: 1.5

87 moderate citations More info Massachusetts average: 29.7

2 minor citations More info Massachusetts average: 1.3
Citations history (last 3 years)
Quality of Care moderate citation Info Issues related to how well residents receive appropriate treatment and support for their medical and daily care needs. Nov 17, 2025
Corrected

Resident Rights moderate citation Info Issues related to resident's rights, including dignity, privacy, and the ability to make decisions about their care. Nov 17, 2025
Corrected

Abuse/Neglect moderate citation Info Issues related to protecting resident's from harm, including abuse, neglect, or mistreatment. May 20, 2025
Corrected

Pharmacy serious citation Info Issues related to medication management, including how drugs are stored, administered, and monitored. Mar 19, 2025
Corrected

Compare Nursing Homes around Boston The information below is reported by the Massachusetts Executive Office of Elder Affairs and Department of Public Health.

5 facilities compared · CMS & MA Dept. of Health data · Updated Apr 2026

Filter by care type
Sherrill House
NH

Nursing Home Licensed facility providing 24/7 skilled nursing care for residents with complex, ongoing medical needs. Staffed by RNs, LPNs, and CNAs. Inspected and star-rated annually by CMS. Accepts Medicare (short-term rehab) and Medicaid (long-term care).

AL

Assisted Living A licensed, long-term care setting for seniors or individuals with disabilities who need help with daily activities — like bathing, dressing, and medication management — but not 24-hour skilled nursing. Offers housing, meals, and around-the-clock support while aiming to maximize resident independence.

Boston (Jamaica Hills)
182
79.7%
-3%
3.94
+36%
0%
0
27
3.9
0
160
-
78
Santos, Joao
$27.6M
$17.2M
62.3%
225201
Edgar P. Benjamin Healthcare Center
NH

Nursing Home Licensed facility providing 24/7 skilled nursing care for residents with complex, ongoing medical needs. Staffed by RNs, LPNs, and CNAs. Inspected and star-rated annually by CMS. Accepts Medicare (short-term rehab) and Medicaid (long-term care).

AL

Assisted Living A licensed, long-term care setting for seniors or individuals with disabilities who need help with daily activities — like bathing, dressing, and medication management — but not 24-hour skilled nursing. Offers housing, meals, and around-the-clock support while aiming to maximize resident independence.

Boston (Mission Hill)
164
49.3%
-40%
3.45
+12%
-12%
1
32
5.3
2
82
-
82
Francis, Tony
$10.0M
$7.3M
73.3%
225654
Parkway Health & Rehabilitation Center
NH

Nursing Home Licensed facility providing 24/7 skilled nursing care for residents with complex, ongoing medical needs. Staffed by RNs, LPNs, and CNAs. Inspected and star-rated annually by CMS. Accepts Medicare (short-term rehab) and Medicaid (long-term care).

AL

Assisted Living A licensed, long-term care setting for seniors or individuals with disabilities who need help with daily activities — like bathing, dressing, and medication management — but not 24-hour skilled nursing. Offers housing, meals, and around-the-clock support while aiming to maximize resident independence.

West Roxbury (West Roxbury)
141
73.9%
-10%
3.20
+1%
-19%
4
94
8.6
5
129
-
54
Pourali, Saeed
$12.6M
$5.9M
46.6%
225497
Marian Manor Nursing Home
-
AL

Assisted Living A licensed, long-term care setting for seniors or individuals with disabilities who need help with daily activities — like bathing, dressing, and medication management — but not 24-hour skilled nursing. Offers housing, meals, and around-the-clock support while aiming to maximize resident independence.

IL

Independent Living Lifestyle-focused communities for older adults offering dining, activities, and transportation with minimal personal care. Best for active, independent seniors who want community without medical support.

MC

Memory Care Secured, specialized care for people living with Alzheimer's or dementia. Staff trained in cognitive impairment, with higher staff-to-resident ratios and an environment designed to reduce confusion and wandering risk.

NH

Nursing Home Licensed facility providing 24/7 skilled nursing care for residents with complex, ongoing medical needs. Staffed by RNs, LPNs, and CNAs. Inspected and star-rated annually by CMS. Accepts Medicare (short-term rehab) and Medicaid (long-term care).

Boston (South Boston)
248
60.7%
-26%
-
-
-
-
-
-
0
0
0.0
0
-
-
96
Anderson, Kahoney
$26.7M
$8.1M
30.2%
225415
North End Rehabilitation & Healthcare Center
-
NH

Nursing Home Licensed facility providing 24/7 skilled nursing care for residents with complex, ongoing medical needs. Staffed by RNs, LPNs, and CNAs. Inspected and star-rated annually by CMS. Accepts Medicare (short-term rehab) and Medicaid (long-term care).

AL

Assisted Living A licensed, long-term care setting for seniors or individuals with disabilities who need help with daily activities — like bathing, dressing, and medication management — but not 24-hour skilled nursing. Offers housing, meals, and around-the-clock support while aiming to maximize resident independence.

Boston
-
-
-
-
-
-
-
-
-
0
0
0.0
0
-
-
100
-
-
-
-
-

Places of interest near Parkway Health & Rehabilitation Center

Address 0.6 miles from city center — 2.27 miles to nearest hospital (Hebrew Rehabilitation Center - Boston)

Calculate Travel Distance to Parkway Health & Rehabilitation Center

Add your location

Address

Staffing Data (Q2 2025)

This data corresponds to Q2 2025 and is based on CMS Payroll-Based Journal.

Total staff 122
Employees 114
Contractors 8
Staff to resident ratio 0.92:1
46% worse than Massachusetts average

Massachusetts average ratio: 1.70:1

Avg staff/day 52
Average shift 8.3 hours
5% better than Massachusetts average

Massachusetts average: 7.9 hours

Total staff hours (quarter) 39,369
Nursing staff breakdown
Registered Nurse

Manages medical care and health needs.

Total count 16
Average shift length Info Average shift length. Calculated as total hours divided by days worked and average staff per day. 9.5 hours

No contractors work on this role.

Licensed Practical Nurse

Assists with medical care and medications.

Total count 16
Average shift length Info Average shift length. Calculated as total hours divided by days worked and average staff per day. 9.3 hours

No contractors work on this role.

Certified Nursing Assistant

Helps with daily care and mobility.

Total count 56
Average shift length Info Average shift length. Calculated as total hours divided by days worked and average staff per day. 8.3 hours

No contractors work on this role.

Contractor staffing

Total hours from contractors

1.1%

436 contractor hours this quarter

Diagnostic X-ray Services Staff: 3 Feeding Assistant: 2 Medical Director: 2 Other Physician: 1
Staff by category
Certified Nursing Assistant5605621,77491100%8.3
Registered Nurse160165,86891100%9.5
Licensed Practical Nurse160165,48891100%9.3
Clinical Nurse Specialist5051,4847582%9.1
Physical Therapy Assistant4047807279%7.4
Nurse Practitioner1015596774%8.3
Administrator1015126470%8
Other Dietary Services Staff2025026268%7.7
RN Director of Nursing2024395257%7.1
Respiratory Therapy Technician4043796268%5.1
Occupational Therapy Aide1013515055%7
Respiratory Therapist1013114549%6.9
Mental Health Service Worker1012955358%5.6
Feeding Assistant0222104448%4.4
Qualified Social Worker2021341820%7.4
Diagnostic X-ray Services Staff0331342325%5.8
Speech Language Pathologist202591112%5.3
Medical Director022532426%2
Other Physician011391314%3
56 Certified Nursing Assistant
% of Days 100%
16 Registered Nurse
% of Days 100%
16 Licensed Practical Nurse
% of Days 100%
5 Clinical Nurse Specialist
% of Days 82%
4 Physical Therapy Assistant
% of Days 79%
1 Nurse Practitioner
% of Days 74%
1 Administrator
% of Days 70%
2 Other Dietary Services Staff
% of Days 68%
2 RN Director of Nursing
% of Days 57%
4 Respiratory Therapy Technician
% of Days 68%
1 Occupational Therapy Aide
% of Days 55%
1 Respiratory Therapist
% of Days 49%
1 Mental Health Service Worker
% of Days 58%
2 Feeding Assistant
% of Days 48%
2 Qualified Social Worker
% of Days 20%
3 Diagnostic X-ray Services Staff
% of Days 25%
2 Speech Language Pathologist
% of Days 12%
2 Medical Director
% of Days 26%
1 Other Physician
% of Days 14%

Facility Characteristics

Source: CMS Long-Term Care Facility Characteristics (Data as of Jan 2026)

Total census
132 residents
Residents by payment source
Medicare
11 residents (8.3%)
Medicaid
119 residents (90.2%)
Private pay or other
2 residents (1.5%)
Programs & Services
Residents' Group

Residents meet regularly to discuss policies, care quality, and activities

Active Resident Council

Organized group of residents that meets regularly to discuss facility policies, quality of life, and activities.

Quality of care over time

These measures show how residents usually do over time at this home, based on health outcomes and preventive care.

High-risk clinical events score Info A composite score based on pressure ulcers, falls with injury, weight loss, walking ability decline, and activities of daily living decline. 10.0
In line with Massachusetts average

Massachusetts average: 10.2

Functional decline score Info A composite score based on activities of daily living decline, walking ability decline, and incontinence. 14.0
30% better than Massachusetts average

Massachusetts average: 20.0

Long-stay resident measures
Average Massachusetts avg: 3.5 Info CMS star rating based on long-stay quality measure performance. 5 stars = significantly above average, 1 star = significantly below average.
Need for Help with Daily Activities Increased Info Percent of long-stay residents whose need for help with daily activities has increased 21.0%
12% worse than Massachusetts average

Massachusetts average: 18.7%

Walking Ability Worsened Info Percent of long-stay residents whose ability to move independently worsened 15.6%
20% better than Massachusetts average

Massachusetts average: 19.3%

Low Risk Residents with Bowel/Bladder Incontinence Info Percent of low risk long-stay residents who lose control of their bowels or bladder 5.4%
75% better than Massachusetts average

Massachusetts average: 22.1%

Falls with Major Injury Info Percent of long-stay residents experiencing one or more falls with major injury 2.5%
31% better than Massachusetts average

Massachusetts average: 3.6%

High Risk Residents with Pressure Ulcers Info Percent of long-stay high risk residents with pressure ulcers 4.8%
In line with Massachusetts average

Massachusetts average: 4.7%

Urinary Tract Infection Info Percent of long-stay residents with a urinary tract infection 2.6%
23% worse than Massachusetts average

Massachusetts average: 2.1%

Lost Too Much Weight Info Percent of long-stay residents who lose too much weight 6.4%
23% worse than Massachusetts average

Massachusetts average: 5.2%

Depressive Symptoms Info Percent of long-stay residents who have depressive symptoms 1.0%
91% better than Massachusetts average

Massachusetts average: 10.7%

Antipsychotic Use Info Percent of long-stay residents who received an antipsychotic medication 19.5%
In line with Massachusetts average

Massachusetts average: 20.3%

Pneumococcal Vaccine Info Percent of long-stay residents assessed and appropriately given the pneumococcal vaccine 92.3%
In line with Massachusetts average

Massachusetts average: 91.9%

Influenza Vaccine Info Percent of long-stay residents assessed and appropriately given the seasonal influenza vaccine 99.2%
5% better than Massachusetts average

Massachusetts average: 94.8%

Hospitalizations per 1,000 days Info Number of hospitalizations per 1,000 long-stay resident days. 1.42
24% better than Massachusetts average

Massachusetts average: 1.86

ED visits per 1,000 days Info Number of outpatient emergency department visits per 1,000 long-stay resident days. 0.95
38% better than Massachusetts average

Massachusetts average: 1.54

Short-stay resident measures
Significantly below average Massachusetts avg: 3.4 Info CMS star rating based on short-stay quality measure performance. 5 stars = much above average, 1 star = much below average.
Pneumococcal Vaccine Info Percent of short-stay residents assessed and appropriately given the pneumococcal vaccine 60.4%
21% worse than Massachusetts average

Massachusetts average: 76.7%

Antipsychotic medication increase Info Percent of short-stay residents who newly received an antipsychotic medication 3.4%
155% worse than Massachusetts average

Massachusetts average: 1.3%

Influenza Vaccine Info Percent of short-stay residents assessed and appropriately given the seasonal influenza vaccine 94.9%
22% better than Massachusetts average

Massachusetts average: 77.7%

Re-hospitalized after SNF stay Info Percentage of short-stay residents who were re-hospitalized after their nursing home admission. 25.7%
In line with Massachusetts average

Massachusetts average: 25.8%

Emergency department visits Info Percentage of short-stay residents who had an outpatient emergency department visit. 5.4%
54% better than Massachusetts average

Massachusetts average: 11.8%

Falls with major injury Info Percentage of SNF residents who experience falls with major injury during their stay. 0.0%
100% better than Massachusetts average

Massachusetts average: 0.8%

Successful return to home or community Info Rate of successful return to home or community from a skilled nursing facility. 32.8%
35% worse than Massachusetts average

Massachusetts average: 50.6%

Penalties and fines

Federal penalties imposed by CMS for regulatory violations, including civil money penalties (fines) and denials of payment for new Medicare/Medicaid admissions.

Source: CMS Penalties Database (Data as of Jan 2026)

Total fines amount $187K
160% higher than Massachusetts average

Massachusetts average: $72K

Number of fines 3
75% more fines than Massachusetts average

Massachusetts average: 1.7

Payment Denials Info Serious action where Medicare and/or Medicaid temporarily stops payments for new residents until issues are fixed. 0
100% fewer payment denials than Massachusetts average

Massachusetts average: 0.1

Fines amount comparison
This facility $187K
Massachusetts average $72K
Penalty History

Penalties are imposed by CMS for violations of federal nursing home regulations.

Civil Money Penalty Info Fines imposed for noncompliance, which can be assessed per day or per instance of violation. Feb 13, 2025
$11K
Civil Money Penalty Info Fines imposed for noncompliance, which can be assessed per day or per instance of violation. Nov 30, 2023
$18K
Civil Money Penalty Info Fines imposed for noncompliance, which can be assessed per day or per instance of violation. May 25, 2023
$158K

Last updated: Jan 2026

Guides for Better Senior Living

Care Cost Calculator: See Prices in Your Area

Nursing Home Data Explorer

Don’t Wait Too Long: 7 Red Flag Signs Your Parent Needs Assisted Living Now

The True Cost of Assisted Living in 2025 – And How Families Are Paying For It

Understanding Senior Living Costs: Pricing Models, Discounts & Financial Assistance

Financial Aid for Massachusetts Seniors

Get financial aid guidance

Home Care Program

MassHealth Home Care

Age 60+, Massachusetts resident, at risk of nursing home placement.

~$1,500/month (individual, varies by region).

$2,000 (individual, excludes home, car).

Coordinated through Aging Services Access Points (ASAPs); high demand in urban areas.

Frail Elder Waiver

Massachusetts Medicaid FE Waiver

Age 65+, Massachusetts resident, Medicaid-eligible, nursing home-level care need.

~$2,829/month (300% FBR, individual).

$2,000 (individual), $3,000 (couple).

Requires clinical eligibility determination.

Senior Care Options (SCO)

Massachusetts Senior Care Options

Age 65+, Massachusetts resident, eligible for MassHealth (Medicare optional), nursing home-level care need.

~$2,829/month (300% FBR, individual); QIT allowed.

$2,000 (individual), $3,000 (couple) (excludes home up to $713,000, car).

Not available in Dukes/Nantucket Counties; multiple SCO providers (e.g., CCA, Tufts).

Medicare Savings Program (MSP)

Massachusetts Medicare Savings Program (MassHealth Buy-In)

Age 65+ or disabled, Massachusetts resident, Medicare Part A/B.

~$2,510/month (QMB), ~$3,380/month (SLMB), ~$3,598/month (QI)—individual.

$9,430 (individual), $14,130 (couple).

Three tiers; no waitlist; includes Extra Help for Part D.

National Family Caregiver Support Program (NFCSP) Respite

Massachusetts NFCSP Respite Care

Caregivers of 60+ needing care or 55+ caregivers of others; Massachusetts resident; functional needs (2+ ADLs).

Prioritizes ~$24,980/year (individual); no strict cap.

Not assessed; need-based.

27 ASAPs; prioritizes low-income, rural caregivers.

Prescription Advantage

Massachusetts Prescription Advantage

Age 65+ or disabled, Massachusetts resident, enrolled in Medicare Part D (or ineligible for Medicare).

No strict limit; copays vary by income (~$24,980-$75,000/year individual).

Not assessed.

Supplements Medicare Part D; no enrollment fee for low-income.

Senior Community Service Employment Program (SCSEP)

Massachusetts SCSEP

Age 55+, unemployed, low-income, Massachusetts resident.

~$1,983/month (125% FPL).

Not specified; income-focused.

Priority for veterans, rural residents; AARP partnership.

VA Aid and Attendance (A&A) and Housebound Benefits

Massachusetts VA Aid and Attendance/Housebound

Age 65+ or disabled veteran/spouse, Massachusetts resident, wartime service, need for ADL help (A&A) or homebound.

Net income < ~$1,984/month (veteran with dependent, A&A); pension offsets income.

~$155,356 (net worth limit).

High veteran demand statewide.