

Total staff
161
Employees
74
Contractors
87

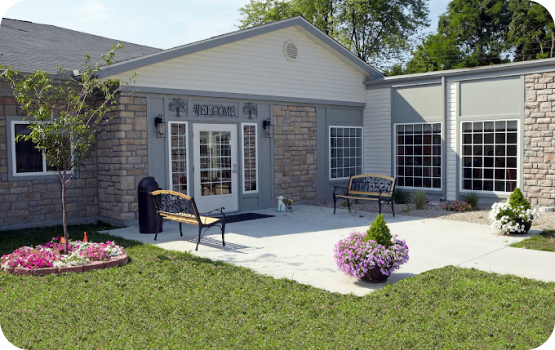
We arrange tours, appointments, and even moving support so you don’t have to
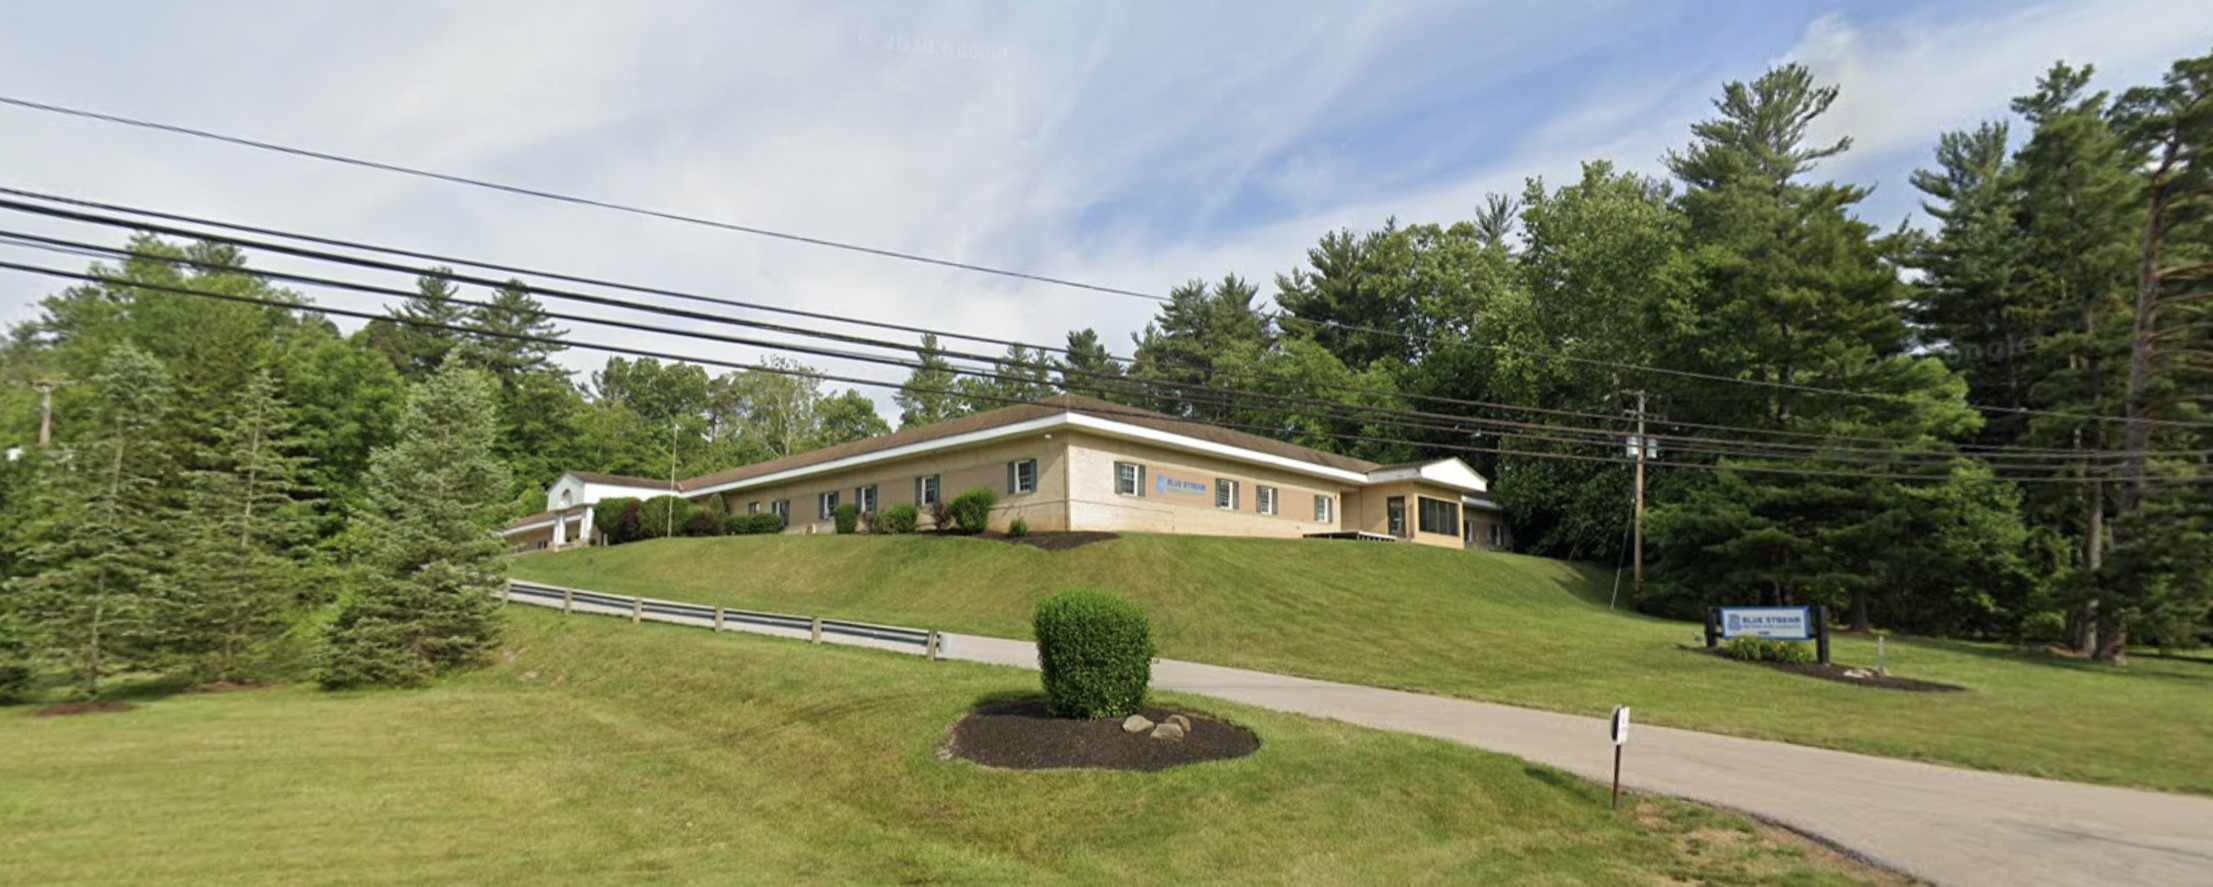


A nursing facility that has delivered an unparalleled level of a professional long-term approach to recovery, Momentous Health at Richfield in Ohio provides outstanding skilled nursing and rehabilitation services for seniors. The upscale nursing home is committed to providing comprehensive and individual-focused tailored care for seniors to maximize recuperation driven by a serene and rejuvenating supportive environment.
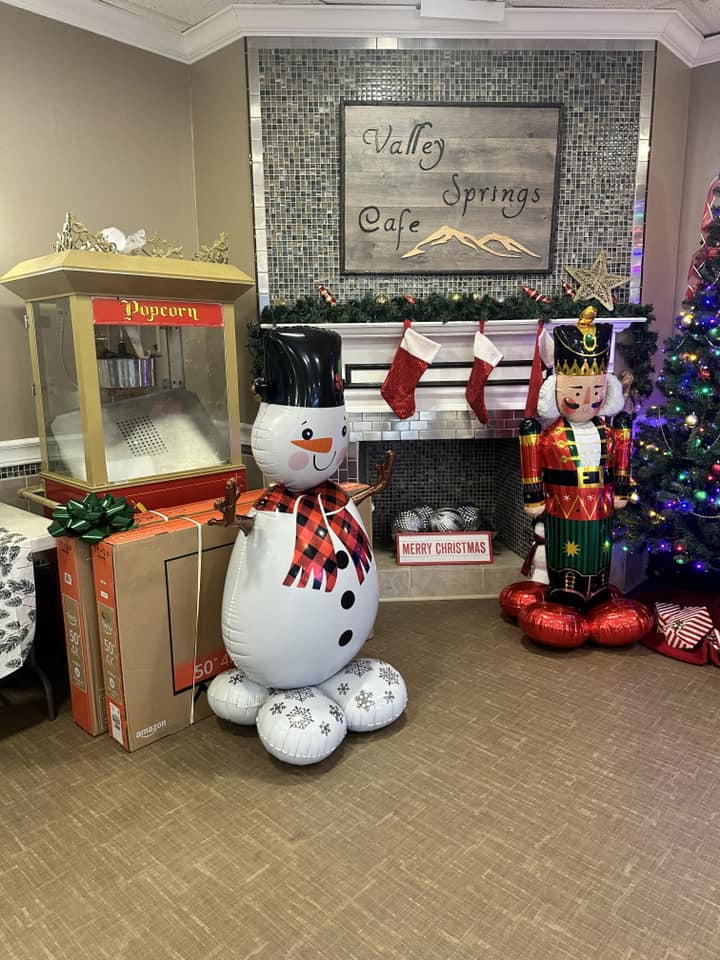
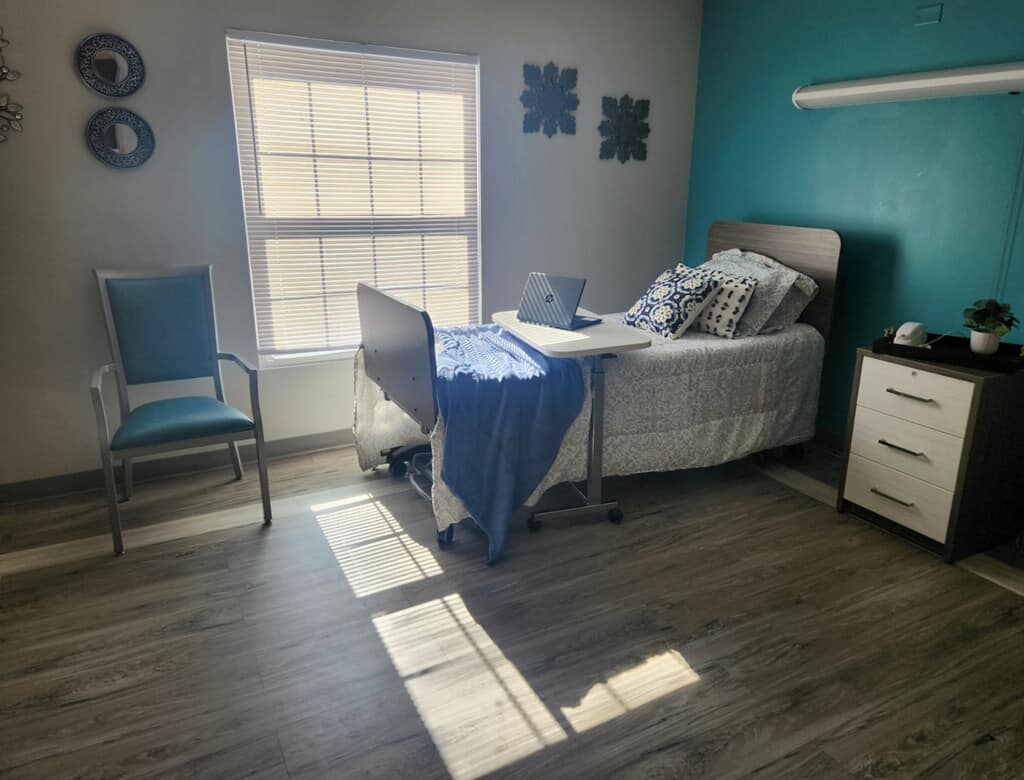
At Momentous Health Richfield, seniors are ensured to experience recovery that exceeds medical treatment. Residents receive holistic wellness in social activities, recreational programs, individualized meal plans, and life-enriching programs. Featured nursing services include orthopedic rehabilitation, diabetic care, pain management, tracheostomy care, psychology and psychiatric support, a dementia unit, IV therapy, and renal dialysis support.
| Staff type | Hours / Day / Resident | vs state avg |
|---|---|---|
|
Registered Nurse (RN)
| 27m per day | ▼ 29% State avg: 38m per day · National avg: 41m per day |
|
LPN / LVN
| 47m per day | ▼ 19% State avg: 58m per day · National avg: 52m per day |
|
Nurse Aide
| 1h 53m per day | ▼ 12% State avg: 2h 8m per day · National avg: 2h 21m per day |
|
Weekend Total Nursing
| 2h 52m per day | ▼ 13% State avg: 3h 17m per day · National avg: 3h 26m per day |
|
Physical Therapist
| 1m per day | ▼ 67% State avg: 3m per day · National avg: 4m per day |
|
Weekend RN
| 16m per day | ▼ 36% State avg: 25m per day · National avg: 29m per day |
Occupancy lower than 85% suggests more openings may be available.
Reporting period: October 1 – December 31, 2025 (Q4 2025). Source: CMS Payroll-Based Journal report.
Manages medical care and health needs.
No contractors work on this role.
Assists with medical care and medications.
This role is partially covered by contractors.
Helps with daily care and mobility.
This role is partially covered by contractors.
Total hours from contractors
2,768 contractor hours this quarter
| Certified Nursing Assistant | 46 | 44 | 90 | 9,373 | 92 | 100% | 8.4 |
| Licensed Practical Nurse | 16 | 25 | 41 | 3,763 | 92 | 100% | 9.3 |
| Registered Nurse | 5 | 0 | 5 | 1,084 | 81 | 88% | 8.6 |
| Dietitian | 1 | 0 | 1 | 484 | 62 | 67% | 7.8 |
| Administrator | 1 | 0 | 1 | 465 | 62 | 67% | 7.5 |
| Physical Therapy Aide | 0 | 1 | 1 | 460 | 64 | 70% | 7.2 |
| Other Dietary Services Staff | 1 | 0 | 1 | 456 | 60 | 65% | 7.6 |
| Nurse Practitioner | 1 | 0 | 1 | 450 | 61 | 66% | 7.4 |
| Mental Health Service Worker | 1 | 0 | 1 | 447 | 62 | 67% | 7.2 |
| RN Director of Nursing | 1 | 0 | 1 | 187 | 24 | 26% | 7.8 |
| Qualified Social Worker | 0 | 2 | 2 | 122 | 39 | 42% | 3.1 |
| Respiratory Therapy Technician | 0 | 5 | 5 | 122 | 47 | 51% | 2.3 |
| Speech Language Pathologist | 0 | 5 | 5 | 85 | 28 | 30% | 2.8 |
| Physical Therapy Assistant | 0 | 5 | 5 | 46 | 23 | 25% | 1.9 |
| Nurse Aide in Training | 1 | 0 | 1 | 11 | 1 | 1% | 11.2 |
Includes penalties issued in 2025
Federal penalties imposed by CMS for regulatory violations, including civil money penalties (fines) and denials of payment for new Medicare/Medicaid admissions.
Source: CMS Penalties Database (Data as of Jan 2026)
Ohio average: $69K
Ohio average: 1.9
Ohio average: 0.5
Penalties are imposed by CMS for violations of federal nursing home regulations.
2 penalties in the past 3 years
Multiple penalties were reported in the last 3 years.
Last updated: Jan 2026
These measures show how residents usually do over time at this home, based on health outcomes and preventive care.
Ohio average: 5.8
Ohio average: 12.7
Ohio average: 6.8%
Ohio average: 8.9%
Ohio average: 22.0%
Ohio average: 3.4%
Ohio average: 3.9%
Ohio average: 0.5%
Ohio average: 6.2%
Ohio average: 24.0%
Ohio average: 8.4%
Ohio average: 92.4%
Ohio average: 94.5%
Ohio average: 78.0%
Ohio average: 75.6%
Quality measures are calculated from Minimum Data Set (MDS) assessments. For most measures, lower percentages indicate better care quality.
7% of new residents, usually for short-term rehab.
28% of new residents, often for short stays.
65% of new residents, often for long-term daily care.
Source: CMS Long-Term Care Facility Characteristics (Data as of Jan 2026)
Residents meet regularly to discuss policies, care quality, and activities
Organized group of residents that meets regularly to discuss facility policies, quality of life, and activities.
Data sourced from CMS Long-Term Care Facility Characteristics quarterly report. Payer mix reflects the current resident census by primary payment source.
Historical financial and operational data for Momentous Health at Richfield based on CMS SNF Cost Reports.
Most residents stay for extended periods and receive ongoing daily care.
Brandy Hummel serves as the Administrator at Momentous Health at Richfield. She leads the community with dedication, ensuring a caring and supportive environment for all residents. Brandy works closely with the team to uphold the community’s commitment to quality senior living.
![]() 1.0 miles from city center
1.0 miles from city center
![]() Estimated distance in miles from Richfield's city center to Momentous Health at Richfield's address, calculated via Google Maps.
— 10.29 miles to nearest hospital (Cleveland Clinic -Strongsville Family Health and Surgery Center)
Estimated distance in miles from Richfield's city center to Momentous Health at Richfield's address, calculated via Google Maps.
— 10.29 miles to nearest hospital (Cleveland Clinic -Strongsville Family Health and Surgery Center)
Add your location
Momentous Health at Richfield is located in Richfield, Ohio.
Here are the financial assistance programs available to residents in Ohio.
The information below is reported by the Ohio Department of Health, Bureau of Survey and Certification.
| Brookdale Westlake Village |
NH Nursing Home Licensed facility providing 24/7 skilled nursing care for residents with complex, ongoing medical needs. Staffed by RNs, LPNs, and CNAs. Inspected and star-rated annually by CMS. Accepts Medicare (short-term rehab) and Medicaid (long-term care).
AL Assisted Living A licensed, long-term care setting for seniors or individuals with disabilities who need help with daily activities — like bathing, dressing, and medication management — but not 24-hour skilled nursing. Offers housing, meals, and around-the-clock support while aiming to maximize resident independence.
IL Independent Living Lifestyle-focused communities for older adults offering dining, activities, and transportation with minimal personal care. Best for active, independent seniors who want community without medical support.
MC Memory Care Secured, specialized care for people living with Alzheimer's or dementia. Staff trained in cognitive impairment, with higher staff-to-resident ratios and an environment designed to reduce confusion and wandering risk. | Westlake | 357 | 79.6% | +1% | 4.38 | +18% | +24% | $0 | 5 | 1.3 | - | 53 | A+ | 25 | Labeed Diab | $13.1M | $10.2M | 78.4% | 366373 | ||||
| Meadow Grove Transitional Care |
NH Nursing Home Licensed facility providing 24/7 skilled nursing care for residents with complex, ongoing medical needs. Staffed by RNs, LPNs, and CNAs. Inspected and star-rated annually by CMS. Accepts Medicare (short-term rehab) and Medicaid (long-term care).
AL Assisted Living A licensed, long-term care setting for seniors or individuals with disabilities who need help with daily activities — like bathing, dressing, and medication management — but not 24-hour skilled nursing. Offers housing, meals, and around-the-clock support while aiming to maximize resident independence.
IL Independent Living Lifestyle-focused communities for older adults offering dining, activities, and transportation with minimal personal care. Best for active, independent seniors who want community without medical support.
MC Memory Care Secured, specialized care for people living with Alzheimer's or dementia. Staff trained in cognitive impairment, with higher staff-to-resident ratios and an environment designed to reduce confusion and wandering risk. | Grove City (Blue Star Drive) | 99 | 96.0% | +22% | 2.98 | +4% | -16% | $0 | 20 | 4.0 | - | 92 | A+ | 1 | Valerie Kettell | $13.4M | $6.1M | 45.2% | 366446 | ||||
| Laurels of Norworth |
NH Nursing Home Licensed facility providing 24/7 skilled nursing care for residents with complex, ongoing medical needs. Staffed by RNs, LPNs, and CNAs. Inspected and star-rated annually by CMS. Accepts Medicare (short-term rehab) and Medicaid (long-term care).
AL Assisted Living A licensed, long-term care setting for seniors or individuals with disabilities who need help with daily activities — like bathing, dressing, and medication management — but not 24-hour skilled nursing. Offers housing, meals, and around-the-clock support while aiming to maximize resident independence.
HC Home Care Professional care delivered in the person's own home — from companionship and errands to skilled nursing and therapy. Allows seniors to age in place. Medicare covers skilled home health when medically necessary.
MC Memory Care Secured, specialized care for people living with Alzheimer's or dementia. Staff trained in cognitive impairment, with higher staff-to-resident ratios and an environment designed to reduce confusion and wandering risk. | Worthington (Worthington Estates East) | 126 | 91.2% | +16% | 3.62 | +18% | +2% | $51.9k | 45 | 4.5 | 3 | 111 | A+ | 50 | Thomas Widney | $16.1M | $8.4M | 52.1% | 365222 | ||||
| Momentous Health at Richfield |
NH Nursing Home Licensed facility providing 24/7 skilled nursing care for residents with complex, ongoing medical needs. Staffed by RNs, LPNs, and CNAs. Inspected and star-rated annually by CMS. Accepts Medicare (short-term rehab) and Medicaid (long-term care).
AL Assisted Living A licensed, long-term care setting for seniors or individuals with disabilities who need help with daily activities — like bathing, dressing, and medication management — but not 24-hour skilled nursing. Offers housing, meals, and around-the-clock support while aiming to maximize resident independence. | Richfield (East Center) | 72 | 52.6% | -33% | 3.55 | -66% | 0% | $239.7k | 103 | 10.3 | 3 | 52 | - | 17 | Richfield Rehab LLC | $5.5M | $2.8M | 50.9% | 365370 | ||||
| Hudson Springs Nursing & Rehab |
NH Nursing Home Licensed facility providing 24/7 skilled nursing care for residents with complex, ongoing medical needs. Staffed by RNs, LPNs, and CNAs. Inspected and star-rated annually by CMS. Accepts Medicare (short-term rehab) and Medicaid (long-term care).
AL Assisted Living A licensed, long-term care setting for seniors or individuals with disabilities who need help with daily activities — like bathing, dressing, and medication management — but not 24-hour skilled nursing. Offers housing, meals, and around-the-clock support while aiming to maximize resident independence.
IL Independent Living Lifestyle-focused communities for older adults offering dining, activities, and transportation with minimal personal care. Best for active, independent seniors who want community without medical support.
MC Memory Care Secured, specialized care for people living with Alzheimer's or dementia. Staff trained in cognitive impairment, with higher staff-to-resident ratios and an environment designed to reduce confusion and wandering risk. | Stow (Colony Park) | 80 | 86.3% | +10% | 3.65 | -12% | +3% | $0 | 40 | 4.0 | 1 | 69 | A | 47 | - | $8.7M | $5.0M | 57.2% | 366434 |
Momentous Health at Richfield is in the East Center neighborhood.
Momentous Health at Richfield has a walk score of 17. Car-dependent. Most errands require a car, with limited nearby walkable options.
Yes — there are 10 photos of Momentous Health at Richfield in the photo gallery on this page.
(330) 659-6166 will put you in contact with the team at Momentous Health at Richfield.
Yes — Momentous Health at Richfield is a CMS-certified provider of Medicare and Medicaid.
Care Cost Calculator: See Prices in Your Area
Nursing Home Data Explorer
Don’t Wait Too Long: 7 Red Flag Signs Your Parent Needs Assisted Living Now
The True Cost of Assisted Living in 2025 – And How Families Are Paying For It
Understanding Senior Living Costs: Pricing Models, Discounts & Financial Assistance


Thank you for your interest!
Our team will be in touch shortly to help with next steps.
