Maunalani Nursing and Rehabilitation Center
Nursing Home, Nursing Care & Palliative Care · Honolulu, HI
CMS overall rating Info CMS (the Centers for Medicare & Medicaid Services) is the federal agency that rates nursing home quality. Its Overall Rating runs from 1 to 5 stars, combining health inspections, staffing, and quality measures, with inspections weighted most heavily.

Maunalani Nursing and Rehabilitation Center

Nursing Home, Nursing Care & Palliative Care · Honolulu, HI
CMS overall rating Info CMS (the Centers for Medicare & Medicaid Services) is the federal agency that rates nursing home quality. Its Overall Rating runs from 1 to 5 stars, combining health inspections, staffing, and quality measures, with inspections weighted most heavily.
Calculator: See prices in your area
Maunalani Nursing and Rehabilitation Center accepts Medicare, Medicaid, and private pay.

Overview of Maunalani Nursing and Rehabilitation Center

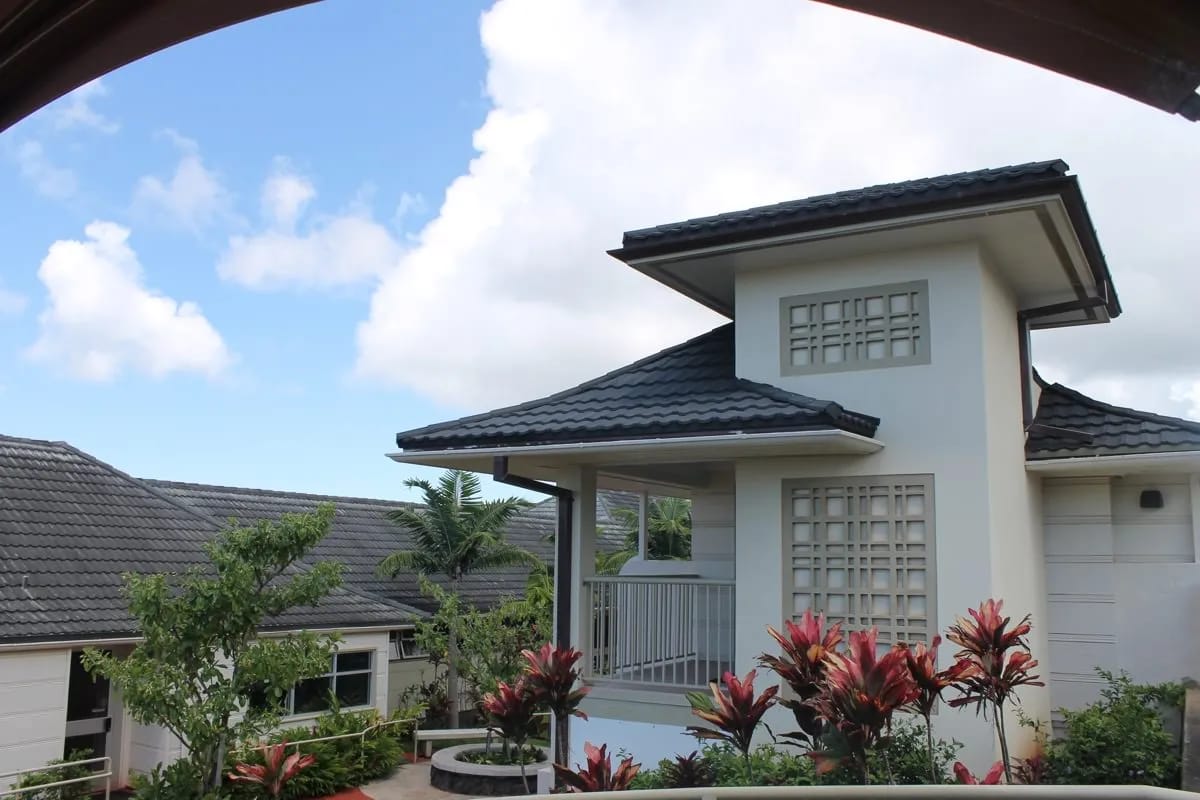
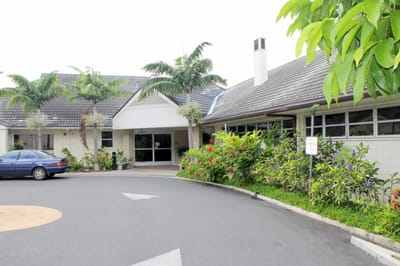
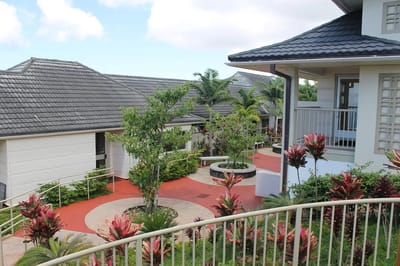
Maunalani Nursing and Rehabilitation Center provides an exemplary approach to skilled nursing; it has pioneered as the home for comprehensive rehabilitation and nursing. One of the longest continuum of care centers in Oahu, the long-term healthcare center gives attention to all levels of care, as well even the complex medical conditions. Maunlani Nursing Center boasts a comfortable and secure environment for a speedy recovery. 
The nursing home is rehabilitative and focuses on receiving results in the services they offer; services include 24-hour nursing available, physicians available, and therapists– all provided to ensure residents all receive their holistic wellness. Therapy services include speech, occupational, and physical that sustain and strengthen daily skills. 

Quality ratings

Measured by Centers for Medicare & Medicaid Services (CMS)

Overall rating Info The Overall CMS Rating combines results from health inspections, staffing levels and quality measures. Health inspections carry the most weight. Staffing and quality scores can increase or decrease the final rating based on performance compared to state and national standards.
▲ 45.4% Above HI avg. ▲ 45.4% Above HI avg.HI average: 3.4Click the badge to see the full State ranking.Click here to see the full State ranking.
Health Inspection Info Based on the results of the facility's three most recent standard inspections and any complaint investigations. CMS reviews the number, scope, and severity of deficiencies, with more recent findings weighted more heavily.
▲ 73.7% Above HI avg. ▲ 73.7% Above HI avg.HI average: 2.9Click the badge to see the full State ranking.Click here to see the full State ranking.
Staffing Info Measures average nursing staff hours per resident per day, including Registered Nurses (RNs) and total nursing staff. Ratings are adjusted based on the level of care residents require and are compared to state and national benchmarks.
▼ 75.0% Below HI avg. ▼ 75.0% Below HI avg.HI average: 4.0Click the badge to see the full State ranking.Click here to see the full State ranking.
Quality Measures Info Based on clinical and physical health indicators reported to CMS, such as hospital readmissions, falls, pressure ulcers, and improvements in mobility. These measures reflect how well residents' health needs are being managed.
▲ 18.5% Above HI avg. ▲ 18.5% Above HI avg.HI average: 4.2Click the badge to see the full State ranking.Click here to see the full State ranking.

Staffing hours breakdown

Info Daily nursing hours per resident by staff type, reported to CMS. Higher is generally better — compare this facility to state and national averages to see where staffing stands.

Hours per resident per day — compared to Hawaii state averages

Total nursing care / resident Info This home is ranked 16th out of 33 homes in Hawaii for nurse hours. Total adjusted nursing hours per resident per day, combining RN, LPN, and aide time. CMS adjusts this for case-mix so facilities can be fairly compared.
4h 11m per day
Rank #16 / 33Nurse hours — State benchmarkedThis home is ranked 16th out of 33 homes in Hawaii. Shows adjusted nurse hours per resident per day benchmarked to the Hawaii average, with a ranking across 33 Hawaii facilities. More hours mean more direct care. The national average is about 3.5 hrs; below 3.0 is a red flag.Rankings are based only on facilities in Hawaii that report data for that category. Facilities without available data are excluded from the ranking.Click the rank badge to see the full State ranking.Click here to see the full State ranking.
This facility Hawaii avg (4h 12m per day)
vs Hawaii avg
+0%

5 of 6 metrics below state avg

Standout metric Physical Therapist is +39% above state avg
Staff typeHours / Day / Residentvs state avg
Registered Nurse (RN) Info RNs hold the highest nursing license and can assess residents, interpret test results, and direct care plans. More RN hours per day often signals stronger clinical oversight and faster response to health changes. 6m per day ▼ 94% State avg: 1h 38m per day · National avg: 41m per day
LPN / LVN Info Licensed Practical Nurses (LPNs) or Licensed Vocational Nurses (LVNs) deliver routine hands-on care — medication administration, wound dressing, and monitoring vital signs. They work under RN supervision and make up a large share of daily bedside care. 6m per day ▼ 73% State avg: 21m per day · National avg: 52m per day
Nurse Aide Info Certified Nurse Aides (CNAs) provide the most direct day-to-day assistance: bathing, dressing, feeding, and mobility. Nurse aide hours are typically the largest staffing category and directly affect residents' quality of life. 24m per day ▼ 85% State avg: 2h 44m per day · National avg: 2h 21m per day
Weekend Total Nursing Info Combined nursing hours (RN + LPN + Nurse Aide) per resident per day on weekends. Staffing often drops on weekends — this figure reveals whether the facility maintains adequate coverage outside of weekday hours. 31m per day ▼ 87% State avg: 4h 11m per day · National avg: 3h 26m per day
Physical Therapist Info Hours per resident per day provided by licensed Physical Therapists (PTs) or PT Assistants. PT services help residents recover mobility after injury or illness and are especially important for post-acute (short-stay) rehabilitation. 7m per day ▲ 39% State avg: 5m per day · National avg: 4m per day
Weekend RN Info Registered nurse hours specifically on weekends. Facilities sometimes reduce RN presence on Saturdays and Sundays — a low weekend RN figure compared to weekday hours can indicate reduced clinical oversight when most administrative staff are absent. 5m per day ▼ 93% State avg: 1h 14m per day · National avg: 29m per day

Capacity and availability

This home usually has limited availability

Higher occupancy than the Hawaii average: 74.2%
Occupancy rate
87.7% Rank #8 / 28Occupancy rate — State benchmarkedThis home is ranked 8th out of 28 homes in Hawaii. Shows this facility's occupancy rate versus the Hawaii average, with its Statewide rank out of 28. Higher occupancy signals strong local demand and financial stability.Rankings are based only on facilities in Hawaii that report data for that category. Facilities without available data are excluded from the ranking.Click the rank badge to see the full State ranking.Click here to see the full State ranking.
Avg. Length of Stay
73 days
Bed community size
100-bed community Rank #13 / 87Bed count — State benchmarkedThis home is ranked 13th out of 87 homes in Hawaii. Shows this facility's certified or reported bed count compared to other Hawaii facilities. Larger communities may offer more amenities, programs, and on-site services for residents and families.Rankings are based only on facilities in Hawaii that report data for that category. Facilities without available data are excluded from the ranking.Click the rank badge to see the full State ranking.Click here to see the full State ranking.
A larger shared setting that may offer more common spaces and organized community services.
Walk Score
Walk Score: 11 / 100 Rank #153 / 178Walk Score — State benchmarkedThis home is ranked 153rd out of 178 homes in Hawaii. Shows how walkable this facility's neighborhood is compared to the average Walk Score across Hawaii facilities. Higher scores benefit residents, families, and staff.Rankings are based only on facilities in Hawaii that report data for that category. Facilities without available data are excluded from the ranking.Click the rank badge to see the full State ranking.Click here to see the full State ranking.
Car-dependent. Most errands require a car, with limited nearby walkable options.

Contact Maunalani Nursing and Rehabilitation Center

Staffing Data

Reporting period: October 1 – December 31, 2025 (Q4 2025). Source: CMS Payroll-Based Journal report.

Total staff 51
Employees 1
Contractors 50
Staff to resident ratio 0.51 : 1
69% fewer staff per resident than Hawaii average
Hawaii average ratio: 1.65 : 1 Hawaii average ratio: 1.65 : 1See full Hawaii ranking
Avg staff/day 15
Average shift 7.3 hours
6% worse than Hawaii average
Hawaii average: 7.8 hours Hawaii average shift: 7.8 hoursSee full Hawaii ranking
Total staff hours (quarter) 10,115

Nursing staff breakdown

Q4 2025 · Oct 1 – Dec 31 More info This data comes from the CMS Payroll-Based Journal report covering October 1 – December 31, 2025.
Registered Nurse

Manages medical care and health needs.

RN Staff Info All 3 RN Staff are contractors. 3
Average shift length Info Average shift length. Calculated as total hours divided by days worked and average staff per day. 8.9 hours
Licensed Practical Nurse

Assists with medical care and medications.

LPN Staff Info All 4 LPN Staff are contractors. 4
Average shift length Info Average shift length. Calculated as total hours divided by days worked and average staff per day. 8.8 hours
Certified Nursing Assistant

Helps with daily care and mobility.

CNA Staff Info All 16 CNA Staff are contractors. 16
Average shift length Info Average shift length. Calculated as total hours divided by days worked and average staff per day. 7.9 hours

Contractor staffing

Q4 2025 · Oct 1 – Dec 31 More info This data comes from the CMS Payroll-Based Journal report covering October 1 – December 31, 2025.

Total hours from contractors

98.7%

9,983 contractor hours this quarter

Certified Nursing Assistant: 16 Respiratory Therapy Technician: 7 Physical Therapy Assistant: 6 Speech Language Pathologist: 6 Physical Therapy Aide: 5 Licensed Practical Nurse: 4 Registered Nurse: 3 Qualified Social Worker: 3

Staff by category

Q4 2025 · Oct 1 – Dec 31 More info This data comes from the CMS Payroll-Based Journal report covering October 1 – December 31, 2025.
Certified Nursing Assistant016163,34992100%7.9
Physical Therapy Aide0551,4147177%8.1
Speech Language Pathologist0661,1707278%7
Respiratory Therapy Technician0779577784%7.5
Physical Therapy Assistant0668487784%6.1
Registered Nurse0338336368%8.9
Licensed Practical Nurse0447856672%8.8
Qualified Social Worker0336276672%7.9
Medical Director1011326672%2
16 Certified Nursing Assistant
% of Days 100%
5 Physical Therapy Aide
% of Days 77%
6 Speech Language Pathologist
% of Days 78%
7 Respiratory Therapy Technician
% of Days 84%
6 Physical Therapy Assistant
% of Days 84%
3 Registered Nurse
% of Days 68%
4 Licensed Practical Nurse
% of Days 72%
3 Qualified Social Worker
% of Days 72%
1 Medical Director
% of Days 72%

Penalties and fines

Includes penalties issued in 2024-2025

Federal penalties imposed by CMS for regulatory violations, including civil money penalties (fines) and denials of payment for new Medicare/Medicaid admissions.

Source: CMS Penalties Database (Data as of Jan 2026)

Total fines amount $32K Rank #28 / 34Federal fines — State benchmarkedThis home is ranked 28th out of 34 homes in Hawaii. Shows this facility's cumulative CMS federal fine dollars versus the Hawaii average among facilities with fines, and where it ranks among 34 facilities in the pool. Lower total dollars mean a better rank.Rankings are based only on facilities in Hawaii that report data for that category. Facilities without available data are excluded from the ranking.Click the rank badge to see the full State ranking.Click here to see the full State ranking.
15% lower than Hawaii average

Hawaii average: $38K

Number of fines 2
32% more fines than Hawaii average

Hawaii average: 1.5

Payment Denials Info Serious action where Medicare and/or Medicaid temporarily stops payments for new residents until issues are fixed. 0
100% fewer payment denials than Hawaii average

Hawaii average: 0.1

Fines amount comparison
This facility $32K
Hawaii average $38K
Penalty History

Penalties are imposed by CMS for violations of federal nursing home regulations.

2 penalties in the past 3 years

Multiple penalties were reported in the last 3 years.

Civil Money Penalty Info Fines imposed for noncompliance, which can be assessed per day or per instance of violation. Aug 14, 2025
$24K
Civil Money Penalty Info Fines imposed for noncompliance, which can be assessed per day or per instance of violation. Oct 18, 2024
$8K

Last updated: Jan 2026

Quality of care over time

These measures show how residents usually do over time at this home, based on health outcomes and preventive care.

High-risk clinical events score Info A composite score based on pressure ulcers, falls with injury, weight loss, walking ability decline, and activities of daily living decline. 12.6
23% worse than Hawaii average

Hawaii average: 10.2

Functional decline score Info A composite score based on activities of daily living decline, walking ability decline, and incontinence. 22.7
14% worse than Hawaii average

Hawaii average: 20.0

Long-stay resident measures
Above average Hawaii avg: 4.4 Info CMS star rating based on long-stay quality measure performance. 5 stars = significantly above average, 1 star = significantly below average.
Need for Help with Daily Activities Increased Info Percent of long-stay residents whose need for help with daily activities has increased 17.7%
In line with Hawaii average

Hawaii average: 17.6%

Walking Ability Worsened Info Percent of long-stay residents whose ability to move independently worsened 29.3%
13% worse than Hawaii average

Hawaii average: 25.8%

Low Risk Residents with Bowel/Bladder Incontinence Info Percent of low risk long-stay residents who lose control of their bowels or bladder 21.3%
16% worse than Hawaii average

Hawaii average: 18.3%

Falls with Major Injury Info Percent of long-stay residents experiencing one or more falls with major injury 3.9%
83% worse than Hawaii average

Hawaii average: 2.1%

High Risk Residents with Pressure Ulcers Info Percent of long-stay high risk residents with pressure ulcers 3.8%
In line with Hawaii average

Hawaii average: 3.6%

Urinary Tract Infection Info Percent of long-stay residents with a urinary tract infection 4.8%
99% worse than Hawaii average

Hawaii average: 2.4%

Lost Too Much Weight Info Percent of long-stay residents who lose too much weight 8.1%
72% worse than Hawaii average

Hawaii average: 4.7%

Depressive Symptoms Info Percent of long-stay residents who have depressive symptoms 0.5%
66% better than Hawaii average

Hawaii average: 1.5%

Antipsychotic Use Info Percent of long-stay residents who received an antipsychotic medication 7.5%
26% better than Hawaii average

Hawaii average: 10.1%

Pneumococcal Vaccine Info Percent of long-stay residents assessed and appropriately given the pneumococcal vaccine 98.7%
In line with Hawaii average

Hawaii average: 96.3%

Influenza Vaccine Info Percent of long-stay residents assessed and appropriately given the seasonal influenza vaccine 100.0%
5% better than Hawaii average

Hawaii average: 95.4%

Hospitalizations per 1,000 days Info Number of hospitalizations per 1,000 long-stay resident days. 1.46
9% worse than Hawaii average

Hawaii average: 1.34

ED visits per 1,000 days Info Number of outpatient emergency department visits per 1,000 long-stay resident days. 0.80
10% better than Hawaii average

Hawaii average: 0.89

Short-stay resident measures
Above average Hawaii avg: 3.0 Info CMS star rating based on short-stay quality measure performance. 5 stars = much above average, 1 star = much below average.
Pneumococcal Vaccine Info Percent of short-stay residents assessed and appropriately given the pneumococcal vaccine 90.5%
9% better than Hawaii average

Hawaii average: 83.4%

Antipsychotic medication increase Info Percent of short-stay residents who newly received an antipsychotic medication 0.9%
20% better than Hawaii average

Hawaii average: 1.2%

Influenza Vaccine Info Percent of short-stay residents assessed and appropriately given the seasonal influenza vaccine 90.7%
7% better than Hawaii average

Hawaii average: 84.7%

Re-hospitalized after SNF stay Info Percentage of short-stay residents who were re-hospitalized after their nursing home admission. 22.6%
15% worse than Hawaii average

Hawaii average: 19.6%

Emergency department visits Info Percentage of short-stay residents who had an outpatient emergency department visit. 5.3%
51% better than Hawaii average

Hawaii average: 10.9%

Falls with major injury Info Percentage of SNF residents who experience falls with major injury during their stay. 0.6%
22% better than Hawaii average

Hawaii average: 0.8%

Ability to care for self at discharge Info Percentage of residents at or above expected ability to care for themselves at discharge. 23.5%
56% worse than Hawaii average

Hawaii average: 53.7%

Successful return to home or community Info Rate of successful return to home or community from a skilled nursing facility. 73.0%
44% better than Hawaii average

Hawaii average: 50.6%

Breakdown by payment type

Medicare

37% of new residents, usually for short-term rehab.

Typical stay 24 days

Private pay

61% of new residents, often for short stays.

Typical stay 3 - 4 months

Medicaid

2% of new residents, often for long-term daily care.

Typical stay 8 - 9 months

Facility Characteristics

Source: CMS Long-Term Care Facility Characteristics (Data as of Jan 2026)

Total residents 100
Medicare
41
41% of residents
Medicaid
59
59% of residents
Programs & Services
Residents Group

Residents meet regularly to discuss policies, care quality, and activities

Family Member Group

Family members meet regularly to discuss policies, care quality, and activities

Nurse Aide Training

State-approved Nurse Aide Training and Competency Evaluation Program on-site

Active Family Council

Organized group of family members that meets regularly to discuss facility policies, resident care, and activities.

Active Resident Council

Organized group of residents that meets regularly to discuss facility policies, quality of life, and activities.

Finances and operations

Based on CMS SNF Cost Report for fiscal year ending in 06/2024.

Nonprofit
Other Nonprofit
Net patient revenue Info Net patient revenue — what the home actually collects for resident care, after contractual allowances, bad debt and discounts are subtracted from its gross charges (CMS cost report, Worksheet G-3). It covers resident care only; money the home earns from other sources is shown separately as "Other income."
$18.6M
Net patient income Info Net patient income: net patient revenue minus the home's total operating expenses. A positive figure means it earns more from resident care than it spends to deliver it; a negative figure means the opposite. It excludes non-operating "other income."
-$1.3M
Nonprofit Other Nonprofit
Net patient revenue Info Net patient revenue — what the home actually collects for resident care, after contractual allowances, bad debt and discounts are subtracted from its gross charges (CMS cost report, Worksheet G-3). It covers resident care only; money the home earns from other sources is shown separately as "Other income."
$18.6M Rank #11 / 29Revenue — State benchmarkedThis home is ranked 11th out of 29 homes in Hawaii. Shows this facility's annual revenue compared to the Hawaii average. Higher revenue generally means more resources for staffing and capital — read alongside Payroll %.Rankings are based only on facilities in Hawaii that report data for that category. Facilities without available data are excluded from the ranking.Click the rank badge to see the full State ranking.Click here to see the full State ranking.
Net patient income Info Net patient income: net patient revenue minus the home's total operating expenses. A positive figure means it earns more from resident care than it spends to deliver it; a negative figure means the opposite. It excludes non-operating "other income."
-$1.3M
Other income Info Money the home earns outside of resident care — such as investments, grants, rentals and other non-operating sources (CMS cost report, Worksheet G-3). It is tracked separately from net patient revenue: it is not part of that figure, and it is not included in net patient income.
$1.6M
Payroll costs Info Staff salaries plus wage-related costs — benefits such as payroll taxes, health insurance and retirement — from the home's own accounting records (CMS cost report, Worksheet A). Contract or agency labor is counted separately, under other operating costs. Rank #7 / 29Payroll — State benchmarkedThis home is ranked 7th out of 29 homes in Hawaii. Shows total annual staff payroll benchmarked to the Hawaii average. Higher payroll investment relative to peers often signals better staffing and less reliance on cheaper contract labor.Rankings are based only on facilities in Hawaii that report data for that category. Facilities without available data are excluded from the ranking.Click the rank badge to see the full State ranking.Click here to see the full State ranking.
$10.4M 56% of net patient revenue Info Payroll as a share of revenue: staff salaries and wage-related benefits divided by net patient revenue. A higher figure means more of each revenue dollar goes to staff pay. Rank #7 / 29Payroll % — State benchmarkedThis home is ranked 7th out of 29 homes in Hawaii. Shows payroll as a percentage of revenue versus the Hawaii average. Well-run Hawaii facilities typically land around 52–61% — the top third Statewide. Below 25% may signal understaffing or heavy agency use — read with Staffing ratings.Rankings are based only on facilities in Hawaii that report data for that category. Facilities without available data are excluded from the ranking.Click the rank badge to see the full State ranking.Click here to see the full State ranking.
Other operating costs Info Everything it costs to run the home apart from payroll — food, utilities, supplies, maintenance, contract labor and administration. Calculated as total operating expense minus payroll (staff salaries and wage-related benefits).
$9.5M
Total costs Info The home's total operating expense for the year — all the costs of running it, salaries included (CMS cost report, Worksheet G-3).
$19.9M

Who this home usually serves

TYPE OF STAY

Primarily short stays

Residents typically stay for brief periods, with frequent admissions and discharges throughout the year.

Most new residents arrive under private pay (61% of admissions), and a typical private pay stay runs around 3 - 4 months.

Admissions
410 total

Coverage residents most often arrive under.

Medicare 37%
Private pay 61%
Medicaid 2%
Discharges
440 total

Coverage residents most often leave under.

Medicare 29%
Private pay 70%
Medicaid 1%

Managed by Elaine P. Johnson

Administrator

Elaine P. Johnson was Maunalani Nursing and Rehabilitation Center’s first administrator, setting the foundation and pace for the community since it opened in 1950. Her leadership helped shape the facility’s commitment to compassionate senior care, establishing a lasting legacy that continues to influence Maunalani’s mission and culture today.

Places of interest near Maunalani Nursing and Rehabilitation Center

Address 4.5 miles from city center Info Estimated distance in miles from Honolulu's city center to Maunalani Nursing and Rehabilitation Center's address, calculated via Google Maps. — 1.86 miles to nearest hospital (Lu0113u02bbahi Hospital)

Calculate Travel Distance to Maunalani Nursing and Rehabilitation Center

Add your location

Address

Compare Nursing Homes around Honolulu

The information below is reported by the Hawaii Department of Health, Office of Health Care Assurance.

5 facilities compared · CMS & HI Dept. of Health data

15 Craigside
NH
ADC
AL
HC
IL
Honolulu (Nuuanu - Punchbowl)
45
Facility 45
HI AVG 43
Rank #26 / 87
97.7%
Facility 97.7%
HI AVG 74.2%
Rank #2 / 28
+32%
5.04
Facility 5.04
HI AVG 4.20
Rank #8 / 33
+1%+20%
$0
Facility $0
HI AVG $43.4k
Rank #1 / 34
5
Facility 5
HI AVG 35.5
Rank #1 / 34
2.5
Facility 2.5
HI AVG 8.2
Rank #1 / 34
-45A+
50
Facility 50
HI AVG 49
Rank #85 / 178
Bree Komagome
$7.7M
Facility $7.7M
HI AVG $20.8M
Rank #27 / 29
$5.2M
Facility $5.2M
HI AVG $7.1M
Rank #24 / 29
67.8%
Facility 67.8%
HI AVG 38.9%
Rank #1 / 29
125063
Maunalani Nursing and Rehabilitation Center
NH
NC
PC
Honolulu (Kaimuki)
100
Facility 100
HI AVG 43
Rank #13 / 87
87.7%
Facility 87.7%
HI AVG 74.2%
Rank #8 / 28
+18%
4.19
Facility 4.19
HI AVG 4.20
Rank #16 / 33
-71%0%
$32.1k
Facility $32.1k
HI AVG $43.4k
Rank #28 / 34
21
Facility 21
HI AVG 35.5
Rank #4 / 34
4.2
Facility 4.2
HI AVG 8.2
Rank #4 / 34
290-
11
Facility 11
HI AVG 49
Rank #153 / 178
The Maunalani Foundation
$18.6M
Facility $18.6M
HI AVG $20.8M
Rank #11 / 29
$10.4M
Facility $10.4M
HI AVG $7.1M
Rank #7 / 29
56%
Facility 56%
HI AVG 38.9%
Rank #7 / 29
125013
Arcadia Retirement Residence
NH
ADC
HC
IL
NC
Honolulu (Makiki/Lower/ Punchbowl/Tantalus)
91
Facility 91
HI AVG 43
Rank #18 / 87
84.3%
Facility 84.3%
HI AVG 74.2%
Rank #10 / 28
+14%
5.08
Facility 5.08
HI AVG 4.20
Rank #7 / 33
+26%+21%
$12.9k
Facility $12.9k
HI AVG $43.4k
Rank #23 / 34
36
Facility 36
HI AVG 35.5
Rank #19 / 34
9.0
Facility 9.0
HI AVG 8.2
Rank #27 / 34
285A+
86
Facility 86
HI AVG 49
Rank #27 / 178
Kathleen Yokouchi
$14.6M
Facility $14.6M
HI AVG $20.8M
Rank #14 / 29
$7.5M
Facility $7.5M
HI AVG $7.1M
Rank #11 / 29
51.1%
Facility 51.1%
HI AVG 38.9%
Rank #11 / 29
125014
Kalākaua Gardens
NH
AL
IL
MC
RC
Honolulu (Ala Moana)
49
Facility 49
HI AVG 43
Rank #24 / 87
71.4%
Facility 71.4%
HI AVG 74.2%
Rank #20 / 28
-4%
0.37
Facility 0.37
HI AVG 4.20
Rank #33 / 33
-3%-91%
$55.7k
Facility $55.7k
HI AVG $43.4k
Rank #30 / 34
35
Facility 35
HI AVG 35.5
Rank #18 / 34
5.8
Facility 5.8
HI AVG 8.2
Rank #10 / 34
342-
98
Facility 98
HI AVG 49
Rank #3 / 178
1723 Kalakaua LLC
$21.3M
Facility $21.3M
HI AVG $20.8M
Rank #10 / 29
$9.5M
Facility $9.5M
HI AVG $7.1M
Rank #8 / 29
44.8%
Facility 44.8%
HI AVG 38.9%
Rank #16 / 29
125066
Avalon Care Center – Honolulu
NH
Honolulu (Kalihi Valley)
108
Facility 108
HI AVG 43
Rank #10 / 87
90.4%
Facility 90.4%
HI AVG 74.2%
Rank #7 / 28
+22%
4.06
Facility 4.06
HI AVG 4.20
Rank #17 / 33
+24%-3%
$0
Facility $0
HI AVG $43.4k
Rank #1 / 34
53
Facility 53
HI AVG 35.5
Rank #31 / 34
17.7
Facility 17.7
HI AVG 8.2
Rank #34 / 34
-96A+
47
Facility 47
HI AVG 49
Rank #93 / 178
Avalon Of Hawaii LLC
$22.2M
Facility $22.2M
HI AVG $20.8M
Rank #7 / 29
$10.7M
Facility $10.7M
HI AVG $7.1M
Rank #6 / 29
48.4%
Facility 48.4%
HI AVG 38.9%
Rank #23 / 29
125020

Financial Assistance for
Nursing Home in Hawaii

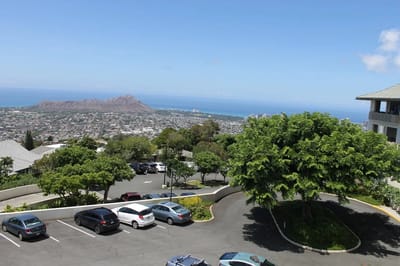
Maunalani Nursing and Rehabilitation Center is located in Honolulu, Hawaii.
Here are the financial assistance programs available to residents in Hawaii.

Get Financial aid guidance

QUEST Integration

Hawaii Medicaid QUEST Integration

Age 65+ or disabled
General Hawaii resident, Medicaid-eligible, long-term care need.
Income Limits (2025) ~$2,829/month 300% FBR, individual
Asset Limits $2,000 (individual), $3,000 (couple).
HI

High cost of living adjustments.

Benefits
In-home care (6-8 hours/day) Nursing home Respite (240 hours/year) Medical services

Kupuna Care

Hawaii Kupuna Care

Age 60+
General Hawaii resident, unable to perform 2+ ADLs.
Income Limits No strict limit; prioritizes low-income.
Asset Limits Not applicable.
HI

Limited funding; island-specific delivery.

Benefits
In-home care (3-5 hours/week) Adult day care (~$70/day) Transportation (~5 trips/month)

Program of All-Inclusive Care for the Elderly (PACE)

Hawaii Medicaid PACE

Age 55+
General Hawaii resident, nursing home-level care need, safe with PACE support.
Income Limits (2025) ~$2,829/month 300% FBR
Asset Limits $2,000 (individual), $3,000 (couple).
HI

Limited to Oahu (e.g., Maluhia in Honolulu); few providers.

Benefits
Personal care (5-7 hours/day) Medical care Meals Transportation Therapy Respite

Medicare Savings Program (MSP)

Hawaii Medicare Savings Program

Age 65+ or disabled
General Hawaii resident, Medicare Part A/B.
Income Limits (2025) ~$2,510/month (QMB), ~$3,380/month (SLMB), ~$3,598/month (QI)—individual, adjusted annually.
Asset Limits $9,430 (individual), $14,130 (couple).
HI

Three tiers; no waitlist.

Benefits
Covers Part B premiums ($174.70/month) Deductibles ($240/year) Copays (~20%)

National Family Caregiver Support Program (NFCSP) Respite

Hawaii NFCSP Respite Care

Age
General Caregivers of 60+ needing care or 55+ caregivers of others; Hawaii resident; functional needs (2+ ADLs).
Income Limits (2025) Prioritizes ~$24,980/year (individual); no strict cap.
Asset Limits Not assessed; need-based.
HI

Four county AAAs; prioritizes low-income.

Benefits
Respite (4-6 hours/week or 5 days/year) Adult day care ($80/day) Counseling

VA Aid and Attendance (A&A) and Housebound Benefits

Hawaii VA Aid and Attendance/Housebound

Age 65+ or disabled veteran/surviving spouse
General Hawaii resident, wartime service, need for aid with ADLs (A&A) or homebound status.
Income Limits (2025) Net income < ~$1,984/month (veteran with dependent, A&A); pension offsets income.
Asset Limits ~$155,356 2025 net worth limit
HI

Applies statewide; high demand due to veteran population.

Benefits
Cash (~$1,433-$2,642/month veteran, ~$951-$1,318 spouse) for care costs (e.g., in-home, assisted living)

Senior Companion Program (SCP)

Hawaii Senior Companion Program

Age
General Volunteers: 55+, low-income, Hawaii resident, able to work 20 hours/week. Recipients: Frail elders needing companionship.
Income Limits (2025) Volunteers: ~$24,980/year (200% FPL); recipients: no limit.
Asset Limits Not specified for volunteers; need-based for recipients.
HI

Statewide; managed by DHS Social Services.

Benefits
Volunteers paid ~$4/hour for companionship (~20 hours/week); recipients get free support (~4-6 hours/week)

Frequently Asked Questions about Maunalani Nursing and Rehabilitation Center

What neighborhood is Maunalani Nursing and Rehabilitation Center in?

Maunalani Nursing and Rehabilitation Center is in the Kaimuki neighborhood.

Is Maunalani Nursing and Rehabilitation Center in a walkable area?

Maunalani Nursing and Rehabilitation Center has a walk score of 11. Car-dependent. Most errands require a car, with limited nearby walkable options.

What is the occupancy rate at Maunalani Nursing and Rehabilitation Center?

Maunalani Nursing and Rehabilitation Center's occupancy is 87.7%.

Does Maunalani Nursing and Rehabilitation Center operate as a for-profit or non-profit?

Maunalani Nursing and Rehabilitation Center is registered as a non-profit.

Are there photos of Maunalani Nursing and Rehabilitation Center?

Yes — there are 6 photos of Maunalani Nursing and Rehabilitation Center in the photo gallery on this page.

What is the address of Maunalani Nursing and Rehabilitation Center?

Maunalani Nursing and Rehabilitation Center is located at 5113 Maunalani Cir, Honolulu, HI 96816.

What is the phone number of Maunalani Nursing and Rehabilitation Center?

(808) 732-0771 will put you in contact with the team at Maunalani Nursing and Rehabilitation Center.

Guides for Better Senior Living

Care Cost Calculator: See Prices in Your Area

Nursing Home Data Explorer

Don’t Wait Too Long: 7 Red Flag Signs Your Parent Needs Assisted Living Now

The True Cost of Assisted Living in 2025 – And How Families Are Paying For It

Understanding Senior Living Costs: Pricing Models, Discounts & Financial Assistance