Avalon Care Center – Honolulu
CMS overall rating Info CMS (the Centers for Medicare & Medicaid Services) is the federal agency that rates nursing home quality. Its Overall Rating runs from 1 to 5 stars, combining health inspections, staffing, and quality measures, with inspections weighted most heavily.

Avalon Care Center – Honolulu

CMS overall rating Info CMS (the Centers for Medicare & Medicaid Services) is the federal agency that rates nursing home quality. Its Overall Rating runs from 1 to 5 stars, combining health inspections, staffing, and quality measures, with inspections weighted most heavily.
Calculator: See prices in your area
Avalon Care Center – Honolulu accepts Medicare, Medicaid, and private pay.

Overview of Avalon Care Center – Honolulu

For the past three decades, Avalon Health Care in Honolulu has been showing an unwavering commitment to providing top-notch healthcare services. It has been a source of solace and comfort to patients and residents alike. With a wide array of programs that cater to different needs, including Long-Term Care, Skilled Nursing, Rehabilitation, Memory Care, Assisted Living, Senior Living, Independent Living, and Healthcare, Avalon Health Care has proven to be a reliable partner in health and wellness.
Their services are exceptional, ranging from skilled nursing and assisted living to hospice/home health, therapy services, physicians/medical providers, and care coordination services. This comprehensive approach to healthcare ensures that patients and residents receive the best possible care and assistance with daily living. In Hawaii’s serene and calming environment, Avalon Health Care’s compassionate and dedicated team of healthcare professionals have made it their life’s work to provide excellent care while preserving the dignity and independence of their patients and residents.

Quality ratings

Measured by Centers for Medicare & Medicaid Services (CMS)

Overall rating Info The Overall CMS Rating combines results from health inspections, staffing levels and quality measures. Health inspections carry the most weight. Staffing and quality scores can increase or decrease the final rating based on performance compared to state and national standards.
▼ 12.8% Below HI avg. ▼ 12.8% Below HI avg.HI average: 3.4Click the badge to see the full State ranking.Click here to see the full State ranking.
Health Inspection Info Based on the results of the facility's three most recent standard inspections and any complaint investigations. CMS reviews the number, scope, and severity of deficiencies, with more recent findings weighted more heavily.
▼ 30.5% Below HI avg. ▼ 30.5% Below HI avg.HI average: 2.9Click the badge to see the full State ranking.Click here to see the full State ranking.
Staffing Info Measures average nursing staff hours per resident per day, including Registered Nurses (RNs) and total nursing staff. Ratings are adjusted based on the level of care residents require and are compared to state and national benchmarks.
At HI avg. At HI avg.HI average: 4.0Click the badge to see the full State ranking.Click here to see the full State ranking.
Quality Measures Info Based on clinical and physical health indicators reported to CMS, such as hospital readmissions, falls, pressure ulcers, and improvements in mobility. These measures reflect how well residents' health needs are being managed.
▲ 18.5% Above HI avg. ▲ 18.5% Above HI avg.HI average: 4.2Click the badge to see the full State ranking.Click here to see the full State ranking.

Staffing hours breakdown

Info Daily nursing hours per resident by staff type, reported to CMS. Higher is generally better — compare this facility to state and national averages to see where staffing stands.

Hours per resident per day — compared to Hawaii state averages

Total nursing care / resident Info This home is ranked 17th out of 33 homes in Hawaii for nurse hours. Total adjusted nursing hours per resident per day, combining RN, LPN, and aide time. CMS adjusts this for case-mix so facilities can be fairly compared.
4h 4m per day
Rank #17 / 33Nurse hours — State benchmarkedThis home is ranked 17th out of 33 homes in Hawaii. Shows adjusted nurse hours per resident per day benchmarked to the Hawaii average, with a ranking across 33 Hawaii facilities. More hours mean more direct care. The national average is about 3.5 hrs; below 3.0 is a red flag.Rankings are based only on facilities in Hawaii that report data for that category. Facilities without available data are excluded from the ranking.Click the rank badge to see the full State ranking.Click here to see the full State ranking.
This facility Hawaii avg (4h 12m per day)
vs Hawaii avg
-3%

2 of 6 metrics below state avg

Standout metric Physical Therapist is +91% above state avg
Staff type Hours / Day / Resident vs state avg
Registered Nurse (RN) Info RNs hold the highest nursing license and can assess residents, interpret test results, and direct care plans. More RN hours per day often signals stronger clinical oversight and faster response to health changes. 1h 51m per day ▲ 13% State avg: 1h 38m per day · National avg: 41m per day
LPN / LVN Info Licensed Practical Nurses (LPNs) or Licensed Vocational Nurses (LVNs) deliver routine hands-on care — medication administration, wound dressing, and monitoring vital signs. They work under RN supervision and make up a large share of daily bedside care. 13m per day ▼ 37% State avg: 21m per day · National avg: 52m per day
Nurse Aide Info Certified Nurse Aides (CNAs) provide the most direct day-to-day assistance: bathing, dressing, feeding, and mobility. Nurse aide hours are typically the largest staffing category and directly affect residents' quality of life. 2h 30m per day ▼ 9% State avg: 2h 44m per day · National avg: 2h 20m per day
Weekend Total Nursing Info Combined nursing hours (RN + LPN + Nurse Aide) per resident per day on weekends. Staffing often drops on weekends — this figure reveals whether the facility maintains adequate coverage outside of weekday hours. 4h 6m per day ■ Avg State avg: 4h 11m per day · National avg: 3h 26m per day
Physical Therapist Info Hours per resident per day provided by licensed Physical Therapists (PTs) or PT Assistants. PT services help residents recover mobility after injury or illness and are especially important for post-acute (short-stay) rehabilitation. 10m per day ▲ 91% State avg: 5m per day · National avg: 4m per day
Weekend RN Info Registered nurse hours specifically on weekends. Facilities sometimes reduce RN presence on Saturdays and Sundays — a low weekend RN figure compared to weekday hours can indicate reduced clinical oversight when most administrative staff are absent. 1h 22m per day ▲ 10% State avg: 1h 14m per day · National avg: 28m per day

Capacity and availability

This home usually has limited availability

Higher occupancy than the Hawaii average: 74.2%
Occupancy rate
90.4% Rank #7 / 28Occupancy rate — State benchmarkedThis home is ranked 7th out of 28 homes in Hawaii. Shows this facility's occupancy rate versus the Hawaii average, with its Statewide rank out of 28. Higher occupancy signals strong local demand and financial stability.Rankings are based only on facilities in Hawaii that report data for that category. Facilities without available data are excluded from the ranking.Click the rank badge to see the full State ranking.Click here to see the full State ranking.
Avg. Length of Stay
50 days
Bed community size
108-bed community Rank #10 / 87Bed count — State benchmarkedThis home is ranked 10th out of 87 homes in Hawaii. Shows this facility's certified or reported bed count compared to other Hawaii facilities. Larger communities may offer more amenities, programs, and on-site services for residents and families.Rankings are based only on facilities in Hawaii that report data for that category. Facilities without available data are excluded from the ranking.Click the rank badge to see the full State ranking.Click here to see the full State ranking.
A larger shared setting that may offer more common spaces and organized community services.
Years in operation
21 years in operation Rank #17 / 44Years in operation — State benchmarkedThis home is ranked 17th out of 44 homes in Hawaii. Shows how long this facility has been in operation compared to other Hawaii facilities. Longer operating histories may benefit residents, families, and staff.Rankings are based only on facilities in Hawaii that report data for that category. Facilities without available data are excluded from the ranking.Click the rank badge to see the full State ranking.Click here to see the full State ranking.
A longer operating history, which may indicate experience navigating regulations and delivering ongoing care.
Walk Score
Walk Score: 47 / 100 Rank #93 / 178Walk Score — State benchmarkedThis home is ranked 93rd out of 178 homes in Hawaii. Shows how walkable this facility's neighborhood is compared to the average Walk Score across Hawaii facilities. Higher scores benefit residents, families, and staff.Rankings are based only on facilities in Hawaii that report data for that category. Facilities without available data are excluded from the ranking.Click the rank badge to see the full State ranking.Click here to see the full State ranking.
Somewhat walkable. A few nearby services may be reachable on foot, but most trips require transportation.
BBB Rating
BBB Rating: A+ (Not Accredited)
An independent rating from the Better Business Bureau based on factors such as complaint history, transparency, and business practices.
How BBB ratings work

About this community

License Details

CMS Certification Number125020

Staffing

Key information about the people who lead and staff this community.

Leadership

ContactMr. Michael Brogan, Administrator

Therapy & Rehabilitation

1 service
Rehabilitation Services

Staffing & Medical

1 service
24-Hour Staffing

Amenities & Lifestyle

24-Hour Nursing Care
On-Site Therapy Staff
Medical Staff Coverage
Specialty Medication Systems
Avalon Transportation Network
Advanced Clinical Medical Records Systems
In-House Amenities For Post-Acute Patients
Specific Programspost-acute care

Contact Avalon Care Center – Honolulu

Inspection History

In Hawaii, the Department of Health, Office of Health Care Assurance performs regular inspections and unannounced surveys to verify that healthcare facilities maintain high standards of resident care.

Since 2023 · 3 years of data 54 deficiencies 4 inspections

Inspection Scorecard Info This scorecard compares key inspection, deficiency, and complaint metrics at this facility against the Hawaii state average. Metrics rated ≥15% worse than average are highlighted in red; those ≥15% better are highlighted in green.

Since 2023 vs. Hawaii state average
Overall vs. HI average 3 Worse Metrics worse than Hawaii average:
• Total deficiencies (116% above)
• Deficiencies per year (117% above)
• Deficiencies per inspection (114% above)
1 At Avg Metrics at Hawaii average:
• Total inspections (at HI avg)
0 Better No metrics in this bucket.
Latest Inspection April 3, 2025 Routine

Deficiencies Info Deficiencies are formal regulatory issues recorded during state inspections.

This Facility HI Average vs. HI Avg
Total deficiencies Info Formal regulatory issues recorded by inspectors across all inspection types. 54 25 This facility has 116% more total deficiencies than a typical Hawaii nursing home (54 vs. HI avg 25).↑ 116% worse
Deficiencies per year Info Average deficiencies per year since 2023. 18 8.3 This facility has 117% more deficiencies per year than a typical Hawaii nursing home (18 vs. HI avg 8.3).↑ 117% worse
Deficiencies per inspection Info Average deficiencies per inspection. 13.5 6.3 This facility has 114% more deficiencies per inspection than a typical Hawaii nursing home (13.5 vs. HI avg 6.3).↑ 114% worse

Inspections Info State inspections evaluate whether the facility meets health and safety standards.

This Facility HI Average vs. HI Avg
Total inspections Info Combined count of all routine and focused inspections. Excludes complaint investigations. 4 4 This facility has total inspections in line with the Hawaii average (4 vs. HI avg 4).— At avg

Health Inspection History

Inspections since 2023
Total health inspections 3

Hawaii average 4.4


Last Health inspection on Apr 2025

Total health citations
53 Rank #31 / 34Health citations — State benchmarkedThis home is ranked 31st out of 34 homes in Hawaii. Shows this facility's total health deficiency citations benchmarked to the Hawaii State average, with a ranking across all 34 HI facilities. Lower citation counts earn a better rank.Rankings are based only on facilities in Hawaii that report data for that category. Facilities without available data are excluded from the ranking.Click the rank badge to see the full State ranking.Click here to see the full State ranking.

Hawaii average 35.5

Citations per inspection
17.67 Rank #34 / 34Citations per inspection — State benchmarkedThis home is ranked 34th out of 34 homes in Hawaii. Shows average deficiency citations per CMS inspection for this facility versus the Hawaii mean across 34 facilities with citation data. Lower is better.Rankings are based only on facilities in Hawaii that report data for that category. Facilities without available data are excluded from the ranking.Click the rank badge to see the full State ranking.Click here to see the full State ranking.

Hawaii average 8.23


Health citations are formal notices following inspections when they fail to comply with safety and care standards.

51 of 53 citations resulted from standard inspections; and 2 of 53 came from combined inspections (standard and complaint).

Breakdown of citation severity (last 3 years)
Critical health citations
0
100% better than Hawaii average

Hawaii average: 0.1


Serious health citations
0
100% better than Hawaii average

Hawaii average: 1

0 critical citations Hawaii average: 0.1

0 serious citations Hawaii average: 1

53 moderate citations Hawaii average: 34.2

0 minor citations Hawaii average: 0.1
Citations history (last 3 years)
Infection Control moderate citation Apr 03, 2025
Corrected

Nursing Services moderate citation Apr 03, 2025
Corrected

Pharmacy moderate citation Apr 03, 2025
Corrected

Pharmacy moderate citation Apr 03, 2025
Corrected

Staffing Data

Reporting period: October 1 – December 31, 2025 (Q4 2025). Source: CMS Payroll-Based Journal report.

Total staff 157
Employees 129
Contractors 28
Staff to resident ratio 1.65 : 1
0% compared with Hawaii average
Hawaii average ratio: 1.65 : 1 Hawaii average ratio: 1.65 : 1See full Hawaii ranking
Avg staff/day 68
Average shift 7.8 hours
0% compared with Hawaii average
Hawaii average: 7.8 hours Hawaii average shift: 7.8 hoursSee full Hawaii ranking
Total staff hours (quarter) 48,714

Nursing staff breakdown

Q4 2025 · Oct 1 – Dec 31 More info This data comes from the CMS Payroll-Based Journal report covering October 1 – December 31, 2025.
Registered Nurse

Manages medical care and health needs.

RN Staff Info All 40 RN Staff are full-time employees. No contractors work on this role. 40
Average shift length Info Average shift length. Calculated as total hours divided by days worked and average staff per day. 7.6 hours
Licensed Practical Nurse

Assists with medical care and medications.

LPN Staff Info All 4 LPN Staff are full-time employees. No contractors work on this role. 4
Average shift length Info Average shift length. Calculated as total hours divided by days worked and average staff per day. 7.5 hours
Certified Nursing Assistant

Helps with daily care and mobility.

CNA Staff Info 65 total: 58 full-time employees and 7 contractors. 65
Average shift length Info Average shift length. Calculated as total hours divided by days worked and average staff per day. 8 hours

Contractor staffing

Q4 2025 · Oct 1 – Dec 31 More info This data comes from the CMS Payroll-Based Journal report covering October 1 – December 31, 2025.

Total hours from contractors

10.8%

5,239 contractor hours this quarter

Certified Nursing Assistant: 7 Physical Therapy Aide: 5 Speech Language Pathologist: 5 Respiratory Therapy Technician: 4 Qualified Social Worker: 4 Physical Therapy Assistant: 3

Staff by category

Q4 2025 · Oct 1 – Dec 31 More info This data comes from the CMS Payroll-Based Journal report covering October 1 – December 31, 2025.
Certified Nursing Assistant 58 7 65 20,977 92 100% 8
Registered Nurse 40 0 40 12,851 92 100% 7.6
Clinical Nurse Specialist 9 0 9 3,123 78 85% 7.7
Licensed Practical Nurse 4 0 4 1,543 90 98% 7.5
Respiratory Therapy Technician 0 4 4 1,407 81 88% 8.3
Nurse Aide in Training 5 0 5 1,089 87 95% 6.8
Other Dietary Services Staff 3 0 3 992 92 100% 7.5
Speech Language Pathologist 0 5 5 942 84 91% 7.5
Physical Therapy Assistant 0 3 3 941 83 90% 7.2
Physical Therapy Aide 0 5 5 919 92 100% 7
Dental Services Staff 2 0 2 843 63 68% 7.9
Occupational Therapy Aide 3 0 3 535 69 75% 6.9
Mental Health Service Worker 1 0 1 472 59 64% 8
Dietitian 1 0 1 460 58 63% 7.9
Qualified Social Worker 0 4 4 434 58 63% 6.9
Administrator 1 0 1 428 54 59% 7.9
RN Director of Nursing 1 0 1 416 52 57% 8
Nurse Practitioner 1 0 1 344 43 47% 8
65 Certified Nursing Assistant
% of Days 100%
40 Registered Nurse
% of Days 100%
9 Clinical Nurse Specialist
% of Days 85%
4 Licensed Practical Nurse
% of Days 98%
4 Respiratory Therapy Technician
% of Days 88%
5 Nurse Aide in Training
% of Days 95%
3 Other Dietary Services Staff
% of Days 100%
5 Speech Language Pathologist
% of Days 91%
3 Physical Therapy Assistant
% of Days 90%
5 Physical Therapy Aide
% of Days 100%
2 Dental Services Staff
% of Days 68%
3 Occupational Therapy Aide
% of Days 75%
1 Mental Health Service Worker
% of Days 64%
1 Dietitian
% of Days 63%
4 Qualified Social Worker
% of Days 63%
1 Administrator
% of Days 59%
1 RN Director of Nursing
% of Days 57%
1 Nurse Practitioner
% of Days 47%

Penalties and fines

Federal penalties imposed by CMS for regulatory violations, including civil money penalties (fines) and denials of payment for new Medicare/Medicaid admissions.

Source: CMS Penalties Database (Data as of Jan 2026)

Total fines amount $13K Rank #1 / 34Federal fines — State benchmarkedThis home is ranked 1st out of 34 homes in Hawaii. Shows this facility's cumulative CMS federal fine dollars versus the Hawaii average among facilities with fines, and where it ranks among 34 facilities in the pool. Lower total dollars mean a better rank.Rankings are based only on facilities in Hawaii that report data for that category. Facilities without available data are excluded from the ranking.Click the rank badge to see the full State ranking.Click here to see the full State ranking.
66% lower than Hawaii average

Hawaii average: $38K

Number of fines 1
34% fewer fines than Hawaii average

Hawaii average: 1.5

Payment Denials Info Serious action where Medicare and/or Medicaid temporarily stops payments for new residents until issues are fixed. 0
100% fewer payment denials than Hawaii average

Hawaii average: 0.1

Fines amount comparison
This facility $13K
Hawaii average $38K

No penalties in the past 3 years

No civil money penalties or payment denials were reported in the last 3 years.

Quality of care over time

These measures show how residents usually do over time at this home, based on health outcomes and preventive care.

High-risk clinical events score Info A composite score based on pressure ulcers, falls with injury, weight loss, walking ability decline, and activities of daily living decline. 12.1
19% worse than Hawaii average

Hawaii average: 10.2

Functional decline score Info A composite score based on activities of daily living decline, walking ability decline, and incontinence. 22.7
14% worse than Hawaii average

Hawaii average: 20.0

Long-stay resident measures
Significantly above average Hawaii avg: 4.4 Info CMS star rating based on long-stay quality measure performance. 5 stars = significantly above average, 1 star = significantly below average.
Need for Help with Daily Activities Increased Info Percent of long-stay residents whose need for help with daily activities has increased 12.7%
28% better than Hawaii average

Hawaii average: 17.6%

Walking Ability Worsened Info Percent of long-stay residents whose ability to move independently worsened 40.3%
56% worse than Hawaii average

Hawaii average: 25.8%

Low Risk Residents with Bowel/Bladder Incontinence Info Percent of low risk long-stay residents who lose control of their bowels or bladder 15.0%
18% better than Hawaii average

Hawaii average: 18.3%

Falls with Major Injury Info Percent of long-stay residents experiencing one or more falls with major injury 2.4%
14% worse than Hawaii average

Hawaii average: 2.1%

High Risk Residents with Pressure Ulcers Info Percent of long-stay high risk residents with pressure ulcers 5.1%
39% worse than Hawaii average

Hawaii average: 3.6%

Urinary Tract Infection Info Percent of long-stay residents with a urinary tract infection 0.6%
75% better than Hawaii average

Hawaii average: 2.4%

Lost Too Much Weight Info Percent of long-stay residents who lose too much weight 0.0%
100% better than Hawaii average

Hawaii average: 4.7%

Depressive Symptoms Info Percent of long-stay residents who have depressive symptoms 0.0%
100% better than Hawaii average

Hawaii average: 1.5%

Antipsychotic Use Info Percent of long-stay residents who received an antipsychotic medication 3.9%
62% better than Hawaii average

Hawaii average: 10.1%

Pneumococcal Vaccine Info Percent of long-stay residents assessed and appropriately given the pneumococcal vaccine 99.4%
In line with Hawaii average

Hawaii average: 96.3%

Influenza Vaccine Info Percent of long-stay residents assessed and appropriately given the seasonal influenza vaccine 95.6%
In line with Hawaii average

Hawaii average: 95.4%

Short-stay resident measures
Significantly above average Hawaii avg: 3.0 Info CMS star rating based on short-stay quality measure performance. 5 stars = much above average, 1 star = much below average.
Pneumococcal Vaccine Info Percent of short-stay residents assessed and appropriately given the pneumococcal vaccine 87.0%
In line with Hawaii average

Hawaii average: 83.4%

Antipsychotic medication increase Info Percent of short-stay residents who newly received an antipsychotic medication 0.4%
65% better than Hawaii average

Hawaii average: 1.2%

Influenza Vaccine Info Percent of short-stay residents assessed and appropriately given the seasonal influenza vaccine 91.6%
8% better than Hawaii average

Hawaii average: 84.7%

Re-hospitalized after SNF stay Info Percentage of short-stay residents who were re-hospitalized after their nursing home admission. 19.7%
In line with Hawaii average

Hawaii average: 19.6%

Emergency department visits Info Percentage of short-stay residents who had an outpatient emergency department visit. 9.6%
12% better than Hawaii average

Hawaii average: 10.9%

Falls with major injury Info Percentage of SNF residents who experience falls with major injury during their stay. 0.0%
100% better than Hawaii average

Hawaii average: 0.8%

Ability to care for self at discharge Info Percentage of residents at or above expected ability to care for themselves at discharge. 66.7%
24% better than Hawaii average

Hawaii average: 53.7%

Successful return to home or community Info Rate of successful return to home or community from a skilled nursing facility. 72.7%
44% better than Hawaii average

Hawaii average: 50.6%

Breakdown by payment type

Medicare

24% of new residents, usually for short-term rehab.

Typical stay 30 days

Private pay

72% of new residents, often for short stays.

Typical stay 27 days

Medicaid

4% of new residents, often for long-term daily care.

Typical stay 1 - 2 years

Facility Characteristics

Source: CMS Long-Term Care Facility Characteristics (Data as of Jan 2026)

Total residents 95
Medicare
53
55.8% of residents
Medicaid
39
41.1% of residents
Private pay or other
3
3.2% of residents
Programs & Services
Residents Group

Residents meet regularly to discuss policies, care quality, and activities

Nurse Aide Training

State-approved Nurse Aide Training and Competency Evaluation Program on-site

Active Resident Council

Organized group of residents that meets regularly to discuss facility policies, quality of life, and activities.

Finances and operations

Based on CMS SNF Cost Report for fiscal year ending in 12/2023.

For-profit
Corporation
Net patient revenue Info Net patient revenue — what the home actually collects for resident care, after contractual allowances, bad debt and discounts are subtracted from its gross charges (CMS cost report, Worksheet G-3). It covers resident care only; money the home earns from other sources is shown separately as "Other income."
$22.2M
Net patient income Info Net patient income: net patient revenue minus the home's total operating expenses. A positive figure means it earns more from resident care than it spends to deliver it; a negative figure means the opposite. It excludes non-operating "other income."
$3.1M
For-profit Corporation
Net patient revenue Info Net patient revenue — what the home actually collects for resident care, after contractual allowances, bad debt and discounts are subtracted from its gross charges (CMS cost report, Worksheet G-3). It covers resident care only; money the home earns from other sources is shown separately as "Other income."
$22.2M Rank #7 / 29Revenue — State benchmarkedThis home is ranked 7th out of 29 homes in Hawaii. Shows this facility's annual revenue compared to the Hawaii average. Higher revenue generally means more resources for staffing and capital — read alongside Payroll %.Rankings are based only on facilities in Hawaii that report data for that category. Facilities without available data are excluded from the ranking.Click the rank badge to see the full State ranking.Click here to see the full State ranking.
Net patient income Info Net patient income: net patient revenue minus the home's total operating expenses. A positive figure means it earns more from resident care than it spends to deliver it; a negative figure means the opposite. It excludes non-operating "other income."
$3.1M
Other income Info Money the home earns outside of resident care — such as investments, grants, rentals and other non-operating sources (CMS cost report, Worksheet G-3). It is tracked separately from net patient revenue: it is not part of that figure, and it is not included in net patient income.
$63.7K
Payroll costs Info Staff salaries plus wage-related costs — benefits such as payroll taxes, health insurance and retirement — from the home's own accounting records (CMS cost report, Worksheet A). Contract or agency labor is counted separately, under other operating costs. Rank #6 / 29Payroll — State benchmarkedThis home is ranked 6th out of 29 homes in Hawaii. Shows total annual staff payroll benchmarked to the Hawaii average. Higher payroll investment relative to peers often signals better staffing and less reliance on cheaper contract labor.Rankings are based only on facilities in Hawaii that report data for that category. Facilities without available data are excluded from the ranking.Click the rank badge to see the full State ranking.Click here to see the full State ranking.
$10.7M 48.4% of net patient revenue Info Payroll as a share of revenue: staff salaries and wage-related benefits divided by net patient revenue. A higher figure means more of each revenue dollar goes to staff pay. Rank #23 / 29Payroll % — State benchmarkedThis home is ranked 23rd out of 29 homes in Hawaii. Shows payroll as a percentage of revenue versus the Hawaii average. Well-run Hawaii facilities typically land around 52–61% — the top third Statewide. Below 25% may signal understaffing or heavy agency use — read with Staffing ratings.Rankings are based only on facilities in Hawaii that report data for that category. Facilities without available data are excluded from the ranking.Click the rank badge to see the full State ranking.Click here to see the full State ranking.
Other operating costs Info Everything it costs to run the home apart from payroll — food, utilities, supplies, maintenance, contract labor and administration. Calculated as total operating expense minus payroll (staff salaries and wage-related benefits).
$8.4M
Total costs Info The home's total operating expense for the year — all the costs of running it, salaries included (CMS cost report, Worksheet G-3).
$19.1M

Who this home usually serves

TYPE OF STAY

Primarily short stays

Residents typically stay for brief periods, with frequent admissions and discharges throughout the year.

Most new residents arrive under private pay (72% of admissions), and a typical private pay stay runs around 27 days.

Admissions
742 total

Coverage residents most often arrive under.

Medicare 24%
Private pay 72%
Medicaid 4%
Discharges
717 total

Coverage residents most often leave under.

Medicare 24%
Private pay 72%
Medicaid 4%

Places of interest near Avalon Care Center – Honolulu

Address 2.6 miles from city center Info Estimated distance in miles from Honolulu's city center to Avalon Care Center – Honolulu's address, calculated via Google Maps.

Calculate Travel Distance to Avalon Care Center – Honolulu

Add your location

Address

Compare Nursing Homes around Honolulu

The information below is reported by the Hawaii Department of Health, Office of Health Care Assurance.

5 facilities compared · CMS & HI Dept. of Health data

15 Craigside
NH
ADC
AL
HC
IL
Honolulu (Nuuanu - Punchbowl)
45
Facility 45
HI AVG 43
Rank #26 / 87
97.7%
Facility 97.7%
HI AVG 74.2%
Rank #2 / 28
+32%
5.04
Facility 5.04
HI AVG 4.20
Rank #8 / 33
+1% +20%
$0
Facility $0
HI AVG $43.4k
Rank #1 / 34
5
Facility 5
HI AVG 35.5
Rank #1 / 34
2.5
Facility 2.5
HI AVG 8.2
Rank #1 / 34
- 45 A+
50
Facility 50
HI AVG 49
Rank #85 / 178
Bree Komagome
$7.7M
Facility $7.7M
HI AVG $20.8M
Rank #27 / 29
$5.2M
Facility $5.2M
HI AVG $7.1M
Rank #24 / 29
67.8%
Facility 67.8%
HI AVG 38.9%
Rank #1 / 29
125063
Arcadia Retirement Residence
NH
ADC
HC
IL
NC
Honolulu (Makiki/Lower/ Punchbowl/Tantalus)
91
Facility 91
HI AVG 43
Rank #18 / 87
84.3%
Facility 84.3%
HI AVG 74.2%
Rank #10 / 28
+14%
5.08
Facility 5.08
HI AVG 4.20
Rank #7 / 33
+26% +21%
$12.9k
Facility $12.9k
HI AVG $43.4k
Rank #23 / 34
36
Facility 36
HI AVG 35.5
Rank #19 / 34
9.0
Facility 9.0
HI AVG 8.2
Rank #27 / 34
2 85 A+
86
Facility 86
HI AVG 49
Rank #27 / 178
Kathleen Yokouchi
$14.6M
Facility $14.6M
HI AVG $20.8M
Rank #14 / 29
$7.5M
Facility $7.5M
HI AVG $7.1M
Rank #11 / 29
51.1%
Facility 51.1%
HI AVG 38.9%
Rank #11 / 29
125014
Kalākaua Gardens
NH
AL
IL
MC
RC
Honolulu (Ala Moana)
49
Facility 49
HI AVG 43
Rank #24 / 87
71.4%
Facility 71.4%
HI AVG 74.2%
Rank #20 / 28
-4%
0.37
Facility 0.37
HI AVG 4.20
Rank #33 / 33
-3% -91%
$55.7k
Facility $55.7k
HI AVG $43.4k
Rank #30 / 34
35
Facility 35
HI AVG 35.5
Rank #18 / 34
5.8
Facility 5.8
HI AVG 8.2
Rank #10 / 34
3 42 -
98
Facility 98
HI AVG 49
Rank #3 / 178
1723 Kalakaua LLC
$21.3M
Facility $21.3M
HI AVG $20.8M
Rank #10 / 29
$9.5M
Facility $9.5M
HI AVG $7.1M
Rank #8 / 29
44.8%
Facility 44.8%
HI AVG 38.9%
Rank #16 / 29
125066
Avalon Care Center – Honolulu
NH
Honolulu (Kalihi Valley)
108
Facility 108
HI AVG 43
Rank #10 / 87
90.4%
Facility 90.4%
HI AVG 74.2%
Rank #7 / 28
+22%
4.06
Facility 4.06
HI AVG 4.20
Rank #17 / 33
+24% -3%
$0
Facility $0
HI AVG $43.4k
Rank #1 / 34
53
Facility 53
HI AVG 35.5
Rank #31 / 34
17.7
Facility 17.7
HI AVG 8.2
Rank #34 / 34
- 96 A+
47
Facility 47
HI AVG 49
Rank #93 / 178
Avalon Of Hawaii LLC
$22.2M
Facility $22.2M
HI AVG $20.8M
Rank #7 / 29
$10.7M
Facility $10.7M
HI AVG $7.1M
Rank #6 / 29
48.4%
Facility 48.4%
HI AVG 38.9%
Rank #23 / 29
125020
The Care Center of Honolulu
NH
Honolulu (Liliha - Kapalama)
182
Facility 182
HI AVG 43
Rank #3 / 87
66.6%
Facility 66.6%
HI AVG 74.2%
Rank #22 / 28
-10%
3.31
Facility 3.31
HI AVG 4.20
Rank #30 / 33
-13% -21%
$8.0k
Facility $8.0k
HI AVG $43.4k
Rank #20 / 34
47
Facility 47
HI AVG 35.5
Rank #29 / 34
9.4
Facility 9.4
HI AVG 8.2
Rank #28 / 34
1 170 A+
71
Facility 71
HI AVG 49
Rank #46 / 178
Suzanne Darley
$38.4M
Facility $38.4M
HI AVG $20.8M
Rank #6 / 29
$18.2M
Facility $18.2M
HI AVG $7.1M
Rank #2 / 29
47.6%
Facility 47.6%
HI AVG 38.9%
Rank #15 / 29
125019

Financial Assistance for
Nursing Home in Hawaii

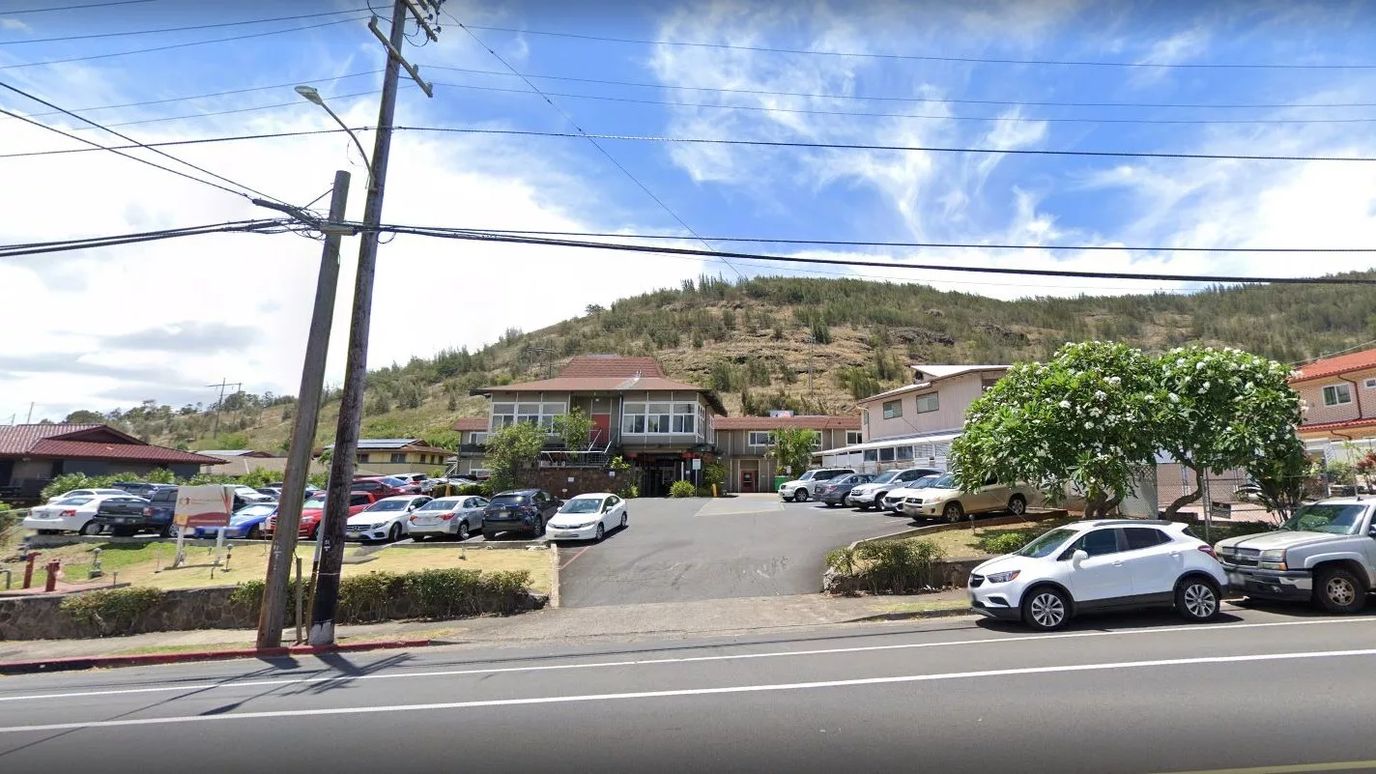
Avalon Care Center – Honolulu is located in Honolulu, Hawaii.
Here are the financial assistance programs available to residents in Hawaii.

Get Financial aid guidance

QUEST Integration

Hawaii Medicaid QUEST Integration

Age 65+ or disabled
General Hawaii resident, Medicaid-eligible, long-term care need.
Income Limits (2025) ~$2,829/month 300% FBR, individual
Asset Limits $2,000 (individual), $3,000 (couple).
HI

High cost of living adjustments.

Benefits
In-home care (6-8 hours/day) Nursing home Respite (240 hours/year) Medical services

Kupuna Care

Hawaii Kupuna Care

Age 60+
General Hawaii resident, unable to perform 2+ ADLs.
Income Limits No strict limit; prioritizes low-income.
Asset Limits Not applicable.
HI

Limited funding; island-specific delivery.

Benefits
In-home care (3-5 hours/week) Adult day care (~$70/day) Transportation (~5 trips/month)

Program of All-Inclusive Care for the Elderly (PACE)

Hawaii Medicaid PACE

Age 55+
General Hawaii resident, nursing home-level care need, safe with PACE support.
Income Limits (2025) ~$2,829/month 300% FBR
Asset Limits $2,000 (individual), $3,000 (couple).
HI

Limited to Oahu (e.g., Maluhia in Honolulu); few providers.

Benefits
Personal care (5-7 hours/day) Medical care Meals Transportation Therapy Respite

Medicare Savings Program (MSP)

Hawaii Medicare Savings Program

Age 65+ or disabled
General Hawaii resident, Medicare Part A/B.
Income Limits (2025) ~$2,510/month (QMB), ~$3,380/month (SLMB), ~$3,598/month (QI)—individual, adjusted annually.
Asset Limits $9,430 (individual), $14,130 (couple).
HI

Three tiers; no waitlist.

Benefits
Covers Part B premiums ($174.70/month) Deductibles ($240/year) Copays (~20%)

National Family Caregiver Support Program (NFCSP) Respite

Hawaii NFCSP Respite Care

Age
General Caregivers of 60+ needing care or 55+ caregivers of others; Hawaii resident; functional needs (2+ ADLs).
Income Limits (2025) Prioritizes ~$24,980/year (individual); no strict cap.
Asset Limits Not assessed; need-based.
HI

Four county AAAs; prioritizes low-income.

Benefits
Respite (4-6 hours/week or 5 days/year) Adult day care ($80/day) Counseling

VA Aid and Attendance (A&A) and Housebound Benefits

Hawaii VA Aid and Attendance/Housebound

Age 65+ or disabled veteran/surviving spouse
General Hawaii resident, wartime service, need for aid with ADLs (A&A) or homebound status.
Income Limits (2025) Net income < ~$1,984/month (veteran with dependent, A&A); pension offsets income.
Asset Limits ~$155,356 2025 net worth limit
HI

Applies statewide; high demand due to veteran population.

Benefits
Cash (~$1,433-$2,642/month veteran, ~$951-$1,318 spouse) for care costs (e.g., in-home, assisted living)

Senior Companion Program (SCP)

Hawaii Senior Companion Program

Age
General Volunteers: 55+, low-income, Hawaii resident, able to work 20 hours/week. Recipients: Frail elders needing companionship.
Income Limits (2025) Volunteers: ~$24,980/year (200% FPL); recipients: no limit.
Asset Limits Not specified for volunteers; need-based for recipients.
HI

Statewide; managed by DHS Social Services.

Benefits
Volunteers paid ~$4/hour for companionship (~20 hours/week); recipients get free support (~4-6 hours/week)

Frequently Asked Questions about Avalon Care Center – Honolulu

What neighborhood is Avalon Care Center – Honolulu in?

Avalon Care Center – Honolulu is in the Kalihi Valley neighborhood of Honolulu.

Is Avalon Care Center – Honolulu in a walkable area?

Avalon Care Center – Honolulu has a walk score of 47. Somewhat walkable. A few nearby services may be reachable on foot, but most trips require transportation.

What is the occupancy rate at Avalon Care Center – Honolulu?

Avalon Care Center – Honolulu's occupancy is 90.4%.

Does Avalon Care Center – Honolulu operate as a for-profit or non-profit?

Avalon Care Center – Honolulu is registered as a for-profit in HI.

Are there photos of Avalon Care Center – Honolulu?

Yes — there are 2 photos of Avalon Care Center – Honolulu in the photo gallery on this page.

What is the address of Avalon Care Center – Honolulu?

Avalon Care Center – Honolulu is located at 1930 Kamehameha Iv Rd, Honolulu, HI 96819.

What is the phone number of Avalon Care Center – Honolulu?

(808) 847-4834 will put you in contact with the team at Avalon Care Center – Honolulu.

Guides for Better Senior Living

Care Cost Calculator: See Prices in Your Area

Nursing Home Data Explorer

Don’t Wait Too Long: 7 Red Flag Signs Your Parent Needs Assisted Living Now

The True Cost of Assisted Living in 2025 – And How Families Are Paying For It

Understanding Senior Living Costs: Pricing Models, Discounts & Financial Assistance