Southridge Village Nursing and Rehab
Nursing Home, Memory Care & Respite Care · Heber Springs, AR
CMS overall rating Info CMS (the Centers for Medicare & Medicaid Services) is the federal agency that rates nursing home quality. Its Overall Rating runs from 1 to 5 stars, combining health inspections, staffing, and quality measures, with inspections weighted most heavily.

Southridge Village Nursing and Rehab

Nursing Home, Memory Care & Respite Care · Heber Springs, AR
CMS overall rating Info CMS (the Centers for Medicare & Medicaid Services) is the federal agency that rates nursing home quality. Its Overall Rating runs from 1 to 5 stars, combining health inspections, staffing, and quality measures, with inspections weighted most heavily.
Calculator: See prices in your area
Southridge Village Nursing and Rehab accepts Medicare, Medicaid, and private pay.

Overview of Southridge Village Nursing and Rehab

Eagle Health Systems Inc. owns Southridge Village Nursing and Rehab, a 122-bed care home on Southridge Parkway in Heber Springs, Arkansas, which is run by HBNC, Inc. The building operates at about 58 percent occupancy, leaving regular openings for new admissions. Stays here average around 198 days, a timeline that shows the daily routine divides its time between short-term post-hospital therapy and permanent residential placements. When managing stay costs, the business office processes traditional Medicare, state Medicaid, and standard private pay.

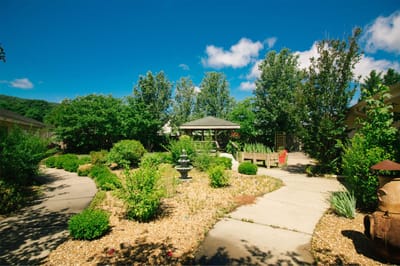
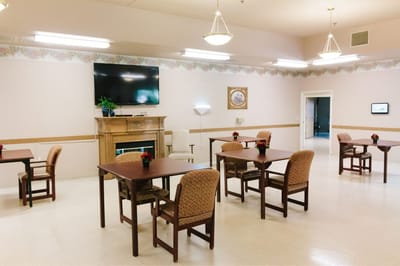
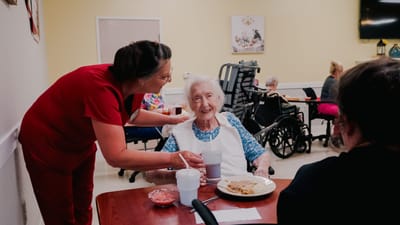
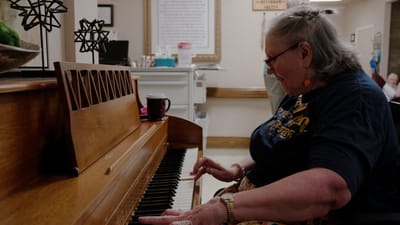
The building features private rooms with personal showers, a large communal dining area, a therapy gym, and an outdoor courtyard. These spaces support a 24-hour nursing crew that delivers about 4 hours and 21 minutes of direct, hands-on attention to each resident daily, managing regular clinical needs, short-term recovery, and temporary respite stays.

The kitchen crew accommodates personal food choices and allergies under the direction of a certified dietary manager, and the location is moderately walkable, so visitors can easily clear a few quick tasks on foot.

Individuals can check out the facility’s recent state inspection reports with the front office to see how the management team handles daily quality control. The latest surveys highlighted compliance issues regarding medication security, clinical documentation, restorative care processes, and kitchen hygiene protocols. Walking through these findings with the administrative staff gives you a practical look at their safety protocols before you dive into room availability or the admissions paperwork.

Quality ratings

Measured by Centers for Medicare & Medicaid Services (CMS)

Overall rating Info The Overall CMS Rating combines results from health inspections, staffing levels and quality measures. Health inspections carry the most weight. Staffing and quality scores can increase or decrease the final rating based on performance compared to state and national standards.
▲ 27.5% Above AR avg. ▲ 27.5% Above AR avg.AR average: 3.1Click the badge to see the full State ranking.Click here to see the full State ranking.
Health Inspection Info Based on the results of the facility's three most recent standard inspections and any complaint investigations. CMS reviews the number, scope, and severity of deficiencies, with more recent findings weighted more heavily.
▲ 38.4% Above AR avg. ▲ 38.4% Above AR avg.AR average: 2.9Click the badge to see the full State ranking.Click here to see the full State ranking.
Staffing Info Measures average nursing staff hours per resident per day, including Registered Nurses (RNs) and total nursing staff. Ratings are adjusted based on the level of care residents require and are compared to state and national benchmarks.
▼ 5.8% Below AR avg. ▼ 5.8% Below AR avg.AR average: 3.2Click the badge to see the full State ranking.Click here to see the full State ranking.
Quality Measures Info Based on clinical and physical health indicators reported to CMS, such as hospital readmissions, falls, pressure ulcers, and improvements in mobility. These measures reflect how well residents' health needs are being managed.
▲ 9.3% Above AR avg. ▲ 9.3% Above AR avg.AR average: 3.7Click the badge to see the full State ranking.Click here to see the full State ranking.

Staffing hours breakdown

Info Daily nursing hours per resident by staff type, reported to CMS. Higher is generally better — compare this facility to state and national averages to see where staffing stands.

Hours per resident per day — compared to Arkansas state averages

Total nursing care / resident Info Total adjusted nursing hours per resident per day, combining RN, LPN, and aide time. CMS adjusts this for case-mix so facilities can be fairly compared.
4h 21m per day
This facility Arkansas avg (4h 40m per day)
vs Arkansas avg
-7%

5 of 6 metrics below state avg

Standout metric Registered Nurse (RN) is +9% above state avg
Staff typeHours / Day / Residentvs state avg
Registered Nurse (RN) Info RNs hold the highest nursing license and can assess residents, interpret test results, and direct care plans. More RN hours per day often signals stronger clinical oversight and faster response to health changes. 26m per day ▲ 9% State avg: 24m per day · National avg: 41m per day
LPN / LVN Info Licensed Practical Nurses (LPNs) or Licensed Vocational Nurses (LVNs) deliver routine hands-on care — medication administration, wound dressing, and monitoring vital signs. They work under RN supervision and make up a large share of daily bedside care. 52m per day ▼ 8% State avg: 57m per day · National avg: 52m per day
Nurse Aide Info Certified Nurse Aides (CNAs) provide the most direct day-to-day assistance: bathing, dressing, feeding, and mobility. Nurse aide hours are typically the largest staffing category and directly affect residents' quality of life. 2h 30m per day ▼ 9% State avg: 2h 44m per day · National avg: 2h 21m per day
Weekend Total Nursing Info Combined nursing hours (RN + LPN + Nurse Aide) per resident per day on weekends. Staffing often drops on weekends — this figure reveals whether the facility maintains adequate coverage outside of weekday hours. 3h 1m per day ▼ 13% State avg: 3h 29m per day · National avg: 3h 26m per day
Physical Therapist Info Hours per resident per day provided by licensed Physical Therapists (PTs) or PT Assistants. PT services help residents recover mobility after injury or illness and are especially important for post-acute (short-stay) rehabilitation. 0m per day ▼ 80% State avg: 2m per day · National avg: 4m per day
Weekend RN Info Registered nurse hours specifically on weekends. Facilities sometimes reduce RN presence on Saturdays and Sundays — a low weekend RN figure compared to weekday hours can indicate reduced clinical oversight when most administrative staff are absent. 13m per day ▼ 18% State avg: 16m per day · National avg: 29m per day

Capacity and availability

Avg. Length of Stay
198 days
Bed community size
122-bed community Rank #53 / 330Bed count — State benchmarkedThis home is ranked 53rd out of 330 homes in Arkansas. Shows this facility's certified or reported bed count compared to other Arkansas facilities. Larger communities may offer more amenities, programs, and on-site services for residents and families.Rankings are based only on facilities in Arkansas that report data for that category. Facilities without available data are excluded from the ranking.Click the rank badge to see the full State ranking.Click here to see the full State ranking.
A larger shared setting that may offer more common spaces and organized community services.
Walk Score
Walk Score: 58 / 100 Rank #60 / 419Walk Score — State benchmarkedThis home is ranked 60th out of 419 homes in Arkansas. Shows how walkable this facility's neighborhood is compared to the average Walk Score across Arkansas facilities. Higher scores benefit residents, families, and staff.Rankings are based only on facilities in Arkansas that report data for that category. Facilities without available data are excluded from the ranking.Click the rank badge to see the full State ranking.Click here to see the full State ranking.
Moderately walkable. Some errands can be accomplished on foot, with a mix of nearby amenities.

About this community

Occupancy

Occupancy rate
58%
Lower than the Arkansas average: 71.3%
Occupied beds
71 / 122
Average occupied beds in Arkansas homes 77 beds

License Details

Facility TypeSkilled Nursing Facility With Dual Certified Beds (medicaid / Medicare)
CountyCleburne
CMS Certification Number045196
Certification TypeMedicaid / Medicare

Ownership & Operating Entity

Southridge Village Nursing and Rehab is legally operated by HBNC, Inc., and administered by Brenda Chapman.

Owner NameHbnc, Inc
Profit StatusFor-profit

Type Of Units

Medicaid and Medicare
122 units
Total beds
122 units

Therapy & Rehabilitation

2 services
Rehabilitation Services
Respite Care

Staffing & Medical

1 service
24-Hour Staffing

Contact Information

Fax501-362-2519

Amenities & Lifestyle

Private Rooms With Showers
Large Communal Dining Space
Dedicated Activity Area
Outdoor Courtyard
Therapy Gym With State-Of-The-Art Equipment
Activities
Specific ProgramsShort-Term Rehab, Additional Services

Contact Southridge Village Nursing and Rehab

Inspection History

In Arkansas, the Department of Human Services, Office of Long Term Care is authorized to conduct unannounced inspections and issue official quality of care reports for all senior living providers.

Since 2021 · 5 years of data 20 deficiencies

Inspection Scorecard Info This scorecard compares key inspection, deficiency, and complaint metrics at this facility against the Arkansas state average. Metrics rated ≥15% worse than average are highlighted in red; those ≥15% better are highlighted in green.

Since 2021 vs. Arkansas state average
Overall vs. AR average 0 Worse No metrics in this bucket. 2 Better Metrics better than Arkansas average:
• Total deficiencies (5% below)
• Deficiencies per year (5% below)
Latest Inspection July 25, 2024 Complaint Investigation

Deficiencies Info Deficiencies are formal regulatory issues recorded during state inspections.

This FacilityAR Averagevs. AR Avg
Total deficiencies Info Formal regulatory issues recorded by inspectors across all inspection types. 2021 This facility has 5% fewer total deficiencies than a typical Arkansas nursing home (20 vs. AR avg 21).↓ 5% better
Deficiencies per year Info Average deficiencies per year since 2021. 44.2 This facility has 5% fewer deficiencies per year than a typical Arkansas nursing home (4 vs. AR avg 4.2).↓ 5% better

Inspection Reports Summary Info An editor-reviewed summary of the themes and findings across this facility's recent inspection reports.

  • July 25, 2024 inspection found 2 deficiencies for failing to update and provide restorative nursing services for Resident #81 discharged from therapy.
  • March 7, 2023 complaint investigation substantiated failures to contain respiratory equipment and secure medication storage, risking infection and resident safety.
  • May 5, 2023 routine inspection cited 4 deficiencies including poor foot care, incorrect oxygen flow, unsafe pureed food consistency, and inadequate hand hygiene during food prep.

Health Inspection History

Inspections since 2021
Total health inspections 4

Arkansas average 4.2


Last Health inspection on Jul 2024

Total health citations
12

Arkansas average 21.8

Citations per inspection
3

Arkansas average 5.32


Health citations are formal notices following inspections when they fail to comply with safety and care standards.

10 of 12 citations resulted from standard inspections; and 2 of 12 resulted from complaint investigations.

Breakdown of citation severity (last 5 years)
Critical health citations
0
100% better than Arkansas average

Arkansas average: 0.4


Serious health citations
0
100% better than Arkansas average

Arkansas average: 0.2

0 critical citations Arkansas average: 0.4

0 serious citations Arkansas average: 0.2

12 moderate citations Arkansas average: 20.9

0 minor citations Arkansas average: 0.4
Citations history (last 5 years)
Quality of Care moderate citation Jul 25, 2024
Corrected

Care Planning moderate citation Jul 25, 2024
Corrected

Care Planning moderate citation Jul 25, 2024
Corrected

Nutrition moderate citation May 05, 2023
Corrected

Staffing Data

Reporting period: October 1 – December 31, 2025 (Q4 2025). Source: CMS Payroll-Based Journal report.

Total staff 135
Employees 109
Contractors 26
Staff to resident ratio 1.44 : 1
10% fewer staff per resident than Arkansas average
Arkansas average ratio: 1.59 : 1 Arkansas average ratio: 1.59 : 1See full Arkansas ranking
Avg staff/day 49
Average shift 7.7 hours
0% compared with Arkansas average
Arkansas average: 8 hours Arkansas average shift: 8 hoursSee full Arkansas ranking
Total staff hours (quarter) 34,790

Nursing staff breakdown

Q4 2025 · Oct 1 – Dec 31 More info This data comes from the CMS Payroll-Based Journal report covering October 1 – December 31, 2025.
Registered Nurse

Manages medical care and health needs.

RN Staff Info All 5 RN Staff are full-time employees. No contractors work on this role. 5
Average shift length Info Average shift length. Calculated as total hours divided by days worked and average staff per day. 8.7 hours
Licensed Practical Nurse

Assists with medical care and medications.

LPN Staff Info All 15 LPN Staff are full-time employees. No contractors work on this role. 15
Average shift length Info Average shift length. Calculated as total hours divided by days worked and average staff per day. 8.4 hours
Certified Nursing Assistant

Helps with daily care and mobility.

CNA Staff Info All 57 CNA Staff are full-time employees. No contractors work on this role. 57
Average shift length Info Average shift length. Calculated as total hours divided by days worked and average staff per day. 7.7 hours

Contractor staffing

Q4 2025 · Oct 1 – Dec 31 More info This data comes from the CMS Payroll-Based Journal report covering October 1 – December 31, 2025.

Total hours from contractors

4.3%

1,499 contractor hours this quarter

Respiratory Therapy Technician: 7 Physical Therapy Assistant: 5 Clinical Nurse Specialist: 3 Speech Language Pathologist: 3 Qualified Social Worker: 2 Physical Therapy Aide: 2 Occupational Therapy Aide: 2 Medical Director: 1 Occupational Therapy Assistant: 1

Staff by category

Q4 2025 · Oct 1 – Dec 31 More info This data comes from the CMS Payroll-Based Journal report covering October 1 – December 31, 2025.
Certified Nursing Assistant5705716,40492100%7.7
Licensed Practical Nurse150155,70992100%8.4
Medication Aide/Technician120123,89692100%8.8
Registered Nurse5051,62492100%8.7
RN Director of Nursing3031,5798289%8.1
Clinical Nurse Specialist5381,4916975%6.9
Dietitian1015587986%7.1
Nurse Practitioner1015206571%8
Nurse Aide in Training7075093134%7.8
Physical Therapy Aide0225096773%6.7
Speech Language Pathologist0334826571%6.5
Administrator1014806065%8
Mental Health Service Worker1014756267%7.7
Qualified Social Worker0221944448%4.4
Other Dietary Services Staff1011271820%7.1
Physical Therapy Assistant055763033%2.5
Occupational Therapy Aide022751112%6.3
Respiratory Therapy Technician077553134%1.7
Occupational Therapy Assistant0112733%8.8
Medical Director011333%1
57 Certified Nursing Assistant
% of Days 100%
15 Licensed Practical Nurse
% of Days 100%
12 Medication Aide/Technician
% of Days 100%
5 Registered Nurse
% of Days 100%
3 RN Director of Nursing
% of Days 89%
8 Clinical Nurse Specialist
% of Days 75%
1 Dietitian
% of Days 86%
1 Nurse Practitioner
% of Days 71%
7 Nurse Aide in Training
% of Days 34%
2 Physical Therapy Aide
% of Days 73%
3 Speech Language Pathologist
% of Days 71%
1 Administrator
% of Days 65%
1 Mental Health Service Worker
% of Days 67%
2 Qualified Social Worker
% of Days 48%
1 Other Dietary Services Staff
% of Days 20%
5 Physical Therapy Assistant
% of Days 33%
2 Occupational Therapy Aide
% of Days 12%
7 Respiratory Therapy Technician
% of Days 34%
1 Occupational Therapy Assistant
% of Days 3%
1 Medical Director
% of Days 3%

Penalties and fines

Federal penalties imposed by CMS for regulatory violations, including civil money penalties (fines) and denials of payment for new Medicare/Medicaid admissions.

Source: CMS Penalties Database

No penalties in the past 3 years

No civil money penalties or payment denials were reported in the last 3 years.

Quality of care over time

These measures show how residents usually do over time at this home, based on health outcomes and preventive care.

High-risk clinical events score Info A composite score based on pressure ulcers, falls with injury, weight loss, walking ability decline, and activities of daily living decline. 3.0
61% better than Arkansas average

Arkansas average: 7.7

Functional decline score Info A composite score based on activities of daily living decline, walking ability decline, and incontinence. 4.7
65% better than Arkansas average

Arkansas average: 13.3

Long-stay resident measures
Significantly above average Arkansas avg: 4.2 Info CMS star rating based on long-stay quality measure performance. 5 stars = significantly above average, 1 star = significantly below average.
Need for Help with Daily Activities Increased Info Percent of long-stay residents whose need for help with daily activities has increased 7.9%
31% better than Arkansas average

Arkansas average: 11.5%

Walking Ability Worsened Info Percent of long-stay residents whose ability to move independently worsened 3.6%
73% better than Arkansas average

Arkansas average: 13.4%

Low Risk Residents with Bowel/Bladder Incontinence Info Percent of low risk long-stay residents who lose control of their bowels or bladder 2.5%
84% better than Arkansas average

Arkansas average: 15.1%

Falls with Major Injury Info Percent of long-stay residents experiencing one or more falls with major injury 2.1%
46% better than Arkansas average

Arkansas average: 3.9%

High Risk Residents with Pressure Ulcers Info Percent of long-stay high risk residents with pressure ulcers 1.3%
72% better than Arkansas average

Arkansas average: 4.7%

Urinary Tract Infection Info Percent of long-stay residents with a urinary tract infection 0.3%
76% better than Arkansas average

Arkansas average: 1.3%

Lost Too Much Weight Info Percent of long-stay residents who lose too much weight 0.0%
100% better than Arkansas average

Arkansas average: 5.0%

Depressive Symptoms Info Percent of long-stay residents who have depressive symptoms 0.0%
100% better than Arkansas average

Arkansas average: 1.5%

Antipsychotic Use Info Percent of long-stay residents who received an antipsychotic medication 3.0%
71% better than Arkansas average

Arkansas average: 10.5%

Pneumococcal Vaccine Info Percent of long-stay residents assessed and appropriately given the pneumococcal vaccine 100.0%
6% better than Arkansas average

Arkansas average: 94.4%

Influenza Vaccine Info Percent of long-stay residents assessed and appropriately given the seasonal influenza vaccine 98.9%
In line with Arkansas average

Arkansas average: 96.2%

Hospitalizations per 1,000 days Info Number of hospitalizations per 1,000 long-stay resident days. 2.33
18% worse than Arkansas average

Arkansas average: 1.97

ED visits per 1,000 days Info Number of outpatient emergency department visits per 1,000 long-stay resident days. 3.53
62% worse than Arkansas average

Arkansas average: 2.18

Short-stay resident measures
Below average Arkansas avg: 2.7 Info CMS star rating based on short-stay quality measure performance. 5 stars = much above average, 1 star = much below average.
Pneumococcal Vaccine Info Percent of short-stay residents assessed and appropriately given the pneumococcal vaccine 77.1%
5% worse than Arkansas average

Arkansas average: 80.9%

Antipsychotic medication increase Info Percent of short-stay residents who newly received an antipsychotic medication 2.2%
43% worse than Arkansas average

Arkansas average: 1.5%

Influenza Vaccine Info Percent of short-stay residents assessed and appropriately given the seasonal influenza vaccine 85.1%
10% better than Arkansas average

Arkansas average: 77.7%

Re-hospitalized after SNF stay Info Percentage of short-stay residents who were re-hospitalized after their nursing home admission. 36.6%
45% worse than Arkansas average

Arkansas average: 25.2%

Emergency department visits Info Percentage of short-stay residents who had an outpatient emergency department visit. 24.1%
75% worse than Arkansas average

Arkansas average: 13.8%

Falls with major injury Info Percentage of SNF residents who experience falls with major injury during their stay. 0.8%
In line with Arkansas average

Arkansas average: 0.8%

Ability to care for self at discharge Info Percentage of residents at or above expected ability to care for themselves at discharge. 64.8%
21% better than Arkansas average

Arkansas average: 53.7%

Successful return to home or community Info Rate of successful return to home or community from a skilled nursing facility. 44.4%
12% worse than Arkansas average

Arkansas average: 50.6%

Breakdown by payment type

Medicare

43% of new residents, usually for short-term rehab.

Typical stay 1 - 2 months

Private pay

51% of new residents, often for short stays.

Typical stay 3 months

Medicaid

6% of new residents, often for long-term daily care.

Typical stay 5 - 6 years

Facility Characteristics

Source: CMS Long-Term Care Facility Characteristics (Data as of Jan 2026)

Total residents 94
Medicare
12
12.8% of residents
Medicaid
43
45.7% of residents
Private pay or other
39
41.5% of residents
Programs & Services
Residents Group

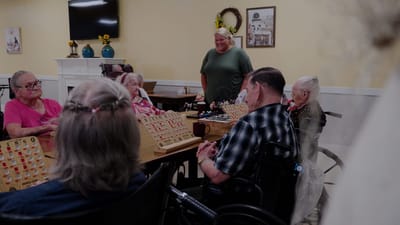
Residents meet regularly to discuss policies, care quality, and activities

Active Resident Council

Organized group of residents that meets regularly to discuss facility policies, quality of life, and activities.

Finances and operations

Based on CMS SNF Cost Report for fiscal year ending in 12/2023.

For-profit
Corporation
Net patient revenue Info Net patient revenue — what the home actually collects for resident care, after contractual allowances, bad debt and discounts are subtracted from its gross charges (CMS cost report, Worksheet G-3). It covers resident care only; money the home earns from other sources is shown separately as "Other income."
$11.2M
Net patient income Info Net patient income: net patient revenue minus the home's total operating expenses. A positive figure means it earns more from resident care than it spends to deliver it; a negative figure means the opposite. It excludes non-operating "other income."
$2.2M
For-profit Corporation
Net patient revenue Info Net patient revenue — what the home actually collects for resident care, after contractual allowances, bad debt and discounts are subtracted from its gross charges (CMS cost report, Worksheet G-3). It covers resident care only; money the home earns from other sources is shown separately as "Other income."
$11.2M
Net patient income Info Net patient income: net patient revenue minus the home's total operating expenses. A positive figure means it earns more from resident care than it spends to deliver it; a negative figure means the opposite. It excludes non-operating "other income."
$2.2M
Other income Info Money the home earns outside of resident care — such as investments, grants, rentals and other non-operating sources (CMS cost report, Worksheet G-3). It is tracked separately from net patient revenue: it is not part of that figure, and it is not included in net patient income.
$15.9K
Payroll costs Info Staff salaries plus wage-related costs — benefits such as payroll taxes, health insurance and retirement — from the home's own accounting records (CMS cost report, Worksheet A). Contract or agency labor is counted separately, under other operating costs.
$4.5M 39.9% of net patient revenue Info Payroll as a share of revenue: staff salaries and wage-related benefits divided by net patient revenue. A higher figure means more of each revenue dollar goes to staff pay.
Other operating costs Info Everything it costs to run the home apart from payroll — food, utilities, supplies, maintenance, contract labor and administration. Calculated as total operating expense minus payroll (staff salaries and wage-related benefits).
$4.6M
Total costs Info The home's total operating expense for the year — all the costs of running it, salaries included (CMS cost report, Worksheet G-3).
$9.1M

Who this home usually serves

TYPE OF STAY

Mix of rehab and long-term care

This home supports both short-term rehab and long-term care, with residents staying for a wide range of durations.

Most new residents arrive under private pay (51% of admissions), and a typical private pay stay runs around 3 months.

Admissions
187 total

Coverage residents most often arrive under.

Medicare 43%
Private pay 51%
Medicaid 6%
Discharges
177 total

Coverage residents most often leave under.

Medicare 49%
Private pay 46%
Medicaid 5%

Places of interest near Southridge Village Nursing and Rehab

Address 400 Southridge Parkway, Heber Springs, AR 72543

Calculate Travel Distance to Southridge Village Nursing and Rehab

Add your location

Address

Compare Nursing Homes around Heber Springs

The information below is reported by the Arkansas Department of Human Services, Office of Long Term Care.

2 facilities compared · CMS & AR Dept. of Health data

Southridge Village Nursing and Rehab
NH
MC
RC
Heber Springs
122
Facility 122
AR AVG 84
Rank #53 / 330
58.2% -18%4.34 -32%-7%$0123.0-71-
58
Facility 58
AR AVG 34
Rank #60 / 419
Eagle Health Systems Inc$11.2M$4.5M39.9%45196
The Springs of Greers Ferry
NH
HC
MC
PC
Heber Springs
140
Facility 140
AR AVG 84
Rank #17 / 330
58.6% -18%4.39 +5%-6%$0305.0-83-
3
Facility 3
AR AVG 34
Rank #380 / 419
Gerald Carlyle$8.6M$4.0M46.3%45158

Financial Assistance for
Nursing Home in Arkansas

Southridge Village Nursing and Rehab is located in Heber Springs, Arkansas.
Here are the financial assistance programs available to residents in Arkansas.

Get Financial aid guidance

ARChoices

Arkansas Medicaid ARChoices

Age 65+ or 21+ with disability
General Arkansas resident, Medicaid- eligible, nursing home-level care need.
Income Limits (2025) ~$2,829/month 300% FBR, individual
Asset Limits $2,000 (individual), $3,000 (couple).
AR

Rural focus; possible waitlists.

Benefits
Personal care (5-7 hours/day) Meals ($7/meal) Respite care (240 hours/year) Adult day services ($60/day)

Choices in Living Resource Center

Arkansas Choices in Living

Age 60+
General Arkansas resident.
Income Limits No strict limit; prioritizes low-income.
Asset Limits Not applicable.
AR

Limited direct funding; mostly referral-based.

Benefits
Care coordination Limited respite (up to 5 days/year) Transportation assistance (~5 trips/month)

Living Choices Assisted Living Waiver

Arkansas Medicaid Living Choices Assisted Living Waiver

Age 65+
General Arkansas resident, requires nursing home-level care, lives in a Level II assisted living facility.
Income Limits (2025) ~$2,829/month 300% FBR, individual
Asset Limits $2,000 (individual), $3,000 (couple); spousal rules apply.
AR

Limited provider network; excludes Level I facilities (no nursing services).

Benefits
Personal care (~5 hours/day) Medication management Nursing Activities Transportation

Program of All-Inclusive Care for the Elderly (PACE)

Arkansas Medicaid PACE

Age 55+
General Arkansas resident, nursing home-level care, safe with PACE support.
Income Limits (2025) ~$2,829/month 300% FBR
Asset Limits $2,000 (individual), $3,000 (couple).
AR

Limited geographic availability.

Benefits
Primary/preventive care Personal care (5-7 hours/day) Meals Transportation Therapy

Arkansas State Plan Personal Care

Arkansas Medicaid Personal Care Program

Age
General Any age, Arkansas resident, needs ADL/IADL help, Medicaid-eligible.
Income Limits (2025) ~$1,004/month individual
Asset Limits $9,660 (individual), $14,470 (couple).
AR

No nursing home-level care requirement.

Benefits
Personal care (~4-6 hours/day) Homemaker services (e.g., meal prep)

Frequently Asked Questions about Southridge Village Nursing and Rehab

Who is the owner of Southridge Village Nursing and Rehab?

Southridge Village Nursing and Rehab is legally operated by HBNC, Inc., and administered by Brenda Chapman.

Is Southridge Village Nursing and Rehab in a walkable area?

Southridge Village Nursing and Rehab has a walk score of 58. Moderately walkable. Some errands can be accomplished on foot, with a mix of nearby amenities.

What is the occupancy rate at Southridge Village Nursing and Rehab?

Southridge Village Nursing and Rehab's occupancy is 58%.

Does Southridge Village Nursing and Rehab operate as a for-profit or non-profit?

Southridge Village Nursing and Rehab is registered as a for-profit in AR.

Who is the administrator of Southridge Village Nursing and Rehab?

Brenda Chapman is the administrator of Southridge Village Nursing and Rehab.

How many beds does Southridge Village Nursing and Rehab have?

Southridge Village Nursing and Rehab has 122 beds.

Are there photos of Southridge Village Nursing and Rehab?

Yes — there are 13 photos of Southridge Village Nursing and Rehab in the photo gallery on this page.

Guides for Better Senior Living

Care Cost Calculator: See Prices in Your Area

Nursing Home Data Explorer

Don’t Wait Too Long: 7 Red Flag Signs Your Parent Needs Assisted Living Now

The True Cost of Assisted Living in 2025 – And How Families Are Paying For It

Understanding Senior Living Costs: Pricing Models, Discounts & Financial Assistance