Beebe Retirement Center, Inc.
Nursing Home, Memory Care & Respite Care · Beebe, AR
CMS overall rating Info CMS (the Centers for Medicare & Medicaid Services) is the federal agency that rates nursing home quality. Its Overall Rating runs from 1 to 5 stars, combining health inspections, staffing, and quality measures, with inspections weighted most heavily.

Beebe Retirement Center, Inc.

Nursing Home, Memory Care & Respite Care · Beebe, AR
CMS overall rating Info CMS (the Centers for Medicare & Medicaid Services) is the federal agency that rates nursing home quality. Its Overall Rating runs from 1 to 5 stars, combining health inspections, staffing, and quality measures, with inspections weighted most heavily.
Calculator: See prices in your area
Beebe Retirement Center, Inc. accepts Medicare, Medicaid, and private pay.

Overview of Beebe Retirement Center, INC.

Beebe Retirement Center is a 105-bed care home located on McAfee Lane in Beebe, Arkansas, where it has operated for 24 years. The property stays filled to about 78 percent capacity, and resident stays average 169 days. This timeline indicates that the staff handles a balanced daily workload of long-term nursing care and short-term post-hospital therapy.

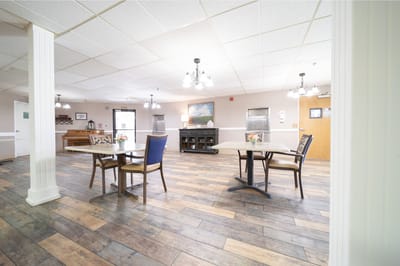
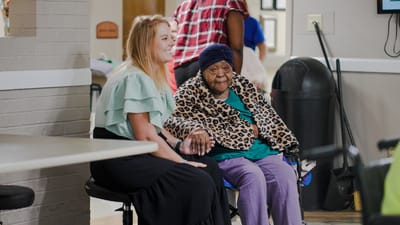
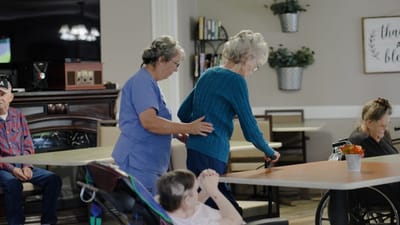
A certified dietary manager coordinates the kitchen here, preparing daily meals that accommodate individual food allergies and nutritional preferences. On the floor, residents receive an average of 4 hours and 32 minutes of direct care every day from a 24-hour team of registered nurses, practical nurses, and assistants. This clinical crew runs physical rehabilitation routines and respite stays, while daily lifestyle amenities include an outdoor courtyard, hair salon services, and scheduled social activities. The surrounding neighborhood offers moderate walkability, though visitors will still find it easiest to use a car for most errands around town.

Prospective residents can call the administrative office to ask about current room availability or check on the intake requirements. The front desk team can also explain how the facility has addressed recent findings from government health inspectors, who previously focused their routine safety audits on medication management, staffing levels, and infection control protocols.

Quality ratings

Measured by Centers for Medicare & Medicaid Services (CMS)

Overall rating Info The Overall CMS Rating combines results from health inspections, staffing levels and quality measures. Health inspections carry the most weight. Staffing and quality scores can increase or decrease the final rating based on performance compared to state and national standards.
Health Inspection Info Based on the results of the facility's three most recent standard inspections and any complaint investigations. CMS reviews the number, scope, and severity of deficiencies, with more recent findings weighted more heavily.
Staffing Info Measures average nursing staff hours per resident per day, including Registered Nurses (RNs) and total nursing staff. Ratings are adjusted based on the level of care residents require and are compared to state and national benchmarks.
Quality Measures Info Based on clinical and physical health indicators reported to CMS, such as hospital readmissions, falls, pressure ulcers, and improvements in mobility. These measures reflect how well residents' health needs are being managed.

Staffing hours breakdown

Info Daily nursing hours per resident by staff type, reported to CMS. Higher is generally better — compare this facility to state and national averages to see where staffing stands.

Hours per resident per day — compared to state averages

Total nursing care / resident Info Total adjusted nursing hours per resident per day, combining RN, LPN, and aide time. CMS adjusts this for case-mix so facilities can be fairly compared.
4h 32m per day
vs avg

4 of 6 metrics below state avg

Standout metric Weekend RN is +53% above state avg
Staff typeHours / Day / Residentvs state avg
Registered Nurse (RN) Info RNs hold the highest nursing license and can assess residents, interpret test results, and direct care plans. More RN hours per day often signals stronger clinical oversight and faster response to health changes. 31m per day ▲ 29% State avg: 24m per day · National avg: 41m per day
LPN / LVN Info Licensed Practical Nurses (LPNs) or Licensed Vocational Nurses (LVNs) deliver routine hands-on care — medication administration, wound dressing, and monitoring vital signs. They work under RN supervision and make up a large share of daily bedside care. 46m per day ▼ 19% State avg: 57m per day · National avg: 52m per day
Nurse Aide Info Certified Nurse Aides (CNAs) provide the most direct day-to-day assistance: bathing, dressing, feeding, and mobility. Nurse aide hours are typically the largest staffing category and directly affect residents' quality of life. 2h 39m per day ▼ 3% State avg: 2h 43m per day · National avg: 2h 20m per day
Weekend Total Nursing Info Combined nursing hours (RN + LPN + Nurse Aide) per resident per day on weekends. Staffing often drops on weekends — this figure reveals whether the facility maintains adequate coverage outside of weekday hours. 3h 18m per day ▼ 5% State avg: 3h 29m per day · National avg: 3h 26m per day
Physical Therapist Info Hours per resident per day provided by licensed Physical Therapists (PTs) or PT Assistants. PT services help residents recover mobility after injury or illness and are especially important for post-acute (short-stay) rehabilitation. 1m per day ▼ 47% State avg: 2m per day · National avg: 4m per day
Weekend RN Info Registered nurse hours specifically on weekends. Facilities sometimes reduce RN presence on Saturdays and Sundays — a low weekend RN figure compared to weekday hours can indicate reduced clinical oversight when most administrative staff are absent. 25m per day ▲ 53% State avg: 16m per day · National avg: 28m per day

Capacity and availability

Avg. Length of Stay
169 days
Bed community size
105-bed community Rank #108 / 330Bed count — State benchmarkedThis home is ranked 108th out of 330 homes in Arkansas. Shows this facility's certified or reported bed count compared to other Arkansas facilities. Larger communities may offer more amenities, programs, and on-site services for residents and families.Rankings are based only on facilities in Arkansas that report data for that category. Facilities without available data are excluded from the ranking.Click the rank badge to see the full State ranking.Click here to see the full State ranking.
A larger shared setting that may offer more common spaces and organized community services.
Years in operation
24 years in operation
A longer operating history, which may indicate experience navigating regulations and delivering ongoing care.
Walk Score
Walk Score: 27 / 100 Rank #254 / 419Walk Score — State benchmarkedThis home is ranked 254th out of 419 homes in Arkansas. Shows how walkable this facility's neighborhood is compared to the average Walk Score across Arkansas facilities. Higher scores benefit residents, families, and staff.Rankings are based only on facilities in Arkansas that report data for that category. Facilities without available data are excluded from the ranking.Click the rank badge to see the full State ranking.Click here to see the full State ranking.
Somewhat walkable. A few nearby services may be reachable on foot, but most trips require transportation.
BBB Rating
BBB Rating: A+ (Not Accredited)
An independent rating from the Better Business Bureau based on factors such as complaint history, transparency, and business practices.
How BBB ratings work

About this community

Occupancy

Occupancy rate
78%
Higher than the Arkansas average: 71.3%
Occupied beds
82 / 105
Average occupied beds in Arkansas homes 77 beds

License Details

Facility TypeSkilled Nursing Facility With Dual Certified Beds (medicaid /medicare)
CountyWhite
CMS Certification Number045304
Certification TypeMedicaid / Medicare

Ownership & Operating Entity

Beebe Retirement Center, Inc. is legally operated by Beebe Retirement Center, Inc., and administered by Melissa Poore.

Owner NameBeebe Retirement Center, Inc
Profit StatusFor-profit

Type Of Units

Medicaid and Medicare
105 units
Total beds
105 units

Staffing

Key information about the people who lead and staff this community.

Leadership

ContactMs. Theresa Stalnaker, Marketing Director

Therapy & Rehabilitation

2 services
Rehabilitation Services
Respite Care

Staffing & Medical

1 service
24-Hour Staffing

Contact Information

Fax501-882-5739

Amenities & Lifestyle

24/7 Nursing Care
Personalized Rehabilitation Programs
Nutritious Meals
Engaging Social And Recreational Activities
Salon Services
Outdoor Courtyard
Activities
Specific ProgramsShort-Term Rehab, Additional Services

Contact Beebe Retirement Center, Inc.

Inspection History

In Arkansas, the Department of Human Services, Office of Long Term Care is authorized to conduct unannounced inspections and issue official quality of care reports for all senior living providers.

Since 2023 · 3 years of data 16 deficiencies

Inspection Scorecard Info This scorecard compares key inspection, deficiency, and complaint metrics at this facility against the Arkansas state average. Metrics rated ≥15% worse than average are highlighted in red; those ≥15% better are highlighted in green.

Since 2023 vs. Arkansas state average
Overall vs. AR average 0 Worse No metrics in this bucket. 2 Better Metrics better than Arkansas average:
• Total deficiencies (24% below)
• Deficiencies per year (24% below)
Latest Inspection September 5, 2025 Other An inspection that falls outside standard annual surveys and formal complaint investigations. May include administrative compliance checks, documentation reviews, focused surveys on specific concerns, or revisit surveys to verify prior corrections.

Deficiencies Info Deficiencies are formal regulatory issues recorded during state inspections.

This FacilityAR Averagevs. AR Avg
Total deficiencies Info Formal regulatory issues recorded by inspectors across all inspection types. 1621 This facility has 24% fewer total deficiencies than a typical Arkansas assisted living residence (16 vs. AR avg 21).↓ 24% better
Deficiencies per year Info Average deficiencies per year since 2023. 5.37 This facility has 24% fewer deficiencies per year than a typical Arkansas assisted living residence (5.3 vs. AR avg 7).↓ 24% better

Inspection Reports Summary Info An editor-reviewed summary of the themes and findings across this facility's recent inspection reports.

  • September 5, 2025 inspection found three deficiencies including lack of resident access to survey results, expired medication risk from undated insulin pens, and insufficient staffing on 24 of 66 shifts.
  • Staffing shortages also caused delayed call light responses exceeding two hours as noted in the September 27, 2023 inspection.
  • Multiple inspections in 2023 and 2024 cited failures in medication self-administration assessments, inaccurate resident assessments, poor hand hygiene, and improper infection control practices.

Health Inspection History

Inspections since 2022
Total health inspections 4

State average N/A


Last Health inspection on Jul 2024

Total health citations
20

State average N/A

Citations per inspection
5

State average N/A


Health citations are formal notices following inspections when they fail to comply with safety and care standards.

17 of 20 citations resulted from standard inspections; and 3 of 20 resulted from complaint investigations.

Breakdown of citation severity (last 4 years)
Critical health citations
0
In line with State average

State average: N/A


Serious health citations
0
In line with State average

State average: N/A

0 critical citations State average: N/A

0 serious citations State average: N/A

19 moderate citations State average: N/A

1 minor citation State average: N/A
Citations history (last 4 years)
Infection Control moderate citation Jul 18, 2024
Corrected

Care Planning moderate citation Jul 18, 2024
Corrected

Care Planning minor citation Jul 18, 2024
Corrected

Resident Rights moderate citation Jul 18, 2024
Corrected

Staffing Data

Reporting period: October 1 – December 31, 2025 (Q4 2025). Source: CMS Payroll-Based Journal report.

Total staff 117
Employees 90
Contractors 27
Staff to resident ratio 1.43 : 1
0% compared with State average

State average ratio: 0 : 0

Avg staff/day 41
Average shift 7.9 hours
0% compared with State average

State average: 0 hours

Total staff hours (quarter) 29,784

Nursing staff breakdown

Q4 2025 · Oct 1 – Dec 31 More info This data comes from the CMS Payroll-Based Journal report covering October 1 – December 31, 2025.
Registered Nurse

Manages medical care and health needs.

RN Staff Info All 5 RN Staff are full-time employees. No contractors work on this role. 5
Average shift length Info Average shift length. Calculated as total hours divided by days worked and average staff per day. 8.7 hours
Licensed Practical Nurse

Assists with medical care and medications.

LPN Staff Info All 11 LPN Staff are full-time employees. No contractors work on this role. 11
Average shift length Info Average shift length. Calculated as total hours divided by days worked and average staff per day. 9.1 hours
Certified Nursing Assistant

Helps with daily care and mobility.

CNA Staff Info All 55 CNA Staff are full-time employees. No contractors work on this role. 55
Average shift length Info Average shift length. Calculated as total hours divided by days worked and average staff per day. 8 hours

Contractor staffing

Q4 2025 · Oct 1 – Dec 31 More info This data comes from the CMS Payroll-Based Journal report covering October 1 – December 31, 2025.

Total hours from contractors

3.5%

1,043 contractor hours this quarter

Clinical Nurse Specialist: 5 Speech Language Pathologist: 5 Qualified Social Worker: 5 Physical Therapy Assistant: 4 Physical Therapy Aide: 4 Respiratory Therapy Technician: 4

Staff by category

Q4 2025 · Oct 1 – Dec 31 More info This data comes from the CMS Payroll-Based Journal report covering October 1 – December 31, 2025.
Certified Nursing Assistant5505515,82892100%8
Licensed Practical Nurse110113,34592100%9.1
RN Director of Nursing4042,0337683%8.7
Registered Nurse5052,01792100%8.7
Medication Aide/Technician5051,9889098%9.8
Clinical Nurse Specialist2571,1137885%6.2
Nurse Aide in Training4045906672%7.8
Other Dietary Services Staff1015056874%7.4
Mental Health Service Worker1014916672%7.4
Nurse Practitioner1014725964%8
Administrator1014685964%7.9
Physical Therapy Aide0443806267%6.1
Speech Language Pathologist0552824246%6.7
Respiratory Therapy Technician0441224549%2.7
Qualified Social Worker055954650%2
Physical Therapy Assistant044554448%1.2
55 Certified Nursing Assistant
% of Days 100%
11 Licensed Practical Nurse
% of Days 100%
4 RN Director of Nursing
% of Days 83%
5 Registered Nurse
% of Days 100%
5 Medication Aide/Technician
% of Days 98%
7 Clinical Nurse Specialist
% of Days 85%
4 Nurse Aide in Training
% of Days 72%
1 Other Dietary Services Staff
% of Days 74%
1 Mental Health Service Worker
% of Days 72%
1 Nurse Practitioner
% of Days 64%
1 Administrator
% of Days 64%
4 Physical Therapy Aide
% of Days 67%
5 Speech Language Pathologist
% of Days 46%
4 Respiratory Therapy Technician
% of Days 49%
5 Qualified Social Worker
% of Days 50%
4 Physical Therapy Assistant
% of Days 48%

Penalties and fines

Federal penalties imposed by CMS for regulatory violations, including civil money penalties (fines) and denials of payment for new Medicare/Medicaid admissions.

Source: CMS Penalties Database

No penalties in the past 3 years

No civil money penalties or payment denials were reported in the last 3 years.

Quality of care over time

These measures show how residents usually do over time at this home, based on health outcomes and preventive care.

High-risk clinical events score Info A composite score based on pressure ulcers, falls with injury, weight loss, walking ability decline, and activities of daily living decline. 10.8
41% worse than State average

State average: 7.7

Functional decline score Info A composite score based on activities of daily living decline, walking ability decline, and incontinence. 22.2
66% worse than State average

State average: 13.3

Long-stay resident measures
Average State avg: 4.2 Info CMS star rating based on long-stay quality measure performance. 5 stars = significantly above average, 1 star = significantly below average.
Need for Help with Daily Activities Increased Info Percent of long-stay residents whose need for help with daily activities has increased 21.1%
83% worse than State average

State average: 11.5%

Walking Ability Worsened Info Percent of long-stay residents whose ability to move independently worsened 26.8%
101% worse than State average

State average: 13.4%

Low Risk Residents with Bowel/Bladder Incontinence Info Percent of low risk long-stay residents who lose control of their bowels or bladder 18.7%
23% worse than State average

State average: 15.1%

Falls with Major Injury Info Percent of long-stay residents experiencing one or more falls with major injury 2.9%
26% better than State average

State average: 3.9%

High Risk Residents with Pressure Ulcers Info Percent of long-stay high risk residents with pressure ulcers 2.2%
53% better than State average

State average: 4.7%

Urinary Tract Infection Info Percent of long-stay residents with a urinary tract infection 0.7%
43% better than State average

State average: 1.3%

Lost Too Much Weight Info Percent of long-stay residents who lose too much weight 1.1%
79% better than State average

State average: 5.0%

Depressive Symptoms Info Percent of long-stay residents who have depressive symptoms 0.8%
46% better than State average

State average: 1.5%

Antipsychotic Use Info Percent of long-stay residents who received an antipsychotic medication 1.6%
85% better than State average

State average: 10.5%

Pneumococcal Vaccine Info Percent of long-stay residents assessed and appropriately given the pneumococcal vaccine 98.6%
In line with State average

State average: 94.4%

Influenza Vaccine Info Percent of long-stay residents assessed and appropriately given the seasonal influenza vaccine 98.7%
In line with State average

State average: 96.2%

Hospitalizations per 1,000 days Info Number of hospitalizations per 1,000 long-stay resident days. 3.23
64% worse than State average

State average: 1.97

ED visits per 1,000 days Info Number of outpatient emergency department visits per 1,000 long-stay resident days. 1.87
14% better than State average

State average: 2.18

Short-stay resident measures
Significantly above average State avg: 2.7 Info CMS star rating based on short-stay quality measure performance. 5 stars = much above average, 1 star = much below average.
Pneumococcal Vaccine Info Percent of short-stay residents assessed and appropriately given the pneumococcal vaccine 89.8%
11% better than State average

State average: 80.9%

Antipsychotic medication increase Info Percent of short-stay residents who newly received an antipsychotic medication 0.0%
100% better than State average

State average: 1.5%

Influenza Vaccine Info Percent of short-stay residents assessed and appropriately given the seasonal influenza vaccine 88.5%
14% better than State average

State average: 77.7%

Re-hospitalized after SNF stay Info Percentage of short-stay residents who were re-hospitalized after their nursing home admission. 45.3%
80% worse than State average

State average: 25.2%

Emergency department visits Info Percentage of short-stay residents who had an outpatient emergency department visit. 13.3%
In line with State average

State average: 13.8%

Falls with major injury Info Percentage of SNF residents who experience falls with major injury during their stay. 0.0%
100% better than State average

State average: 0.8%

Ability to care for self at discharge Info Percentage of residents at or above expected ability to care for themselves at discharge. 83.3%
55% better than State average

State average: 53.7%

Successful return to home or community Info Rate of successful return to home or community from a skilled nursing facility. 58.3%
15% better than State average

State average: 50.6%

Breakdown by payment type

Medicare

28% of new residents, usually for short-term rehab.

Typical stay 2 months

Private pay

58% of new residents, often for short stays.

Typical stay 2 - 3 months

Medicaid

14% of new residents, often for long-term daily care.

Typical stay 2 years

Facility Characteristics

Source: CMS Long-Term Care Facility Characteristics (Data as of Jan 2026)

Total residents 82
Medicare
13
15.9% of residents
Medicaid
37
45.1% of residents
Private pay or other
32
39% of residents
Programs & Services
Residents Group

Residents meet regularly to discuss policies, care quality, and activities

Active Resident Council

Organized group of residents that meets regularly to discuss facility policies, quality of life, and activities.

Finances and operations

Based on CMS SNF Cost Report for fiscal year ending in 12/2023.

For-profit
Corporation
Net patient revenue Info Net patient revenue — what the home actually collects for resident care, after contractual allowances, bad debt and discounts are subtracted from its gross charges (CMS cost report, Worksheet G-3). It covers resident care only; money the home earns from other sources is shown separately as "Other income."
$8.4M
Net patient income Info Net patient income: net patient revenue minus the home's total operating expenses. A positive figure means it earns more from resident care than it spends to deliver it; a negative figure means the opposite. It excludes non-operating "other income."
$959.2K
For-profit Corporation
Net patient revenue Info Net patient revenue — what the home actually collects for resident care, after contractual allowances, bad debt and discounts are subtracted from its gross charges (CMS cost report, Worksheet G-3). It covers resident care only; money the home earns from other sources is shown separately as "Other income."
$8.4M
Net patient income Info Net patient income: net patient revenue minus the home's total operating expenses. A positive figure means it earns more from resident care than it spends to deliver it; a negative figure means the opposite. It excludes non-operating "other income."
$959.2K
Other income Info Money the home earns outside of resident care — such as investments, grants, rentals and other non-operating sources (CMS cost report, Worksheet G-3). It is tracked separately from net patient revenue: it is not part of that figure, and it is not included in net patient income.
$9.3K
Payroll costs Info Staff salaries plus wage-related costs — benefits such as payroll taxes, health insurance and retirement — from the home's own accounting records (CMS cost report, Worksheet A). Contract or agency labor is counted separately, under other operating costs.
$3.6M 42.6% of net patient revenue Info Payroll as a share of revenue: staff salaries and wage-related benefits divided by net patient revenue. A higher figure means more of each revenue dollar goes to staff pay.
Other operating costs Info Everything it costs to run the home apart from payroll — food, utilities, supplies, maintenance, contract labor and administration. Calculated as total operating expense minus payroll (staff salaries and wage-related benefits).
$3.9M
Total costs Info The home's total operating expense for the year — all the costs of running it, salaries included (CMS cost report, Worksheet G-3).
$7.5M

Who this home usually serves

TYPE OF STAY

Mix of rehab and long-term care

This home supports both short-term rehab and long-term care, with residents staying for a wide range of durations.

Most new residents arrive under private pay (58% of admissions), and a typical private pay stay runs around 2 - 3 months.

Admissions
186 total

Coverage residents most often arrive under.

Medicare 28%
Private pay 58%
Medicaid 14%
Discharges
174 total

Coverage residents most often leave under.

Medicare 32%
Private pay 57%
Medicaid 11%

Places of interest near Beebe Retirement Center, Inc.

Address 0.0 miles from city center Info Estimated distance in miles from Beebe's city center to Beebe Retirement Center, Inc.'s address, calculated via Google Maps.

Calculate Travel Distance to Beebe Retirement Center, Inc.

Add your location

Address

Compare Nursing Homes around the area

The information below is reported by the Arkansas Department of Human Services, Office of Long Term Care.

Beebe Retirement Center, Inc.
NH
MC
RC
Beebe -105 A+ 27 -
Barnes Healthcare
NH
MC
Lonoke -141 A+ 38 Private / Shared Rooms
Timberlane Health & Rehab
NH
MC
RC
El Dorado -106 A+ 33 -
Bear Creek Healthcare LLC
NH
De Queen -131 - 35 -
Maple Healthcare
NH
Hazen -70 - 21 Private / Shared Rooms

Frequently Asked Questions about Beebe Retirement Center, Inc.

Is Beebe Retirement Center, Inc. in a walkable area?

Beebe Retirement Center, Inc. has a walk score of 27. Somewhat walkable. A few nearby services may be reachable on foot, but most trips require transportation.

What is the occupancy rate at Beebe Retirement Center, Inc.?

Beebe Retirement Center, Inc.'s occupancy is 78%.

Does Beebe Retirement Center, Inc. operate as a for-profit or non-profit?

Beebe Retirement Center, Inc. is registered as a for-profit in AR.

Who is the administrator of Beebe Retirement Center, Inc.?

Melissa Poore is the administrator of Beebe Retirement Center, Inc..

How many beds does Beebe Retirement Center, Inc. have?

Beebe Retirement Center, Inc. has 105 beds.

Are there photos of Beebe Retirement Center, Inc.?

Yes — there are 13 photos of Beebe Retirement Center, Inc. in the photo gallery on this page.

What is the address of Beebe Retirement Center, Inc.?

Beebe Retirement Center, Inc. is located at 709 Mcafee Lane, Beebe, AR 72012.

Guides for Better Senior Living

Care Cost Calculator: See Prices in Your Area

Nursing Home Data Explorer

Don’t Wait Too Long: 7 Red Flag Signs Your Parent Needs Assisted Living Now

The True Cost of Assisted Living in 2025 – And How Families Are Paying For It

Understanding Senior Living Costs: Pricing Models, Discounts & Financial Assistance