Center at Waterfront LLC
CMS overall rating Info CMS (the Centers for Medicare & Medicaid Services) is the federal agency that rates nursing home quality. Its Overall Rating runs from 1 to 5 stars, combining health inspections, staffing, and quality measures, with inspections weighted most heavily.

Center at Waterfront LLC

CMS overall rating Info CMS (the Centers for Medicare & Medicaid Services) is the federal agency that rates nursing home quality. Its Overall Rating runs from 1 to 5 stars, combining health inspections, staffing, and quality measures, with inspections weighted most heavily.
Calculator: See prices in your area
Center at Waterfront LLC accepts Medicare and private pay.

Overview of Center at Waterfront LLC

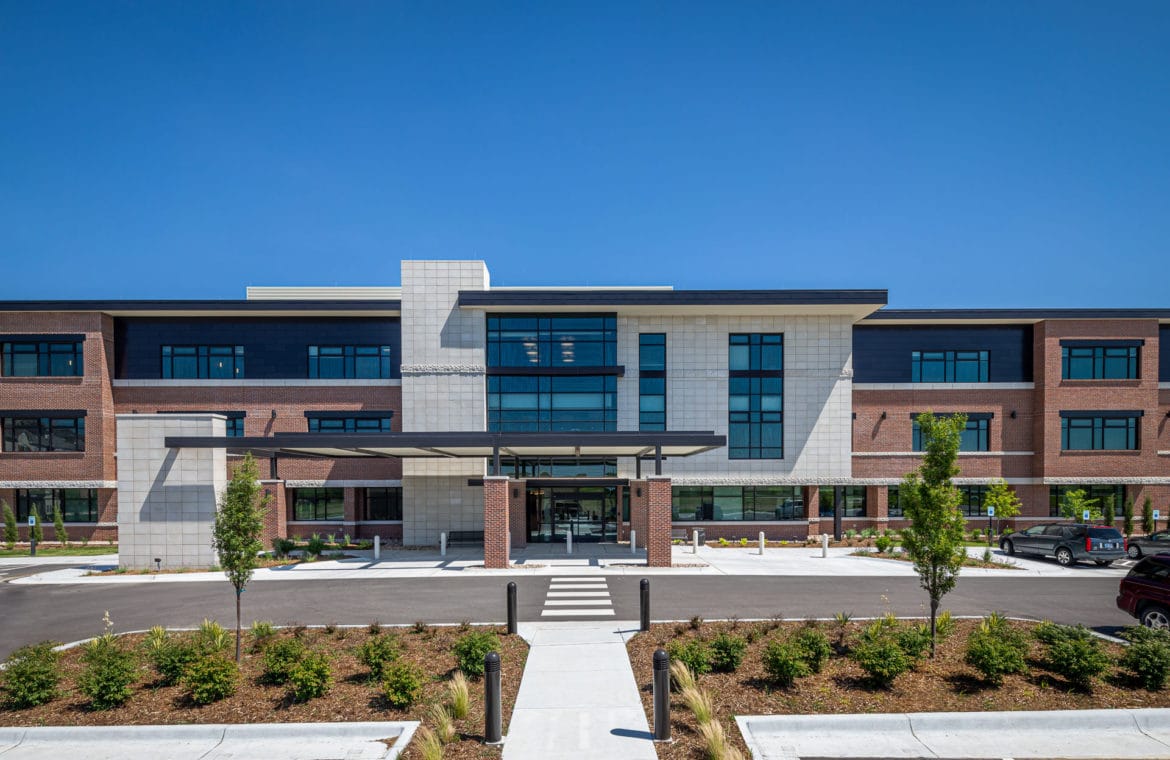
Center at Waterfront LLC runs an 80-bed skilled nursing facility on Lindberg Circle in Wichita, Kansas. The property is owned by Kenneth Deline, and the billing department handles standard payments through private pay and Medicare. With a Walk Score of 27, the surrounding area requires a car for most trips, meaning visitors and local families will generally need a vehicle to get to the campus.

Operations here center almost entirely on short-term medical rehab, which shows in the average length of stay of only 11 days. The facility is set up as a temporary pit stop to get patients safely back home after a hospital discharge rather than serving as a long-term home. To handle these quick turnarounds, the floor staff puts in 4 hours and 44 minutes of direct daily nursing care per resident.

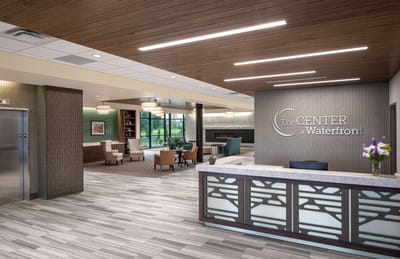
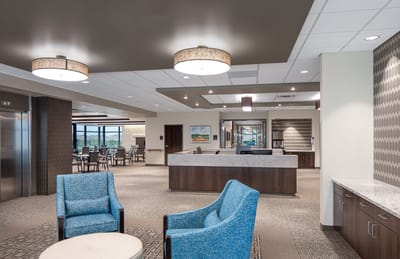
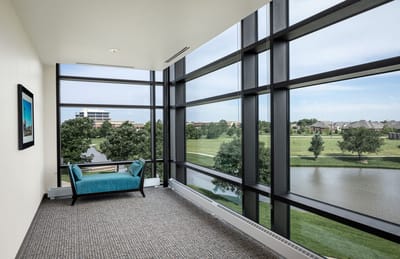
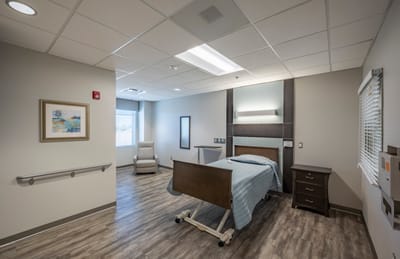
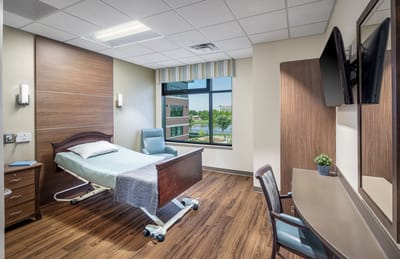
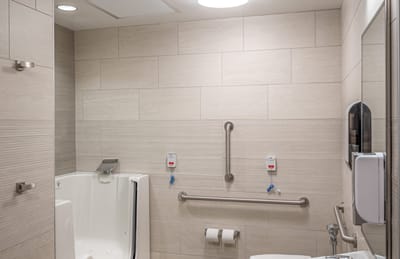
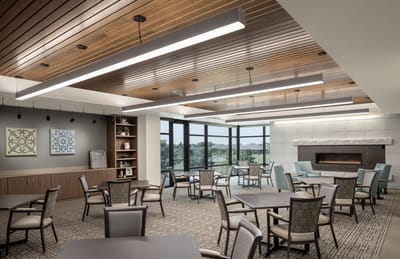
Registered nurses, LPNs, and nurse aides share these duties, covering physical therapy, medical monitoring, and psychological support. Because the setup is built for short-term recovery, the building features private suites with personal bathrooms, adjustable beds, Wi-Fi, a beauty salon, and a daily menu from an executive chef.

Families can call the admissions department to set up a tour of the private suites and check out the physical therapy setups. The office staff runs these walkthroughs while walking you through the intake paperwork, open bed numbers, and the weekly dining options.

Quality ratings

Measured by Centers for Medicare & Medicaid Services (CMS)

Overall rating Info The Overall CMS Rating combines results from health inspections, staffing levels and quality measures. Health inspections carry the most weight. Staffing and quality scores can increase or decrease the final rating based on performance compared to state and national standards.
▲ 3.8% Above KS avg. ▲ 3.8% Above KS avg.KS average: 2.9Click the badge to see the full State ranking.Click here to see the full State ranking.
Health Inspection Info Based on the results of the facility's three most recent standard inspections and any complaint investigations. CMS reviews the number, scope, and severity of deficiencies, with more recent findings weighted more heavily.
▼ 27.6% Below KS avg. ▼ 27.6% Below KS avg.KS average: 2.8Click the badge to see the full State ranking.Click here to see the full State ranking.
Staffing Info Measures average nursing staff hours per resident per day, including Registered Nurses (RNs) and total nursing staff. Ratings are adjusted based on the level of care residents require and are compared to state and national benchmarks.
▼ 42.2% Below KS avg. ▼ 42.2% Below KS avg.KS average: 3.5Click the badge to see the full State ranking.Click here to see the full State ranking.
Quality Measures Info Based on clinical and physical health indicators reported to CMS, such as hospital readmissions, falls, pressure ulcers, and improvements in mobility. These measures reflect how well residents' health needs are being managed.
▲ 61.7% Above KS avg. ▲ 61.7% Above KS avg.KS average: 3.1Click the badge to see the full State ranking.Click here to see the full State ranking.

Staffing hours breakdown

Info Daily nursing hours per resident by staff type, reported to CMS. Higher is generally better — compare this facility to state and national averages to see where staffing stands.

Hours per resident per day — compared to Kansas state averages

Total nursing care / resident Info Total adjusted nursing hours per resident per day, combining RN, LPN, and aide time. CMS adjusts this for case-mix so facilities can be fairly compared.
4h 44m per day
This facility Kansas avg (4h 38m per day)
vs Kansas avg
+2%

2 of 6 metrics below state avg

Standout metric LPN / LVN is +177% above state avg
Staff typeHours / Day / Residentvs state avg
Registered Nurse (RN) Info RNs hold the highest nursing license and can assess residents, interpret test results, and direct care plans. More RN hours per day often signals stronger clinical oversight and faster response to health changes. 26m per day ▼ 39% State avg: 42m per day · National avg: 41m per day
LPN / LVN Info Licensed Practical Nurses (LPNs) or Licensed Vocational Nurses (LVNs) deliver routine hands-on care — medication administration, wound dressing, and monitoring vital signs. They work under RN supervision and make up a large share of daily bedside care. 1h 50m per day ▲ 177% State avg: 40m per day · National avg: 52m per day
Nurse Aide Info Certified Nurse Aides (CNAs) provide the most direct day-to-day assistance: bathing, dressing, feeding, and mobility. Nurse aide hours are typically the largest staffing category and directly affect residents' quality of life. 2h 47m per day ▲ 4% State avg: 2h 41m per day · National avg: 2h 20m per day
Weekend Total Nursing Info Combined nursing hours (RN + LPN + Nurse Aide) per resident per day on weekends. Staffing often drops on weekends — this figure reveals whether the facility maintains adequate coverage outside of weekday hours. 4h 21m per day ▲ 20% State avg: 3h 38m per day · National avg: 3h 27m per day
Physical Therapist Info Hours per resident per day provided by licensed Physical Therapists (PTs) or PT Assistants. PT services help residents recover mobility after injury or illness and are especially important for post-acute (short-stay) rehabilitation. 6m per day ▲ 151% State avg: 2m per day · National avg: 4m per day
Weekend RN Info Registered nurse hours specifically on weekends. Facilities sometimes reduce RN presence on Saturdays and Sundays — a low weekend RN figure compared to weekday hours can indicate reduced clinical oversight when most administrative staff are absent. 17m per day ▼ 42% State avg: 29m per day · National avg: 29m per day

Capacity and availability

Avg. Length of Stay
11 days
Bed community size
80-bed community Rank #59 / 224Bed count — State benchmarkedThis home is ranked 59th out of 224 homes in Kansas. Shows this facility's certified or reported bed count compared to other Kansas facilities. Larger communities may offer more amenities, programs, and on-site services for residents and families.Rankings are based only on facilities in Kansas that report data for that category. Facilities without available data are excluded from the ranking.Click the rank badge to see the full State ranking.Click here to see the full State ranking.
A larger shared setting that may offer more common spaces and organized community services.
Walk Score
Walk Score: 27 / 100 Rank #274 / 363Walk Score — State benchmarkedThis home is ranked 274th out of 363 homes in Kansas. Shows how walkable this facility's neighborhood is compared to the average Walk Score across Kansas facilities. Higher scores benefit residents, families, and staff.Rankings are based only on facilities in Kansas that report data for that category. Facilities without available data are excluded from the ranking.Click the rank badge to see the full State ranking.Click here to see the full State ranking.
Somewhat walkable. A few nearby services may be reachable on foot, but most trips require transportation.

About this community

Occupancy

Occupancy rate
68%
Lower than the Kansas average: 79.5%
Occupied beds
54 / 80
Average occupied beds in Kansas homes 50 beds

License Details

Facility TypeNursing Facility
StatusActive
IssuanceJanuary 27, 2026
CountySedgwick
License Number175564
CMS Certification Number175564

Ownership & Operating Entity

Center at Waterfront LLC is legally operated by Center At Waterfront Llc, and administered by David E. Smith.

Owner NameEast Wichita Snf LLC

Payment & Insurance

1 service
Accept Medicare

Therapy & Rehabilitation

1 service
Rehabilitation Services

Amenities & Lifestyle

Private Suites With Private Bathrooms
Fully Adjustable Hospital Beds
Flat-Screen Tvs
Free Wireless Internet
Beauty Salon
Scenic Views
Specific ProgramsPhysical Rehabilitation, Medical Services, Fine Dining, Psychological Care

Contact Center at Waterfront LLC

Inspection History

In Kansas, the Department for Aging and Disability Services, Survey and Certification Commission performs the unannounced inspections required for facility licensing and federal certification.

Since 2020 · 6 years of data 47 deficiencies

Inspection Scorecard Info This scorecard compares key inspection, deficiency, and complaint metrics at this facility against the Kansas state average. Metrics rated ≥15% worse than average are highlighted in red; those ≥15% better are highlighted in green.

Since 2020 vs. Kansas state average
Overall vs. KS average 0 Worse No metrics in this bucket. 2 Better Metrics better than Kansas average:
• Total deficiencies (53% below)
• Deficiencies per year (53% below)
Latest Inspection April 1, 2026

Deficiencies Info Deficiencies are formal regulatory issues recorded during state inspections.

This FacilityKS Averagevs. KS Avg
Total deficiencies Info Formal regulatory issues recorded by inspectors across all inspection types. 47100 This facility has 53% fewer total deficiencies than a typical Kansas nursing home (47 vs. KS avg 100).↓ 53% better
Deficiencies per year Info Average deficiencies per year since 2020. 7.816.7 This facility has 53% fewer deficiencies per year than a typical Kansas nursing home (7.8 vs. KS avg 16.7).↓ 53% better

Inspection Reports Summary Info An editor-reviewed summary of the themes and findings across this facility's recent inspection reports.

  • The most recent inspection on April 2, 2025, identified a deficiency related to inadequate supervision and interventions to prevent the elopement of a cognitively impaired resident, which was corrected prior to the surveyor’s entrance. Earlier inspections showed multiple deficiencies primarily involving resident care, medication management, communication with dialysis providers, and sanitation in food preparation areas. Complaint investigations were mostly unsubstantiated except for the elopement incident that led to the April 2025 deficiency. No fines, immediate jeopardy findings beyond the elopement, or license actions were listed in the available reports. The facility had previously corrected all cited deficiencies by May 2024, but recent findings indicate some challenges in maintaining consistent supervision and care interventions.

Health Inspection History

Inspections since 2024
Total health inspections 2

Kansas average 4.5


Last Health inspection on Apr 2025

Total health citations
15

Kansas average 26.9

Citations per inspection
7.5

Kansas average 6.07


Health citations are formal notices following inspections when they fail to comply with safety and care standards.

14 of 15 citations resulted from standard inspections; and 1 of 15 resulted from complaint investigations.

Breakdown of citation severity (last 2 years)
Critical health citations
1
11% worse than Kansas average

Kansas average: 0.9


Serious health citations
0
100% better than Kansas average

Kansas average: 0.9

1 critical citation Kansas average: 0.9

0 serious citations Kansas average: 0.9

14 moderate citations Kansas average: 24.6

0 minor citations Kansas average: 0.5
Citations history (last 2 years)
Quality of Care critical citation Apr 02, 2025
Corrected

Environmental moderate citation Mar 18, 2024
Corrected

Nutrition moderate citation Mar 18, 2024
Corrected

Pharmacy moderate citation Mar 18, 2024
Corrected

Staffing Data

Reporting period: October 1 – December 31, 2025 (Q4 2025). Source: CMS Payroll-Based Journal report.

Total staff 245
Employees 110
Contractors 135
Staff to resident ratio 4.08 : 1
82% more staff per resident than Kansas average
Kansas average ratio: 2.24 : 1 Kansas average ratio: 2.24 : 1See full Kansas ranking
Avg staff/day 47
Average shift 7.8 hours
0% compared with Kansas average
Kansas average: 7.7 hours Kansas average shift: 7.7 hoursSee full Kansas ranking
Total staff hours (quarter) 33,917

Nursing staff breakdown

Q4 2025 · Oct 1 – Dec 31 More info This data comes from the CMS Payroll-Based Journal report covering October 1 – December 31, 2025.
Registered Nurse

Manages medical care and health needs.

RN Staff Info 32 total: 7 full-time employees and 25 contractors. 32
Average shift length Info Average shift length. Calculated as total hours divided by days worked and average staff per day. 7.8 hours
Licensed Practical Nurse

Assists with medical care and medications.

LPN Staff Info 55 total: 20 full-time employees and 35 contractors. 55
Average shift length Info Average shift length. Calculated as total hours divided by days worked and average staff per day. 9.2 hours
Certified Nursing Assistant

Helps with daily care and mobility.

CNA Staff Info 121 total: 46 full-time employees and 75 contractors. 121
Average shift length Info Average shift length. Calculated as total hours divided by days worked and average staff per day. 8 hours

Contractor staffing

Q4 2025 · Oct 1 – Dec 31 More info This data comes from the CMS Payroll-Based Journal report covering October 1 – December 31, 2025.

Total hours from contractors

10.8%

3,661 contractor hours this quarter

Certified Nursing Assistant: 75 Licensed Practical Nurse: 35 Registered Nurse: 25

Staff by category

Q4 2025 · Oct 1 – Dec 31 More info This data comes from the CMS Payroll-Based Journal report covering October 1 – December 31, 2025.
Certified Nursing Assistant467512114,78292100%8
Licensed Practical Nurse2035558,72892100%9.2
Speech Language Pathologist7072,3368795%6.6
Respiratory Therapist7071,8507885%6.4
Registered Nurse725321,2368491%7.8
RN Director of Nursing2021,0326672%8
Physical Therapy Assistant5059337076%6.5
Clinical Nurse Specialist2025806470%8.2
Respiratory Therapy Technician8085518390%4.6
Administrator1015286672%8
Other Dietary Services Staff1014896470%7.6
Nurse Practitioner2024806065%8
Qualified Social Worker2023915964%6.6
121 Certified Nursing Assistant
% of Days 100%
55 Licensed Practical Nurse
% of Days 100%
7 Speech Language Pathologist
% of Days 95%
7 Respiratory Therapist
% of Days 85%
32 Registered Nurse
% of Days 91%
2 RN Director of Nursing
% of Days 72%
5 Physical Therapy Assistant
% of Days 76%
2 Clinical Nurse Specialist
% of Days 70%
8 Respiratory Therapy Technician
% of Days 90%
1 Administrator
% of Days 72%
1 Other Dietary Services Staff
% of Days 70%
2 Nurse Practitioner
% of Days 65%
2 Qualified Social Worker
% of Days 64%

Penalties and fines

Federal penalties imposed by CMS for regulatory violations, including civil money penalties (fines) and denials of payment for new Medicare/Medicaid admissions.

Source: CMS Penalties Database

No penalties in the past 3 years

No civil money penalties or payment denials were reported in the last 3 years.

Quality of care over time

These measures show how residents usually do over time at this home, based on health outcomes and preventive care.

Short-stay resident measures
Pneumococcal Vaccine Info Percent of short-stay residents assessed and appropriately given the pneumococcal vaccine 96.6%
28% better than Kansas average

Kansas average: 75.6%

Antipsychotic medication increase Info Percent of short-stay residents who newly received an antipsychotic medication 1.0%
52% better than Kansas average

Kansas average: 2.2%

Influenza Vaccine Info Percent of short-stay residents assessed and appropriately given the seasonal influenza vaccine 89.2%
21% better than Kansas average

Kansas average: 73.5%

Breakdown by payment type

Medicare

73% of new residents, usually for short-term rehab.

Typical stay 23 days

Private pay

27% of new residents, often for short stays.

Typical stay 17 days

Facility Characteristics

Source: CMS Long-Term Care Facility Characteristics (Data as of Jan 2026)

Total residents 60
Medicare
59
98.3% of residents
Private pay or other
1
1.7% of residents
Programs & Services
Residents Group

Residents meet regularly to discuss policies, care quality, and activities

Active Resident Council

Organized group of residents that meets regularly to discuss facility policies, quality of life, and activities.

Finances and operations

Based on CMS SNF Cost Report for fiscal year ending in 12/2023.

For-profit
Corporation
Net patient revenue Info Net patient revenue — what the home actually collects for resident care, after contractual allowances, bad debt and discounts are subtracted from its gross charges (CMS cost report, Worksheet G-3). It covers resident care only; money the home earns from other sources is shown separately as "Other income."
$12.7M
Net patient income Info Net patient income: net patient revenue minus the home's total operating expenses. A positive figure means it earns more from resident care than it spends to deliver it; a negative figure means the opposite. It excludes non-operating "other income."
$41.2K
For-profit Corporation
Net patient revenue Info Net patient revenue — what the home actually collects for resident care, after contractual allowances, bad debt and discounts are subtracted from its gross charges (CMS cost report, Worksheet G-3). It covers resident care only; money the home earns from other sources is shown separately as "Other income."
$12.7M
Net patient income Info Net patient income: net patient revenue minus the home's total operating expenses. A positive figure means it earns more from resident care than it spends to deliver it; a negative figure means the opposite. It excludes non-operating "other income."
$41.2K
Other income Info Money the home earns outside of resident care — such as investments, grants, rentals and other non-operating sources (CMS cost report, Worksheet G-3). It is tracked separately from net patient revenue: it is not part of that figure, and it is not included in net patient income.
$2.8M
Payroll costs Info Staff salaries plus wage-related costs — benefits such as payroll taxes, health insurance and retirement — from the home's own accounting records (CMS cost report, Worksheet A). Contract or agency labor is counted separately, under other operating costs.
$6.6M 51.8% of net patient revenue Info Payroll as a share of revenue: staff salaries and wage-related benefits divided by net patient revenue. A higher figure means more of each revenue dollar goes to staff pay.
Other operating costs Info Everything it costs to run the home apart from payroll — food, utilities, supplies, maintenance, contract labor and administration. Calculated as total operating expense minus payroll (staff salaries and wage-related benefits).
$6.1M
Total costs Info The home's total operating expense for the year — all the costs of running it, salaries included (CMS cost report, Worksheet G-3).
$12.6M

Who this home usually serves

TYPE OF STAY

Mostly short-term rehab stays

Most residents typically stay for a few weeks or months before returning home or moving on.

Most new residents arrive under Medicare (73% of admissions), and a typical Medicare stay runs around 23 days.

Admissions
1,123 total

Coverage residents most often arrive under.

Medicare 73%
Private pay 27%
Discharges
2,208 total

Coverage residents most often leave under.

Medicare 37%
Private pay 63%

Places of interest near Center at Waterfront LLC

Address 5.8 miles from city center Info Estimated distance in miles from Wichita's city center to Center at Waterfront LLC's address, calculated via Google Maps.

Calculate Travel Distance to Center at Waterfront LLC

Add your location

Address

Compare Nursing Homes around Wichita

The information below is reported by the Kansas Department for Aging and Disability Services.

5 facilities compared · CMS & KS Dept. of Health data

Regent Park Rehabilitation and Healthcare
NH
AL
HC
IL
MC
NC
RC
Wichita (Bradford Place)
84
Facility 84
KS AVG 69
Rank #54 / 224
83.1% +5%5.17 +6%+12%$0144.7-71-
28
Facility 28
KS AVG 46
Rank #269 / 363
Legend Senior Properties$10.9M$6.7M61.5%175527
Larksfield Place Independent Living
NH
AL
IL
MC
RC
Wichita
80
Facility 80
KS AVG 69
Rank #59 / 224
92.7% +17%5.57 -8%+20%$0134.3-80A+
32
Facility 32
KS AVG 46
Rank #252 / 363
Larksfield Place Retirement Communities, Inc$24.9M$11.8M47.4%175181
Hilltop Manor
NH
HC
Cunningham
45
Facility 45
KS AVG 69
Rank #152 / 224
58.8% -26%4.19 -33%-10%$0103.3138-
20
Facility 20
KS AVG 46
Rank #311 / 363
Darcy Kemmis$4.0M$2.4M60.8%175545
Ascension Living Via Christi Village Ridge
NH
ADC
AL
IL
MC
Wichita
80
Facility 80
KS AVG 69
Rank #59 / 224
88.7% +12%4.47 -6%-4%$0162.7271-
25
Facility 25
KS AVG 46
Rank #282 / 363
Trisha Chege$13.8M$6.5M46.8%175539
Center at Waterfront LLC
NH
Wichita
80
Facility 80
KS AVG 69
Rank #59 / 224
67.5% -15%4.73 +29%+2%$12.7k157.5158-
27
Facility 27
KS AVG 46
Rank #274 / 363
Kenneth Deline$12.7M$6.6M51.8%175564

Financial Assistance for
Nursing Home in Kansas

Center at Waterfront LLC is located in WICHITA, Kansas.
Here are the financial assistance programs available to residents in Kansas.

Get Financial aid guidance

Frail Elderly Waiver

Kansas Medicaid FE Waiver

Age 65+
General Kansas resident, Medicaid-eligible, nursing home- level care need.
Income Limits (2025) ~$2,829/month 300% FBR, individual
Asset Limits $2,000 (individual), $3,000 (couple).
KS

Requires care level assessment.

Benefits
Personal care (5-7 hours/day) Respite (240 hours/year) Adult day care (~$60/day) Home aides

Senior Care Act

Kansas SCA

Age 60+
General Kansas resident, at risk of nursing home.
Income Limits ~$1,800/month individual, varies
Asset Limits $2,000 individual
KS

Limited funding; waitlists common.

Benefits
In-home care (3-5 hours/week) Respite (up to 10 days/year) Homemaker services

Medicare Savings Program (MSP)

Kansas Medicare Savings Program

Age 65+ or disabled
General Kansas resident, Medicare Part A/B.
Income Limits (2025) ~$2,510/month (QMB), ~$3,380/month (SLMB), ~$3,598/month (QI)—individual.
Asset Limits $9,430 (individual), $14,130 (couple).
KS

Three tiers; no waitlist.

Benefits
Covers Part B premiums ($174.70/month) Deductibles ($240/year) Copays (~20%)

National Family Caregiver Support Program (NFCSP) Respite

Kansas NFCSP Respite Care

Age
General Caregivers of 60+ needing care or 55+ caregivers of others; Kansas resident; functional needs (2+ ADLs).
Income Limits (2025) Prioritizes ~$24,980/year (individual); no strict cap.
Asset Limits Not assessed; need-based.
KS

11 AAAs; prioritizes low-income, rural caregivers.

Benefits
Respite (4-6 hours/week or 5 days/year) Adult day care ($60/day) Caregiver training

VA Aid and Attendance (A&A) and Housebound Benefits

Kansas VA Aid and Attendance/Housebound

Age 65+ or disabled veteran/spouse
General Kansas resident, wartime service, need for ADL help (A&A) or homebound.
Income Limits (2025) Net income < ~$1,984/month (veteran with dependent, A&A); pension offsets income.
Asset Limits ~$155,356 net worth limit
KS

High veteran demand in rural/urban areas.

Benefits
Cash (~$1,433-$2,642/month veteran, ~$951-$1,318 spouse) for care costs (e.g., in-home, assisted living)

Frequently Asked Questions about Center at Waterfront LLC

Who is the owner of Center at Waterfront LLC?

Center at Waterfront LLC is legally operated by East Wichita Snf Llc, and administered by David E. Smith.

Is Center at Waterfront LLC in a walkable area?

Center at Waterfront LLC has a walk score of 27. Somewhat walkable. A few nearby services may be reachable on foot, but most trips require transportation.

What is the license number of Center at Waterfront LLC?

According to KS state health department records, Center at Waterfront LLC's license number is 175564.

What is the occupancy rate at Center at Waterfront LLC?

Center at Waterfront LLC's occupancy is 68%.

Does Center at Waterfront LLC operate as a for-profit or non-profit?

Center at Waterfront LLC is registered as a for-profit in KS.

Who is the administrator of Center at Waterfront LLC?

David E. Smith is the administrator of Center at Waterfront LLC.

How many beds does Center at Waterfront LLC have?

Center at Waterfront LLC has 80 beds.

Guides for Better Senior Living

Care Cost Calculator: See Prices in Your Area

Nursing Home Data Explorer

Don’t Wait Too Long: 7 Red Flag Signs Your Parent Needs Assisted Living Now

The True Cost of Assisted Living in 2025 – And How Families Are Paying For It

Understanding Senior Living Costs: Pricing Models, Discounts & Financial Assistance