Ascension Living Via Christi Village Ridge
Nursing Home, Adult Day Care, Assisted Living, Independent Living & Memory Care · Wichita, KS
CMS overall rating Info CMS (the Centers for Medicare & Medicaid Services) is the federal agency that rates nursing home quality. Its Overall Rating runs from 1 to 5 stars, combining health inspections, staffing, and quality measures, with inspections weighted most heavily.

Ascension Living Via Christi Village Ridge

Nursing Home, Adult Day Care, Assisted Living, Independent Living & Memory Care · Wichita, KS
CMS overall rating Info CMS (the Centers for Medicare & Medicaid Services) is the federal agency that rates nursing home quality. Its Overall Rating runs from 1 to 5 stars, combining health inspections, staffing, and quality measures, with inspections weighted most heavily.
Calculator: See prices in your area
Ascension Living Via Christi Village Ridge accepts Medicare and private pay.

Overview of Ascension Living Via Christi Village Ridge

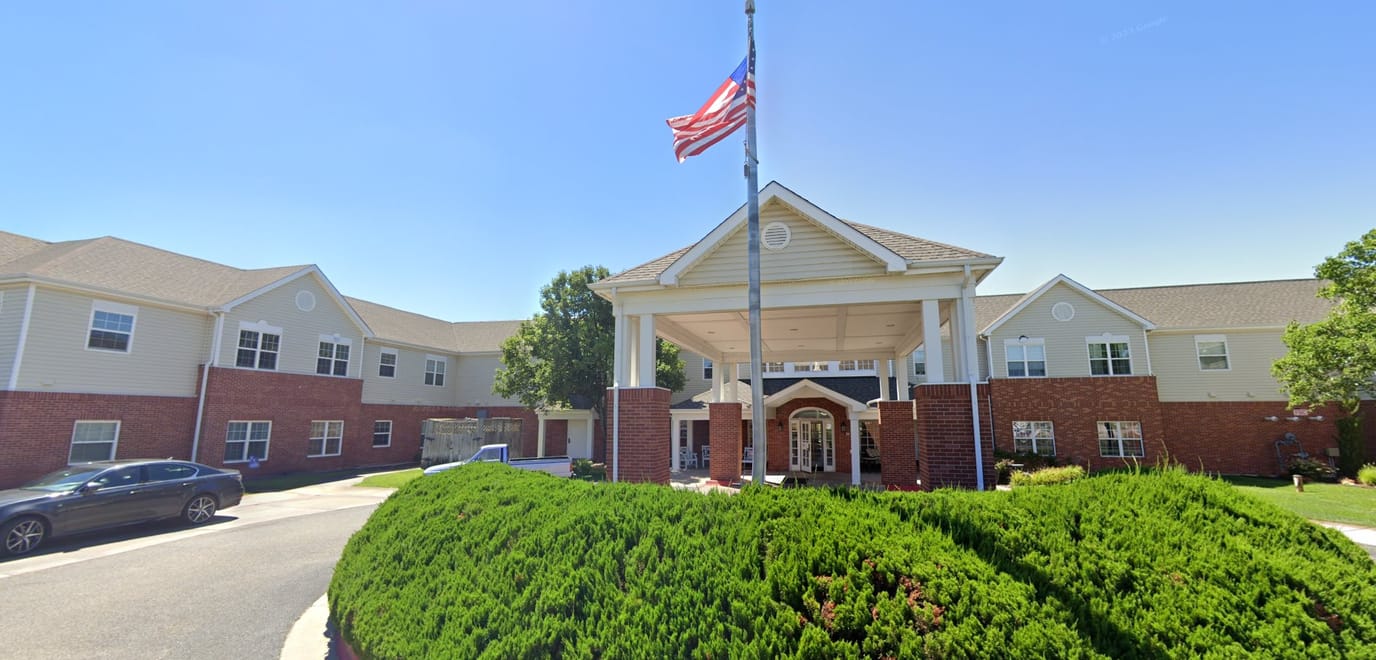
Ascension Living is a comfortable assisted living community offering skilled nursing and rehabilitation. The community promotes social, recreational, spiritual, and educational activities to their residents to cultivate their mental and physical abilities. Many of the services provided are centered on the comfort of healing. Ascension Living’s goal is to have their residents age with grace and thrive with physical ability; through their personalized care service, residents can transfer between assisted living and skilled nursing– depending on the healthcare need. Staff members make it a point to promote a safe, secure, and comfortable environment for their residents. Ascension Living proudly welcomes whatever faith, ready to attend and enhance your quality of life.

Ascension Living ensures everything is conveniently provided for seniors, making it a point that they just sit back and relax. Management ensures that residents relax and pursue an active lifestyle through the range of cultural, spiritual, and social opportunities that await them. Community amenities are maintenance free, so residents can enjoy seamless access to living spaces like a lounge room, Chapel, fitness center, and cafe. Other services include the essential housekeeping, laundry, and transportation. 

Quality ratings

Measured by Centers for Medicare & Medicaid Services (CMS)

Overall rating Info The Overall CMS Rating combines results from health inspections, staffing levels and quality measures. Health inspections carry the most weight. Staffing and quality scores can increase or decrease the final rating based on performance compared to state and national standards.
▲ 38.3% Above KS avg. ▲ 38.3% Above KS avg.KS average: 2.9Click the badge to see the full State ranking.Click here to see the full State ranking.
Health Inspection Info Based on the results of the facility's three most recent standard inspections and any complaint investigations. CMS reviews the number, scope, and severity of deficiencies, with more recent findings weighted more heavily.
▼ 27.6% Below KS avg. ▼ 27.6% Below KS avg.KS average: 2.8Click the badge to see the full State ranking.Click here to see the full State ranking.
Staffing Info Measures average nursing staff hours per resident per day, including Registered Nurses (RNs) and total nursing staff. Ratings are adjusted based on the level of care residents require and are compared to state and national benchmarks.
▲ 44.6% Above KS avg. ▲ 44.6% Above KS avg.KS average: 3.5Click the badge to see the full State ranking.Click here to see the full State ranking.
Quality Measures Info Based on clinical and physical health indicators reported to CMS, such as hospital readmissions, falls, pressure ulcers, and improvements in mobility. These measures reflect how well residents' health needs are being managed.
▲ 61.7% Above KS avg. ▲ 61.7% Above KS avg.KS average: 3.1Click the badge to see the full State ranking.Click here to see the full State ranking.

Staffing hours breakdown

Info Daily nursing hours per resident by staff type, reported to CMS. Higher is generally better — compare this facility to state and national averages to see where staffing stands.

Hours per resident per day — compared to Kansas state averages

Total nursing care / resident Info Total adjusted nursing hours per resident per day, combining RN, LPN, and aide time. CMS adjusts this for case-mix so facilities can be fairly compared.
4h 28m per day
This facility Kansas avg (4h 38m per day)
vs Kansas avg
-4%

1 of 6 metrics below state avg

Standout metric Physical Therapist is +62% above state avg
Staff typeHours / Day / Residentvs state avg
Registered Nurse (RN) Info RNs hold the highest nursing license and can assess residents, interpret test results, and direct care plans. More RN hours per day often signals stronger clinical oversight and faster response to health changes. 1h 8m per day ▲ 60% State avg: 42m per day · National avg: 41m per day
LPN / LVN Info Licensed Practical Nurses (LPNs) or Licensed Vocational Nurses (LVNs) deliver routine hands-on care — medication administration, wound dressing, and monitoring vital signs. They work under RN supervision and make up a large share of daily bedside care. 58m per day ▲ 46% State avg: 40m per day · National avg: 52m per day
Nurse Aide Info Certified Nurse Aides (CNAs) provide the most direct day-to-day assistance: bathing, dressing, feeding, and mobility. Nurse aide hours are typically the largest staffing category and directly affect residents' quality of life. 2h 19m per day ▼ 14% State avg: 2h 41m per day · National avg: 2h 20m per day
Weekend Total Nursing Info Combined nursing hours (RN + LPN + Nurse Aide) per resident per day on weekends. Staffing often drops on weekends — this figure reveals whether the facility maintains adequate coverage outside of weekday hours. 3h 57m per day ▲ 9% State avg: 3h 38m per day · National avg: 3h 27m per day
Physical Therapist Info Hours per resident per day provided by licensed Physical Therapists (PTs) or PT Assistants. PT services help residents recover mobility after injury or illness and are especially important for post-acute (short-stay) rehabilitation. 4m per day ▲ 62% State avg: 2m per day · National avg: 4m per day
Weekend RN Info Registered nurse hours specifically on weekends. Facilities sometimes reduce RN presence on Saturdays and Sundays — a low weekend RN figure compared to weekday hours can indicate reduced clinical oversight when most administrative staff are absent. 46m per day ▲ 56% State avg: 29m per day · National avg: 29m per day

Capacity and availability

This home usually has limited availability

Higher occupancy than the Kansas average: 79.5%
Occupancy rate
88.7%
Avg. Length of Stay
36 days
Bed community size
80-bed community Rank #59 / 224Bed count — State benchmarkedThis home is ranked 59th out of 224 homes in Kansas. Shows this facility's certified or reported bed count compared to other Kansas facilities. Larger communities may offer more amenities, programs, and on-site services for residents and families.Rankings are based only on facilities in Kansas that report data for that category. Facilities without available data are excluded from the ranking.Click the rank badge to see the full State ranking.Click here to see the full State ranking.
A larger shared setting that may offer more common spaces and organized community services.
Walk Score
Walk Score: 25 / 100 Rank #282 / 363Walk Score — State benchmarkedThis home is ranked 282nd out of 363 homes in Kansas. Shows how walkable this facility's neighborhood is compared to the average Walk Score across Kansas facilities. Higher scores benefit residents, families, and staff.Rankings are based only on facilities in Kansas that report data for that category. Facilities without available data are excluded from the ranking.Click the rank badge to see the full State ranking.Click here to see the full State ranking.
Somewhat walkable. A few nearby services may be reachable on foot, but most trips require transportation.

Therapy & Rehabilitation

1 service
Rehabilitation Services

Additional Services

1 service
Memory Support

Contact Ascension Living Via Christi Village Ridge

Staffing Data

Reporting period: October 1 – December 31, 2025 (Q4 2025). Source: CMS Payroll-Based Journal report.

Total staff 148
Employees 111
Contractors 37
Staff to resident ratio 2.00 : 1
11% fewer staff per resident than Kansas average
Kansas average ratio: 2.24 : 1 Kansas average ratio: 2.24 : 1See full Kansas ranking
Avg staff/day 48
Average shift 8 hours
0% compared with Kansas average
Kansas average: 7.7 hours Kansas average shift: 7.7 hoursSee full Kansas ranking
Total staff hours (quarter) 35,249

Nursing staff breakdown

Q4 2025 · Oct 1 – Dec 31 More info This data comes from the CMS Payroll-Based Journal report covering October 1 – December 31, 2025.
Registered Nurse

Manages medical care and health needs.

RN Staff Info All 14 RN Staff are full-time employees. No contractors work on this role. 14
Average shift length Info Average shift length. Calculated as total hours divided by days worked and average staff per day. 9.7 hours
Licensed Practical Nurse

Assists with medical care and medications.

LPN Staff Info All 17 LPN Staff are full-time employees. No contractors work on this role. 17
Average shift length Info Average shift length. Calculated as total hours divided by days worked and average staff per day. 9.1 hours
Certified Nursing Assistant

Helps with daily care and mobility.

CNA Staff Info 61 total: 60 full-time employees and 1 contractor. 61
Average shift length Info Average shift length. Calculated as total hours divided by days worked and average staff per day. 8 hours

Contractor staffing

Q4 2025 · Oct 1 – Dec 31 More info This data comes from the CMS Payroll-Based Journal report covering October 1 – December 31, 2025.

Total hours from contractors

9.2%

3,258 contractor hours this quarter

Qualified Social Worker: 9 Speech Language Pathologist: 8 Respiratory Therapy Technician: 8 Physical Therapy Aide: 5 Occupational Therapy Aide: 4 Physical Therapy Assistant: 2 Certified Nursing Assistant: 1

Staff by category

Q4 2025 · Oct 1 – Dec 31 More info This data comes from the CMS Payroll-Based Journal report covering October 1 – December 31, 2025.
Certified Nursing Assistant6016114,24792100%8
Licensed Practical Nurse170176,32292100%9.1
Registered Nurse140145,24792100%9.7
Other Dietary Services Staff4041,8187784%7.6
Clinical Nurse Specialist4041,6736672%7.2
Speech Language Pathologist0881,4067278%6.1
Dental Services Staff2029006470%7.9
Medication Aide/Technician8088667076%7.1
Nurse Practitioner1014886166%8
Physical Therapy Aide0554845964%6.3
Administrator1014405560%8
Respiratory Therapy Technician0884366166%5.3
Qualified Social Worker0993836975%3.6
Physical Therapy Assistant0222885863%5
Occupational Therapy Aide0442514043%5.5
61 Certified Nursing Assistant
% of Days 100%
17 Licensed Practical Nurse
% of Days 100%
14 Registered Nurse
% of Days 100%
4 Other Dietary Services Staff
% of Days 84%
4 Clinical Nurse Specialist
% of Days 72%
8 Speech Language Pathologist
% of Days 78%
2 Dental Services Staff
% of Days 70%
8 Medication Aide/Technician
% of Days 76%
1 Nurse Practitioner
% of Days 66%
5 Physical Therapy Aide
% of Days 64%
1 Administrator
% of Days 60%
8 Respiratory Therapy Technician
% of Days 66%
9 Qualified Social Worker
% of Days 75%
2 Physical Therapy Assistant
% of Days 63%
4 Occupational Therapy Aide
% of Days 43%

Penalties and fines

Federal penalties imposed by CMS for regulatory violations, including civil money penalties (fines) and denials of payment for new Medicare/Medicaid admissions.

Source: CMS Penalties Database

No penalties in the past 3 years

No civil money penalties or payment denials were reported in the last 3 years.

Quality of care over time

These measures show how residents usually do over time at this home, based on health outcomes and preventive care.

High-risk clinical events score Info A composite score based on pressure ulcers, falls with injury, weight loss, walking ability decline, and activities of daily living decline. 12.2
16% worse than Kansas average

Kansas average: 10.5

Functional decline score Info A composite score based on activities of daily living decline, walking ability decline, and incontinence. 25.6
24% worse than Kansas average

Kansas average: 20.7

Long-stay resident measures
Need for Help with Daily Activities Increased Info Percent of long-stay residents whose need for help with daily activities has increased 16.4%
14% better than Kansas average

Kansas average: 19.0%

Walking Ability Worsened Info Percent of long-stay residents whose ability to move independently worsened 30.9%
59% worse than Kansas average

Kansas average: 19.4%

Low Risk Residents with Bowel/Bladder Incontinence Info Percent of low risk long-stay residents who lose control of their bowels or bladder 29.6%
24% worse than Kansas average

Kansas average: 23.8%

Falls with Major Injury Info Percent of long-stay residents experiencing one or more falls with major injury 5.4%
22% worse than Kansas average

Kansas average: 4.4%

High Risk Residents with Pressure Ulcers Info Percent of long-stay high risk residents with pressure ulcers 4.6%
In line with Kansas average

Kansas average: 4.6%

Urinary Tract Infection Info Percent of long-stay residents with a urinary tract infection 0.6%
80% better than Kansas average

Kansas average: 3.1%

Lost Too Much Weight Info Percent of long-stay residents who lose too much weight 3.6%
30% better than Kansas average

Kansas average: 5.1%

Depressive Symptoms Info Percent of long-stay residents who have depressive symptoms 2.7%
49% better than Kansas average

Kansas average: 5.2%

Antipsychotic Use Info Percent of long-stay residents who received an antipsychotic medication 2.4%
86% better than Kansas average

Kansas average: 16.9%

Pneumococcal Vaccine Info Percent of long-stay residents assessed and appropriately given the pneumococcal vaccine 98.2%
7% better than Kansas average

Kansas average: 91.9%

Influenza Vaccine Info Percent of long-stay residents assessed and appropriately given the seasonal influenza vaccine 100.0%
5% better than Kansas average

Kansas average: 95.5%

Short-stay resident measures
Pneumococcal Vaccine Info Percent of short-stay residents assessed and appropriately given the pneumococcal vaccine 94.8%
25% better than Kansas average

Kansas average: 75.6%

Antipsychotic medication increase Info Percent of short-stay residents who newly received an antipsychotic medication 0.3%
88% better than Kansas average

Kansas average: 2.2%

Influenza Vaccine Info Percent of short-stay residents assessed and appropriately given the seasonal influenza vaccine 96.1%
31% better than Kansas average

Kansas average: 73.5%

Breakdown by payment type

Medicare

42% of new residents, usually for short-term rehab.

Typical stay 17 days

Private pay

58% of new residents, often for short stays.

Typical stay 3 - 4 months

Facility Characteristics

Source: CMS Long-Term Care Facility Characteristics (Data as of Jan 2026)

Total residents 74
Medicare
26
35.1% of residents
Medicaid
18
24.3% of residents
Private pay or other
30
40.5% of residents
Programs & Services
Residents Group

Residents meet regularly to discuss policies, care quality, and activities

Active Resident Council

Organized group of residents that meets regularly to discuss facility policies, quality of life, and activities.

Finances and operations

Based on CMS SNF Cost Report for fiscal year ending in 06/2024.

Nonprofit
Nonprofit Corporation
Net patient revenue Info Net patient revenue — what the home actually collects for resident care, after contractual allowances, bad debt and discounts are subtracted from its gross charges (CMS cost report, Worksheet G-3). It covers resident care only; money the home earns from other sources is shown separately as "Other income."
$13.8M
Net patient income Info Net patient income: net patient revenue minus the home's total operating expenses. A positive figure means it earns more from resident care than it spends to deliver it; a negative figure means the opposite. It excludes non-operating "other income."
$101.4K
Nonprofit Nonprofit Corporation
Net patient revenue Info Net patient revenue — what the home actually collects for resident care, after contractual allowances, bad debt and discounts are subtracted from its gross charges (CMS cost report, Worksheet G-3). It covers resident care only; money the home earns from other sources is shown separately as "Other income."
$13.8M
Net patient income Info Net patient income: net patient revenue minus the home's total operating expenses. A positive figure means it earns more from resident care than it spends to deliver it; a negative figure means the opposite. It excludes non-operating "other income."
$101.4K
Other income Info Money the home earns outside of resident care — such as investments, grants, rentals and other non-operating sources (CMS cost report, Worksheet G-3). It is tracked separately from net patient revenue: it is not part of that figure, and it is not included in net patient income.
$79.7K
Payroll costs Info Staff salaries plus wage-related costs — benefits such as payroll taxes, health insurance and retirement — from the home's own accounting records (CMS cost report, Worksheet A). Contract or agency labor is counted separately, under other operating costs.
$6.5M 46.8% of net patient revenue Info Payroll as a share of revenue: staff salaries and wage-related benefits divided by net patient revenue. A higher figure means more of each revenue dollar goes to staff pay.
Other operating costs Info Everything it costs to run the home apart from payroll — food, utilities, supplies, maintenance, contract labor and administration. Calculated as total operating expense minus payroll (staff salaries and wage-related benefits).
$7.2M
Total costs Info The home's total operating expense for the year — all the costs of running it, salaries included (CMS cost report, Worksheet G-3).
$13.7M

Who this home usually serves

TYPE OF STAY

Mix of rehab and long-term care

This home supports both short-term rehab and long-term care, with residents staying for a wide range of durations.

Most new residents arrive under private pay (58% of admissions), and a typical private pay stay runs around 3 - 4 months.

Admissions
714 total

Coverage residents most often arrive under.

Medicare 42%
Private pay 58%
Discharges
715 total

Coverage residents most often leave under.

Medicare 39%
Private pay 61%

Places of interest near Ascension Living Via Christi Village Ridge

Address 8.7 miles from city center Info Estimated distance in miles from Wichita's city center to Ascension Living Via Christi Village Ridge's address, calculated via Google Maps.

Calculate Travel Distance to Ascension Living Via Christi Village Ridge

Add your location

Address

Compare Nursing Homes around Wichita

The information below is reported by the Kansas Department for Aging and Disability Services.

5 facilities compared · CMS & KS Dept. of Health data

Regent Park Rehabilitation and Healthcare
NH
AL
HC
IL
MC
NC
RC
Wichita (Bradford Place)
84
Facility 84
KS AVG 69
Rank #54 / 224
83.1% +5%5.17 +6%+12%$0144.7-71-
28
Facility 28
KS AVG 46
Rank #269 / 363
Legend Senior Properties$10.9M$6.7M61.5%175527
Larksfield Place Independent Living
NH
AL
IL
MC
RC
Wichita
80
Facility 80
KS AVG 69
Rank #59 / 224
92.7% +17%5.57 -8%+20%$0134.3-80A+
32
Facility 32
KS AVG 46
Rank #252 / 363
Larksfield Place Retirement Communities, Inc$24.9M$11.8M47.4%175181
Hilltop Manor
NH
HC
Cunningham
45
Facility 45
KS AVG 69
Rank #152 / 224
58.8% -26%4.19 -33%-10%$0103.3138-
20
Facility 20
KS AVG 46
Rank #311 / 363
Darcy Kemmis$4.0M$2.4M60.8%175545
Ascension Living Via Christi Village Ridge
NH
ADC
AL
IL
MC
Wichita
80
Facility 80
KS AVG 69
Rank #59 / 224
88.7% +12%4.47 -6%-4%$0162.7271-
25
Facility 25
KS AVG 46
Rank #282 / 363
Trisha Chege$13.8M$6.5M46.8%175539
Eureka Nursing
NH
HC
Eureka
58
Facility 58
KS AVG 69
Rank #115 / 224
74.1% -7%4.78 +58%+3%$23.9k287.0345-
21
Facility 21
KS AVG 46
Rank #305 / 363
Jolene Signhateh$4.5M$2.5M54.5%175287

Financial Assistance for
Nursing Home in Kansas

Ascension Living Via Christi Village Ridge is located in Wichita, Kansas.
Here are the financial assistance programs available to residents in Kansas.

Get Financial aid guidance

Frail Elderly Waiver

Kansas Medicaid FE Waiver

Age 65+
General Kansas resident, Medicaid-eligible, nursing home- level care need.
Income Limits (2025) ~$2,829/month 300% FBR, individual
Asset Limits $2,000 (individual), $3,000 (couple).
KS

Requires care level assessment.

Benefits
Personal care (5-7 hours/day) Respite (240 hours/year) Adult day care (~$60/day) Home aides

Senior Care Act

Kansas SCA

Age 60+
General Kansas resident, at risk of nursing home.
Income Limits ~$1,800/month individual, varies
Asset Limits $2,000 individual
KS

Limited funding; waitlists common.

Benefits
In-home care (3-5 hours/week) Respite (up to 10 days/year) Homemaker services

Medicare Savings Program (MSP)

Kansas Medicare Savings Program

Age 65+ or disabled
General Kansas resident, Medicare Part A/B.
Income Limits (2025) ~$2,510/month (QMB), ~$3,380/month (SLMB), ~$3,598/month (QI)—individual.
Asset Limits $9,430 (individual), $14,130 (couple).
KS

Three tiers; no waitlist.

Benefits
Covers Part B premiums ($174.70/month) Deductibles ($240/year) Copays (~20%)

National Family Caregiver Support Program (NFCSP) Respite

Kansas NFCSP Respite Care

Age
General Caregivers of 60+ needing care or 55+ caregivers of others; Kansas resident; functional needs (2+ ADLs).
Income Limits (2025) Prioritizes ~$24,980/year (individual); no strict cap.
Asset Limits Not assessed; need-based.
KS

11 AAAs; prioritizes low-income, rural caregivers.

Benefits
Respite (4-6 hours/week or 5 days/year) Adult day care ($60/day) Caregiver training

VA Aid and Attendance (A&A) and Housebound Benefits

Kansas VA Aid and Attendance/Housebound

Age 65+ or disabled veteran/spouse
General Kansas resident, wartime service, need for ADL help (A&A) or homebound.
Income Limits (2025) Net income < ~$1,984/month (veteran with dependent, A&A); pension offsets income.
Asset Limits ~$155,356 net worth limit
KS

High veteran demand in rural/urban areas.

Benefits
Cash (~$1,433-$2,642/month veteran, ~$951-$1,318 spouse) for care costs (e.g., in-home, assisted living)

Frequently Asked Questions about Ascension Living Via Christi Village Ridge

Is Ascension Living Via Christi Village Ridge in a walkable area?

Ascension Living Via Christi Village Ridge has a walk score of 25. Somewhat walkable. A few nearby services may be reachable on foot, but most trips require transportation.

What is the occupancy rate at Ascension Living Via Christi Village Ridge?

Ascension Living Via Christi Village Ridge's occupancy is 88.7%.

Does Ascension Living Via Christi Village Ridge operate as a for-profit or non-profit?

Ascension Living Via Christi Village Ridge is registered as a non-profit.

Are there photos of Ascension Living Via Christi Village Ridge?

Yes — there is 1 photo of Ascension Living Via Christi Village Ridge in the photo gallery on this page.

What is the address of Ascension Living Via Christi Village Ridge?

Ascension Living Via Christi Village Ridge is located at 3636 N Ridge Rd Building 400, Wichita, KS 67205.

What is the phone number of Ascension Living Via Christi Village Ridge?

(316) 462-3636 will put you in contact with the team at Ascension Living Via Christi Village Ridge.

Is Ascension Living Via Christi Village Ridge Medicare or Medicaid certified?

Yes — Ascension Living Via Christi Village Ridge is a CMS-certified provider of Medicare and Medicaid.

Guides for Better Senior Living

Care Cost Calculator: See Prices in Your Area

Nursing Home Data Explorer

Don’t Wait Too Long: 7 Red Flag Signs Your Parent Needs Assisted Living Now

The True Cost of Assisted Living in 2025 – And How Families Are Paying For It

Understanding Senior Living Costs: Pricing Models, Discounts & Financial Assistance