Wesley Towers Inc
Nursing Home, Assisted Living, Independent Living & Memory Care · Hutchinson, KS
CMS overall rating Info CMS (the Centers for Medicare & Medicaid Services) is the federal agency that rates nursing home quality. Its Overall Rating runs from 1 to 5 stars, combining health inspections, staffing, and quality measures, with inspections weighted most heavily.

Wesley Towers Inc

Nursing Home, Assisted Living, Independent Living & Memory Care · Hutchinson, KS
CMS overall rating Info CMS (the Centers for Medicare & Medicaid Services) is the federal agency that rates nursing home quality. Its Overall Rating runs from 1 to 5 stars, combining health inspections, staffing, and quality measures, with inspections weighted most heavily.
Calculator: See prices in your area
Wesley Towers Inc accepts Medicare, Medicaid, and private pay.

Overview of Wesley Towers INC

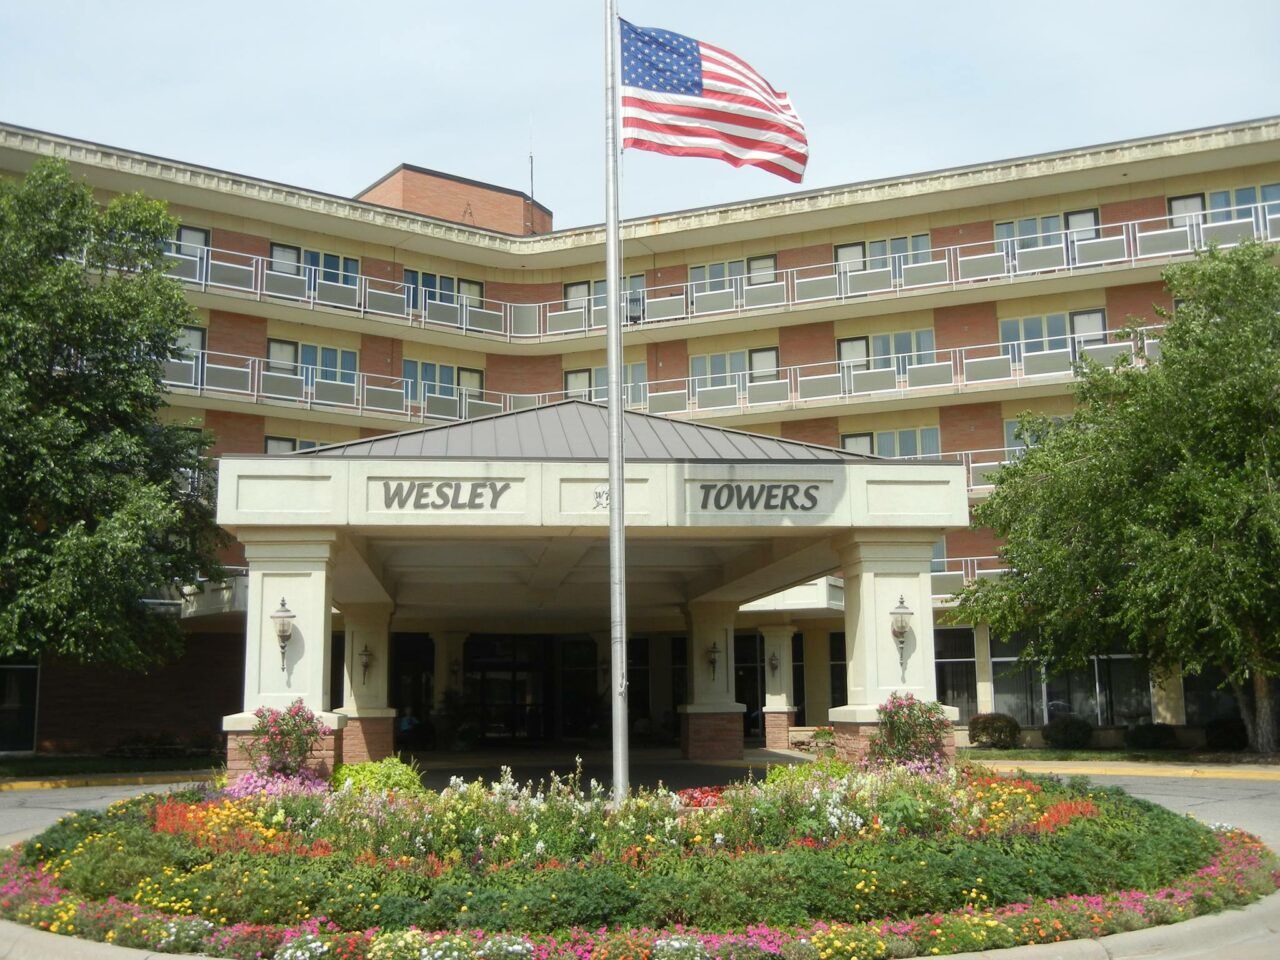
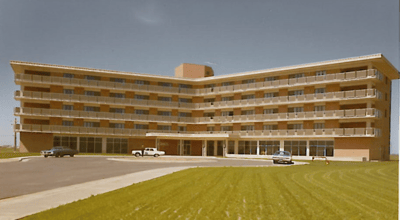
Owned by Security Bank of Kansas, Wesley Towers is a 52-bed skilled nursing home in Hutchinson, Kansas. It is centrally located at 700 Monterey Place, in a very walkable neighborhood. Most errands nearby can be done on foot, which may help visiting families. The home accepts Medicare, Medicaid, and private pay, which provides families with flexibility in how they cover care costs.

The community has an occupancy rate of 81%. Residents stay an average of 107 days, including short-term rehab stays and longer nursing placements.

Wesley Towers has four distinct care programs. Recovery & Healthcare supports post-acute rehabilitation after illness, surgery, or hospital care. The Cognitive Care Living Center serves residents needing memory support. The Center for Aging Excellence covers general skilled nursing care. The fourth program is Mental & Behavioral Health Care. This serves residents managing psychiatric or behavioral health needs.

The facility’s daily clinical support is substantial. Registered nurses provide both oversight and direct care. Across the full nursing team, residents receive about 5 hours and 16 minutes of care each day. Nurse aides and licensed practical nurses also help with daily hands-on support. That care includes help with daily living, medication management, and medical monitoring.

Kansas Department for Aging and Disability Services inspections show that the facility has addressed past issues. Earlier reviews found concerns with infection control, kitchen sanitation, and care planning documentation. The facility addressed those areas and showed sustained improvement in compliance.

Quality ratings

Measured by Centers for Medicare & Medicaid Services (CMS)

Overall rating Info The Overall CMS Rating combines results from health inspections, staffing levels and quality measures. Health inspections carry the most weight. Staffing and quality scores can increase or decrease the final rating based on performance compared to state and national standards.
▲ 72.9% Above KS avg. ▲ 72.9% Above KS avg.KS average: 2.9Click the badge to see the full State ranking.Click here to see the full State ranking.
Health Inspection Info Based on the results of the facility's three most recent standard inspections and any complaint investigations. CMS reviews the number, scope, and severity of deficiencies, with more recent findings weighted more heavily.
▲ 81.0% Above KS avg. ▲ 81.0% Above KS avg.KS average: 2.8Click the badge to see the full State ranking.Click here to see the full State ranking.
Staffing Info Measures average nursing staff hours per resident per day, including Registered Nurses (RNs) and total nursing staff. Ratings are adjusted based on the level of care residents require and are compared to state and national benchmarks.
▲ 44.6% Above KS avg. ▲ 44.6% Above KS avg.KS average: 3.5Click the badge to see the full State ranking.Click here to see the full State ranking.
Quality Measures Info Based on clinical and physical health indicators reported to CMS, such as hospital readmissions, falls, pressure ulcers, and improvements in mobility. These measures reflect how well residents' health needs are being managed.
▲ 61.7% Above KS avg. ▲ 61.7% Above KS avg.KS average: 3.1Click the badge to see the full State ranking.Click here to see the full State ranking.

Staffing hours breakdown

Info Daily nursing hours per resident by staff type, reported to CMS. Higher is generally better — compare this facility to state and national averages to see where staffing stands.

Hours per resident per day — compared to Kansas state averages

Total nursing care / resident Info Total adjusted nursing hours per resident per day, combining RN, LPN, and aide time. CMS adjusts this for case-mix so facilities can be fairly compared.
5h 16m per day
This facility Kansas avg (4h 38m per day)
vs Kansas avg
+14%

1 of 6 metrics below state avg

Standout metric Physical Therapist is +58% above state avg
Staff typeHours / Day / Residentvs state avg
Registered Nurse (RN) Info RNs hold the highest nursing license and can assess residents, interpret test results, and direct care plans. More RN hours per day often signals stronger clinical oversight and faster response to health changes. 51m per day ▲ 19% State avg: 43m per day · National avg: 41m per day
LPN / LVN Info Licensed Practical Nurses (LPNs) or Licensed Vocational Nurses (LVNs) deliver routine hands-on care — medication administration, wound dressing, and monitoring vital signs. They work under RN supervision and make up a large share of daily bedside care. 40m per day ■ Avg State avg: 40m per day · National avg: 52m per day
Nurse Aide Info Certified Nurse Aides (CNAs) provide the most direct day-to-day assistance: bathing, dressing, feeding, and mobility. Nurse aide hours are typically the largest staffing category and directly affect residents' quality of life. 2h 27m per day ▼ 9% State avg: 2h 41m per day · National avg: 2h 20m per day
Weekend Total Nursing Info Combined nursing hours (RN + LPN + Nurse Aide) per resident per day on weekends. Staffing often drops on weekends — this figure reveals whether the facility maintains adequate coverage outside of weekday hours. 3h 33m per day ■ Avg State avg: 3h 35m per day · National avg: 3h 26m per day
Physical Therapist Info Hours per resident per day provided by licensed Physical Therapists (PTs) or PT Assistants. PT services help residents recover mobility after injury or illness and are especially important for post-acute (short-stay) rehabilitation. 3m per day ▲ 58% State avg: 2m per day · National avg: 4m per day
Weekend RN Info Registered nurse hours specifically on weekends. Facilities sometimes reduce RN presence on Saturdays and Sundays — a low weekend RN figure compared to weekday hours can indicate reduced clinical oversight when most administrative staff are absent. 31m per day ▲ 3% State avg: 30m per day · National avg: 28m per day

Capacity and availability

Avg. Length of Stay
107 days
Bed community size
52-bed community Rank #132 / 224Bed count — State benchmarkedThis home is ranked 132nd out of 224 homes in Kansas. Shows this facility's certified or reported bed count compared to other Kansas facilities. Larger communities may offer more amenities, programs, and on-site services for residents and families.Rankings are based only on facilities in Kansas that report data for that category. Facilities without available data are excluded from the ranking.Click the rank badge to see the full State ranking.Click here to see the full State ranking.
A moderately sized community that may balance personal attention with shared amenities and social activities.
Walk Score
Walk Score: 80 / 100 Rank #18 / 363Walk Score — State benchmarkedThis home is ranked 18th out of 363 homes in Kansas. Shows how walkable this facility's neighborhood is compared to the average Walk Score across Kansas facilities. Higher scores benefit residents, families, and staff.Rankings are based only on facilities in Kansas that report data for that category. Facilities without available data are excluded from the ranking.Click the rank badge to see the full State ranking.Click here to see the full State ranking.
Very walkable. Most errands can be accomplished on foot, and many essentials are within a short walk.

About this community

Occupancy

Occupancy rate
81%
Similar to the Kansas average: 79.5%
Occupied beds
42 / 52
Average occupied beds in Kansas homes 50 beds

License Details

Facility TypeNursing Facility | Assisted Living Facility | Residential Health Care Facility
StatusActive
CountyReno
License Number175383
CMS Certification Number175383

Ownership & Operating Entity

Wesley Towers Inc is administered by Nabeel Khokhar.

Owner NameWesley Towers Inc

Additional Services

1 service
Cognitive Care

Amenities & Lifestyle

Specific ProgramsRecovery & Healthcare, Cognitive Care Living Center, Center for Aging Excellence, Mental & Behavioral Health Care

Contact Wesley Towers Inc

Inspection History

In Kansas, the Department for Aging and Disability Services, Survey and Certification Commission performs the unannounced inspections required for facility licensing and federal certification.

Since 2012 · 14 years of data 115 deficiencies

Inspection Scorecard Info This scorecard compares key inspection, deficiency, and complaint metrics at this facility against the Kansas state average. Metrics rated ≥15% worse than average are highlighted in red; those ≥15% better are highlighted in green.

Since 2012 vs. Kansas state average
Overall vs. KS average 2 Worse Metrics worse than Kansas average:
• Total deficiencies (15% above)
• Deficiencies per year (15% above)
0 Better No metrics in this bucket.
Latest Inspection September 3, 2024

Deficiencies Info Deficiencies are formal regulatory issues recorded during state inspections.

This FacilityKS Averagevs. KS Avg
Total deficiencies Info Formal regulatory issues recorded by inspectors across all inspection types. 115100 This facility has 15% more total deficiencies than a typical Kansas assisted living residence (115 vs. KS avg 100).↑ 15% worse
Deficiencies per year Info Average deficiencies per year since 2012. 8.27.1 This facility has 15% more deficiencies per year than a typical Kansas assisted living residence (8.2 vs. KS avg 7.1).↑ 15% worse

Inspection Reports Summary Info An editor-reviewed summary of the themes and findings across this facility's recent inspection reports.

  • The most recent inspection on July 24, 2018, found no deficiencies and confirmed the facility was in compliance with all regulations. Earlier inspections showed a pattern of deficiencies primarily related to infection control, sanitary kitchen conditions, medication management, and resident dignity and care planning. Complaint investigations substantiated issues with food safety, hand hygiene, and infection control, while other reports noted concerns about hazardous chemical storage and fall prevention. No fines, immediate jeopardy findings, or license actions were listed in the available reports. The facility appears to have addressed prior deficiencies effectively, demonstrating improvement over time.

Health Inspection History

Inspections since 2021
Total health inspections 3

Kansas average 4.5


Last Health inspection on May 2024

Total health citations
7

Kansas average 26.9

Citations per inspection
2.33

Kansas average 6.07


Health citations are formal notices following inspections when they fail to comply with safety and care standards.

5 of 7 citations resulted from standard inspections; and 2 of 7 came from combined inspections (standard and complaint).

Breakdown of citation severity (last 5 years)
Critical health citations
0
100% better than Kansas average

Kansas average: 0.9


Serious health citations
0
100% better than Kansas average

Kansas average: 0.9

0 critical citations Kansas average: 0.9

0 serious citations Kansas average: 0.9

7 moderate citations Kansas average: 24.6

0 minor citations Kansas average: 0.5
Citations history (last 5 years)
Nutrition moderate citation May 08, 2024
Corrected

Pharmacy moderate citation May 08, 2024
Corrected

Nutrition moderate citation Nov 21, 2022
Corrected

Quality of Care moderate citation Nov 21, 2022
Corrected

Staffing Data

Reporting period: October 1 – December 31, 2025 (Q4 2025). Source: CMS Payroll-Based Journal report.

Total staff 122
Employees 96
Contractors 26
Staff to resident ratio 2.90 : 1
30% more staff per resident than Kansas average
Kansas average ratio: 2.24 : 1 Kansas average ratio: 2.24 : 1See full Kansas ranking
Avg staff/day 33
Average shift 6.6 hours
14% worse than Kansas average
Kansas average: 7.7 hours Kansas average shift: 7.7 hoursSee full Kansas ranking
Total staff hours (quarter) 20,157

Nursing staff breakdown

Q4 2025 · Oct 1 – Dec 31 More info This data comes from the CMS Payroll-Based Journal report covering October 1 – December 31, 2025.
Registered Nurse

Manages medical care and health needs.

RN Staff Info All 11 RN Staff are full-time employees. No contractors work on this role. 11
Average shift length Info Average shift length. Calculated as total hours divided by days worked and average staff per day. 7.6 hours
Licensed Practical Nurse

Assists with medical care and medications.

LPN Staff Info All 12 LPN Staff are full-time employees. No contractors work on this role. 12
Average shift length Info Average shift length. Calculated as total hours divided by days worked and average staff per day. 7.4 hours
Certified Nursing Assistant

Helps with daily care and mobility.

CNA Staff Info All 47 CNA Staff are full-time employees. No contractors work on this role. 47
Average shift length Info Average shift length. Calculated as total hours divided by days worked and average staff per day. 6.8 hours

Contractor staffing

Q4 2025 · Oct 1 – Dec 31 More info This data comes from the CMS Payroll-Based Journal report covering October 1 – December 31, 2025.

Total hours from contractors

8.6%

1,727 contractor hours this quarter

Speech Language Pathologist: 10 Physical Therapy Assistant: 5 Physical Therapy Aide: 4 Qualified Social Worker: 2 Medical Director: 1 Respiratory Therapy Technician: 1 Occupational Therapy Aide: 1 Occupational Therapy Assistant: 1 Mental Health Service Worker: 1

Staff by category

Q4 2025 · Oct 1 – Dec 31 More info This data comes from the CMS Payroll-Based Journal report covering October 1 – December 31, 2025.
Certified Nursing Assistant470477,09792100%6.8
Medication Aide/Technician190193,18392100%7.4
Licensed Practical Nurse120122,76692100%7.4
Registered Nurse110112,54692100%7.6
Other Dietary Services Staff2028896672%7.9
Speech Language Pathologist010106138390%3.9
Clinical Nurse Specialist2025376368%7.7
Nurse Practitioner1014966267%8
Administrator1014886166%8
Dental Services Staff1014294953%8.8
Physical Therapy Aide0443897480%4.9
Physical Therapy Assistant0552386166%3.9
Respiratory Therapy Technician0112216470%3.5
Qualified Social Worker0221554852%3.2
Occupational Therapy Aide011511617%3.2
Medical Director011341718%2
Occupational Therapy Assistant0111467%2.3
Mental Health Service Worker0111233%4
47 Certified Nursing Assistant
% of Days 100%
19 Medication Aide/Technician
% of Days 100%
12 Licensed Practical Nurse
% of Days 100%
11 Registered Nurse
% of Days 100%
2 Other Dietary Services Staff
% of Days 72%
10 Speech Language Pathologist
% of Days 90%
2 Clinical Nurse Specialist
% of Days 68%
1 Nurse Practitioner
% of Days 67%
1 Administrator
% of Days 66%
1 Dental Services Staff
% of Days 53%
4 Physical Therapy Aide
% of Days 80%
5 Physical Therapy Assistant
% of Days 66%
1 Respiratory Therapy Technician
% of Days 70%
2 Qualified Social Worker
% of Days 52%
1 Occupational Therapy Aide
% of Days 17%
1 Medical Director
% of Days 18%
1 Occupational Therapy Assistant
% of Days 7%
1 Mental Health Service Worker
% of Days 3%

Penalties and fines

Federal penalties imposed by CMS for regulatory violations, including civil money penalties (fines) and denials of payment for new Medicare/Medicaid admissions.

Source: CMS Penalties Database

No penalties in the past 3 years

No civil money penalties or payment denials were reported in the last 3 years.

Quality of care over time

These measures show how residents usually do over time at this home, based on health outcomes and preventive care.

High-risk clinical events score Info A composite score based on pressure ulcers, falls with injury, weight loss, walking ability decline, and activities of daily living decline. 11.8
13% worse than Kansas average

Kansas average: 10.5

Functional decline score Info A composite score based on activities of daily living decline, walking ability decline, and incontinence. 22.5
8% worse than Kansas average

Kansas average: 20.7

Long-stay resident measures
Average Kansas avg: 3.0 Info CMS star rating based on long-stay quality measure performance. 5 stars = significantly above average, 1 star = significantly below average.
Need for Help with Daily Activities Increased Info Percent of long-stay residents whose need for help with daily activities has increased 20.8%
9% worse than Kansas average

Kansas average: 19.0%

Walking Ability Worsened Info Percent of long-stay residents whose ability to move independently worsened 23.7%
22% worse than Kansas average

Kansas average: 19.4%

Low Risk Residents with Bowel/Bladder Incontinence Info Percent of low risk long-stay residents who lose control of their bowels or bladder 22.9%
In line with Kansas average

Kansas average: 23.8%

Falls with Major Injury Info Percent of long-stay residents experiencing one or more falls with major injury 4.8%
10% worse than Kansas average

Kansas average: 4.4%

High Risk Residents with Pressure Ulcers Info Percent of long-stay high risk residents with pressure ulcers 3.0%
35% better than Kansas average

Kansas average: 4.6%

Urinary Tract Infection Info Percent of long-stay residents with a urinary tract infection 1.4%
56% better than Kansas average

Kansas average: 3.1%

Lost Too Much Weight Info Percent of long-stay residents who lose too much weight 6.8%
33% worse than Kansas average

Kansas average: 5.1%

Depressive Symptoms Info Percent of long-stay residents who have depressive symptoms 2.9%
44% better than Kansas average

Kansas average: 5.2%

Antipsychotic Use Info Percent of long-stay residents who received an antipsychotic medication 20.6%
21% worse than Kansas average

Kansas average: 16.9%

Pneumococcal Vaccine Info Percent of long-stay residents assessed and appropriately given the pneumococcal vaccine 87.6%
5% worse than Kansas average

Kansas average: 91.9%

Influenza Vaccine Info Percent of long-stay residents assessed and appropriately given the seasonal influenza vaccine 95.2%
In line with Kansas average

Kansas average: 95.5%

Hospitalizations per 1,000 days Info Number of hospitalizations per 1,000 long-stay resident days. 0.69
63% better than Kansas average

Kansas average: 1.84

ED visits per 1,000 days Info Number of outpatient emergency department visits per 1,000 long-stay resident days. 1.38
36% better than Kansas average

Kansas average: 2.16

Short-stay resident measures
Significantly above average Kansas avg: 2.6 Info CMS star rating based on short-stay quality measure performance. 5 stars = much above average, 1 star = much below average.
Pneumococcal Vaccine Info Percent of short-stay residents assessed and appropriately given the pneumococcal vaccine 63.9%
16% worse than Kansas average

Kansas average: 75.6%

Antipsychotic medication increase Info Percent of short-stay residents who newly received an antipsychotic medication 0.4%
80% better than Kansas average

Kansas average: 2.2%

Influenza Vaccine Info Percent of short-stay residents assessed and appropriately given the seasonal influenza vaccine 65.3%
11% worse than Kansas average

Kansas average: 73.5%

Re-hospitalized after SNF stay Info Percentage of short-stay residents who were re-hospitalized after their nursing home admission. 17.3%
25% better than Kansas average

Kansas average: 23.0%

Emergency department visits Info Percentage of short-stay residents who had an outpatient emergency department visit. 12.1%
In line with Kansas average

Kansas average: 11.7%

Falls with major injury Info Percentage of SNF residents who experience falls with major injury during their stay. 1.4%
77% worse than Kansas average

Kansas average: 0.8%

Ability to care for self at discharge Info Percentage of residents at or above expected ability to care for themselves at discharge. 69.1%
29% better than Kansas average

Kansas average: 53.7%

Successful return to home or community Info Rate of successful return to home or community from a skilled nursing facility. 62.2%
23% better than Kansas average

Kansas average: 50.6%

Breakdown by payment type

Medicare

23% of new residents, usually for short-term rehab.

Typical stay 3 - 4 months

Private pay

16% of new residents, often for short stays.

Typical stay 1 - 2 years

Medicaid

61% of new residents, often for long-term daily care.

Typical stay 3 - 4 months

Facility Characteristics

Source: CMS Long-Term Care Facility Characteristics (Data as of Jan 2026)

Total residents 42
Medicare
10
23.8% of residents
Medicaid
23
54.8% of residents
Private pay or other
9
21.4% of residents
Programs & Services
Residents Group

Residents meet regularly to discuss policies, care quality, and activities

CCRC

Part of a Continuing Care Retirement Community offering multiple care levels

Active Resident Council

Organized group of residents that meets regularly to discuss facility policies, quality of life, and activities.

Finances and operations

Based on CMS SNF Cost Report for fiscal year ending in 06/2024.

Nonprofit
Nonprofit Corporation
Net patient revenue Info Net patient revenue — what the home actually collects for resident care, after contractual allowances, bad debt and discounts are subtracted from its gross charges (CMS cost report, Worksheet G-3). It covers resident care only; money the home earns from other sources is shown separately as "Other income."
$12.6M
Net patient income Info Net patient income: net patient revenue minus the home's total operating expenses. A positive figure means it earns more from resident care than it spends to deliver it; a negative figure means the opposite. It excludes non-operating "other income."
-$1.9M
Nonprofit Nonprofit Corporation
Net patient revenue Info Net patient revenue — what the home actually collects for resident care, after contractual allowances, bad debt and discounts are subtracted from its gross charges (CMS cost report, Worksheet G-3). It covers resident care only; money the home earns from other sources is shown separately as "Other income."
$12.6M
Net patient income Info Net patient income: net patient revenue minus the home's total operating expenses. A positive figure means it earns more from resident care than it spends to deliver it; a negative figure means the opposite. It excludes non-operating "other income."
-$1.9M
Other income Info Money the home earns outside of resident care — such as investments, grants, rentals and other non-operating sources (CMS cost report, Worksheet G-3). It is tracked separately from net patient revenue: it is not part of that figure, and it is not included in net patient income.
$927.1K
Payroll costs Info Staff salaries plus wage-related costs — benefits such as payroll taxes, health insurance and retirement — from the home's own accounting records (CMS cost report, Worksheet A). Contract or agency labor is counted separately, under other operating costs.
$7.5M 59.7% of net patient revenue Info Payroll as a share of revenue: staff salaries and wage-related benefits divided by net patient revenue. A higher figure means more of each revenue dollar goes to staff pay.
Other operating costs Info Everything it costs to run the home apart from payroll — food, utilities, supplies, maintenance, contract labor and administration. Calculated as total operating expense minus payroll (staff salaries and wage-related benefits).
$7.0M
Total costs Info The home's total operating expense for the year — all the costs of running it, salaries included (CMS cost report, Worksheet G-3).
$14.5M

Who this home usually serves

TYPE OF STAY

Mostly long-term care residents

Most residents stay for extended periods and receive ongoing daily care.

Most new residents arrive under Medicaid (61% of admissions), and a typical Medicaid stay runs around 3 - 4 months.

Admissions
152 total

Coverage residents most often arrive under.

Medicare 23%
Private pay 16%
Medicaid 61%
Discharges
182 total

Coverage residents most often leave under.

Medicare 68%
Private pay 28%
Medicaid 5%

Places of interest near Wesley Towers Inc

Address 0.0 miles from city center Info Estimated distance in miles from Hutchinson's city center to Wesley Towers Inc's address, calculated via Google Maps.

Calculate Travel Distance to Wesley Towers Inc

Add your location

Address

Compare Assisted Living around Hutchinson

The information below is reported by the Kansas Department for Aging and Disability Services.

Wesley Towers Inc
AL
NH
IL
MC
Hutchinson -
52
Facility 52
KS AVG 69
Rank #132 / 224
-
80
Facility 80
KS AVG 46
Rank #18 / 363
-
Waldron Place Senior Living
AL
NH
HC
MC
RC
Hutchinson -
60
Facility 60
KS AVG 69
Rank #94 / 224
-
32
Facility 32
KS AVG 46
Rank #252 / 363
Studio / Suite
Good Samaritan Society – Hutchinson Village
AL
IL
NH
RC
Hutchinson -
65
Facility 65
KS AVG 69
Rank #88 / 224
-
59
Facility 59
KS AVG 46
Rank #104 / 363
-
Diversicare of Hutchinson, LLC
AL
HC
MC
NH
Hutchinson -
73
Facility 73
KS AVG 69
Rank #75 / 224
-
80
Facility 80
KS AVG 46
Rank #18 / 363
-

Financial Assistance for
Assisted Living in Kansas

Wesley Towers Inc is located in HUTCHINSON, Kansas.
Here are the financial assistance programs available to residents in Kansas.

Get Financial aid guidance

Frail Elderly Waiver

Kansas Medicaid FE Waiver

Age 65+
General Kansas resident, Medicaid-eligible, nursing home- level care need.
Income Limits (2025) ~$2,829/month 300% FBR, individual
Asset Limits $2,000 (individual), $3,000 (couple).
KS

Requires care level assessment.

Benefits
Personal care (5-7 hours/day) Respite (240 hours/year) Adult day care (~$60/day) Home aides

Senior Care Act

Kansas SCA

Age 60+
General Kansas resident, at risk of nursing home.
Income Limits ~$1,800/month individual, varies
Asset Limits $2,000 individual
KS

Limited funding; waitlists common.

Benefits
In-home care (3-5 hours/week) Respite (up to 10 days/year) Homemaker services

Medicare Savings Program (MSP)

Kansas Medicare Savings Program

Age 65+ or disabled
General Kansas resident, Medicare Part A/B.
Income Limits (2025) ~$2,510/month (QMB), ~$3,380/month (SLMB), ~$3,598/month (QI)—individual.
Asset Limits $9,430 (individual), $14,130 (couple).
KS

Three tiers; no waitlist.

Benefits
Covers Part B premiums ($174.70/month) Deductibles ($240/year) Copays (~20%)

National Family Caregiver Support Program (NFCSP) Respite

Kansas NFCSP Respite Care

Age
General Caregivers of 60+ needing care or 55+ caregivers of others; Kansas resident; functional needs (2+ ADLs).
Income Limits (2025) Prioritizes ~$24,980/year (individual); no strict cap.
Asset Limits Not assessed; need-based.
KS

11 AAAs; prioritizes low-income, rural caregivers.

Benefits
Respite (4-6 hours/week or 5 days/year) Adult day care ($60/day) Caregiver training

VA Aid and Attendance (A&A) and Housebound Benefits

Kansas VA Aid and Attendance/Housebound

Age 65+ or disabled veteran/spouse
General Kansas resident, wartime service, need for ADL help (A&A) or homebound.
Income Limits (2025) Net income < ~$1,984/month (veteran with dependent, A&A); pension offsets income.
Asset Limits ~$155,356 net worth limit
KS

High veteran demand in rural/urban areas.

Benefits
Cash (~$1,433-$2,642/month veteran, ~$951-$1,318 spouse) for care costs (e.g., in-home, assisted living)

Frequently Asked Questions about Wesley Towers Inc

Is Wesley Towers Inc in a walkable area?

Wesley Towers Inc has a walk score of 80. Very walkable. Most errands can be accomplished on foot, and many essentials are within a short walk.

What is the license number of Wesley Towers Inc?

According to KS state health department records, Wesley Towers Inc's license number is 175383.

What is the occupancy rate at Wesley Towers Inc?

Wesley Towers Inc's occupancy is 81%.

Does Wesley Towers Inc operate as a for-profit or non-profit?

Wesley Towers Inc is registered as a non-profit in KS.

Who is the administrator of Wesley Towers Inc?

Nabeel Khokhar is the administrator of Wesley Towers Inc.

How many beds does Wesley Towers Inc have?

Wesley Towers Inc has 52 beds.

Are there photos of Wesley Towers Inc?

Yes — there are 5 photos of Wesley Towers Inc in the photo gallery on this page.

Guides for Better Senior Living

Care Cost Calculator: See Prices in Your Area

Nursing Home Data Explorer

Don’t Wait Too Long: 7 Red Flag Signs Your Parent Needs Assisted Living Now

The True Cost of Assisted Living in 2025 – And How Families Are Paying For It

Understanding Senior Living Costs: Pricing Models, Discounts & Financial Assistance