The Nicol Home
Nursing Home, Respite Care & Skilled Nursing · Glasco, KS
CMS overall rating Info CMS (the Centers for Medicare & Medicaid Services) is the federal agency that rates nursing home quality. Its Overall Rating runs from 1 to 5 stars, combining health inspections, staffing, and quality measures, with inspections weighted most heavily.

The Nicol Home

Nursing Home, Respite Care & Skilled Nursing · Glasco, KS
CMS overall rating Info CMS (the Centers for Medicare & Medicaid Services) is the federal agency that rates nursing home quality. Its Overall Rating runs from 1 to 5 stars, combining health inspections, staffing, and quality measures, with inspections weighted most heavily.
Calculator: See prices in your area
The Nicol Home accepts Medicaid, Medicare, and private pay.

Overview of The Nicol Home

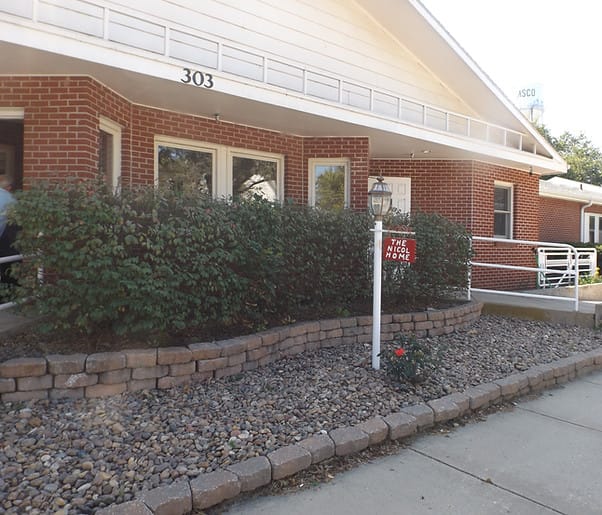
Owned by Carter Olson, The Nicol Home is a small nursing home in Glasco, Kansas, that serves residents in a rural setting. The area is car-dependent, so most errands and visits will require driving. With 32 beds, the home has a smaller, more personal scale. The facility has an occupancy rate of 94%, so it’s quite full for its size. It accepts Medicaid, Medicare, and private pay from families looking for options to cover long-term care or rehabilitation.

Residents stay an average of over 2 years. That suggests many residents stay for ongoing nursing care rather than short-term recovery alone. Nursing support averages about 4 hours and 45 minutes per resident each day. That care comes from registered nurses, nurse aides, and licensed practical nurses. The home also has an 8:1 staff-to-resident ratio to provide more individual attention.

Care services include rehabilitation, respite care, and short-term rehab options. Staff is available 24 hours a day. This may suit residents recovering from illness or injury or those who need long-term care with strong daily nursing support.

State inspections show the home has worked on past care-planning and quality concerns. Recent inspection results show compliance with regulatory requirements. They also reflect correction of earlier deficiencies. Families may still want to ask what changed and how staff now track care plans.

For families considering The Nicol Home, the small size may be a main draw. The strong staffing-to-resident ratio is also worth noting. Visiting family should plan to drive because of the rural Kansas location. Still, the quieter setting may suit residents who prefer a close-knit community.

Quality ratings

Measured by Centers for Medicare & Medicaid Services (CMS)

Overall rating Info The Overall CMS Rating combines results from health inspections, staffing levels and quality measures. Health inspections carry the most weight. Staffing and quality scores can increase or decrease the final rating based on performance compared to state and national standards.
Health Inspection Info Based on the results of the facility's three most recent standard inspections and any complaint investigations. CMS reviews the number, scope, and severity of deficiencies, with more recent findings weighted more heavily.
Staffing Info Measures average nursing staff hours per resident per day, including Registered Nurses (RNs) and total nursing staff. Ratings are adjusted based on the level of care residents require and are compared to state and national benchmarks.
Quality Measures Info Based on clinical and physical health indicators reported to CMS, such as hospital readmissions, falls, pressure ulcers, and improvements in mobility. These measures reflect how well residents' health needs are being managed.

Staffing hours breakdown

Info Daily nursing hours per resident by staff type, reported to CMS. Higher is generally better — compare this facility to state and national averages to see where staffing stands.

Hours per resident per day — compared to state averages

Total nursing care / resident Info Total adjusted nursing hours per resident per day, combining RN, LPN, and aide time. CMS adjusts this for case-mix so facilities can be fairly compared.
4h 45m per day
vs avg

0 of 5 metrics below state avg

Standout metric Weekend RN is +43% above state avg
Staff typeHours / Day / Residentvs state avg
Registered Nurse (RN) Info RNs hold the highest nursing license and can assess residents, interpret test results, and direct care plans. More RN hours per day often signals stronger clinical oversight and faster response to health changes. 49m per day ▲ 14% State avg: 43m per day · National avg: 41m per day
LPN / LVN Info Licensed Practical Nurses (LPNs) or Licensed Vocational Nurses (LVNs) deliver routine hands-on care — medication administration, wound dressing, and monitoring vital signs. They work under RN supervision and make up a large share of daily bedside care. 40m per day ■ Avg State avg: 40m per day · National avg: 52m per day
Nurse Aide Info Certified Nurse Aides (CNAs) provide the most direct day-to-day assistance: bathing, dressing, feeding, and mobility. Nurse aide hours are typically the largest staffing category and directly affect residents' quality of life. 3h 4m per day ▲ 14% State avg: 2h 41m per day · National avg: 2h 20m per day
Weekend Total Nursing Info Combined nursing hours (RN + LPN + Nurse Aide) per resident per day on weekends. Staffing often drops on weekends — this figure reveals whether the facility maintains adequate coverage outside of weekday hours. 4h 6m per day ▲ 14% State avg: 3h 35m per day · National avg: 3h 26m per day
Weekend RN Info Registered nurse hours specifically on weekends. Facilities sometimes reduce RN presence on Saturdays and Sundays — a low weekend RN figure compared to weekday hours can indicate reduced clinical oversight when most administrative staff are absent. 43m per day ▲ 43% State avg: 30m per day · National avg: 28m per day

Capacity and availability

Avg. Length of Stay Info Average number of days residents stay at this facility, based on CMS cost report data. Shorter stays often reflect post-acute or rehab care; longer stays reflect long-term care.
767 days
Bed community size
32-bed community Rank #220 / 224Bed count — State benchmarkedThis home is ranked 220th out of 224 homes in Kansas. Shows this facility's certified or reported bed count compared to other Kansas facilities. Larger communities may offer more amenities, programs, and on-site services for residents and families.Rankings are based only on facilities in Kansas that report data for that category. Facilities without available data are excluded from the ranking.Click the rank badge to see the full State ranking.Click here to see the full State ranking.
A moderately sized community that may balance personal attention with shared amenities and social activities.
Walk Score
Walk Score: 18 / 100 Rank #321 / 363Walk Score — State benchmarkedThis home is ranked 321st out of 363 homes in Kansas. Shows how walkable this facility's neighborhood is compared to the average Walk Score across Kansas facilities. Higher scores benefit residents, families, and staff.Rankings are based only on facilities in Kansas that report data for that category. Facilities without available data are excluded from the ranking.Click the rank badge to see the full State ranking.Click here to see the full State ranking.
Car-dependent. Most errands require a car, with limited nearby walkable options.

About this community

Occupancy

Occupancy rate
94%
Higher than the Kansas average: 79.5%
Occupied beds
30 / 32
Average occupied beds in Kansas homes 50 beds

License Details

Facility TypeNursing Facility
StatusActive
CountyCloud
License Number175473
CMS Certification Number175473

Ownership & Operating Entity

The Nicol Home is administered by Carter Olson.

Owner NameThe Nicol Home Inc

Payment & Insurance

1 service
Accept Medicaid

Therapy & Rehabilitation

3 services
Rehabilitation Services
Respite Care
Short-Term Rehab

Staffing & Medical

2 services
24-Hour Staffing
Staff-to-Resident Ratio: 8:1

Contact The Nicol Home

Inspection History

In Kansas, the Department for Aging and Disability Services, Survey and Certification Commission performs the unannounced inspections required for facility licensing and federal certification.

Since 2012 · 14 years of data 198 deficiencies

Inspection Scorecard Info This scorecard compares key inspection, deficiency, and complaint metrics at this facility against the Kansas state average. Metrics rated ≥15% worse than average are highlighted in red; those ≥15% better are highlighted in green.

Since 2012 vs. Kansas state average
Overall vs. KS average 2 Worse Metrics worse than Kansas average:
• Total deficiencies (98% above)
• Deficiencies per year (99% above)
0 Better No metrics in this bucket.
Latest Inspection August 7, 2024

Deficiencies Info Deficiencies are formal regulatory issues recorded during state inspections.

This FacilityKS Averagevs. KS Avg
Total deficiencies Info Formal regulatory issues recorded by inspectors across all inspection types. 198100 This facility has 98% more total deficiencies than a typical Kansas assisted living residence (198 vs. KS avg 100).↑ 98% worse
Deficiencies per year Info Average deficiencies per year since 2012. 14.17.1 This facility has 99% more deficiencies per year than a typical Kansas assisted living residence (14.1 vs. KS avg 7.1).↑ 99% worse

Inspection Reports Summary Info An editor-reviewed summary of the themes and findings across this facility's recent inspection reports.

  • The most recent inspection on September 6, 2024, found the facility in compliance with all regulations and no new deficiencies. Prior inspections identified recurring issues primarily related to care plan accuracy and timely updates, medication management including psychotropic drug use, infection prevention, fall prevention, and reporting compliance. Complaint investigations substantiated some deficiencies, including a fall resulting in injury due to failure to follow a care plan, and concerns about resident supervision and abuse from earlier years. Enforcement actions included an immediate jeopardy finding in 2020 related to COVID-19 visitation controls and a prior immediate jeopardy in 2014 for substandard quality of care, but no fines or license suspensions were listed in the available reports. The facility appears to have improved over time, with recent inspections showing correction of previously cited deficiencies and no new noncompliance noted.

Health Inspection History

Inspections since 2021
Total health inspections 4

State average N/A


Last Health inspection on Jul 2024

Total health citations
24

State average N/A

Citations per inspection
6

State average N/A


Health citations are formal notices following inspections when they fail to comply with safety and care standards.

14 of 24 citations resulted from standard inspections; 1 of 24 resulted from complaint investigations; and 9 of 24 came from combined inspections (standard and complaint).

Breakdown of citation severity (last 5 years)
Critical health citations
0
In line with State average

State average: N/A


Serious health citations
1
In line with State average

State average: N/A

0 critical citations State average: N/A

1 serious citation State average: N/A

23 moderate citations State average: N/A

0 minor citations State average: N/A
Citations history (last 5 years)
Administration moderate citation Jul 31, 2024
Corrected

Infection Control moderate citation Jul 31, 2024
Corrected

Pharmacy moderate citation Jul 31, 2024
Corrected

Pharmacy moderate citation Jul 31, 2024
Corrected

Staffing Data

Reporting period: October 1 – December 31, 2025 (Q4 2025). Source: CMS Payroll-Based Journal report.

Total staff 57
Employees 47
Contractors 10
Staff to resident ratio 1.90 : 1
0% compared with State average

State average ratio: 0 : 0

Avg staff/day 18
Average shift 7.9 hours
0% compared with State average

State average: 0 hours

Total staff hours (quarter) 13,141

Nursing staff breakdown

Q4 2025 · Oct 1 – Dec 31 More info This data comes from the CMS Payroll-Based Journal report covering October 1 – December 31, 2025.
Registered Nurse

Manages medical care and health needs.

RN Staff Info All 8 RN Staff are full-time employees. No contractors work on this role. 8
Average shift length Info Average shift length. Calculated as total hours divided by days worked and average staff per day. 7.7 hours
Licensed Practical Nurse

Assists with medical care and medications.

LPN Staff Info All 3 LPN Staff are full-time employees. No contractors work on this role. 3
Average shift length Info Average shift length. Calculated as total hours divided by days worked and average staff per day. 10.4 hours
Certified Nursing Assistant

Helps with daily care and mobility.

CNA Staff Info All 27 CNA Staff are full-time employees. No contractors work on this role. 27
Average shift length Info Average shift length. Calculated as total hours divided by days worked and average staff per day. 8.2 hours

Contractor staffing

Q4 2025 · Oct 1 – Dec 31 More info This data comes from the CMS Payroll-Based Journal report covering October 1 – December 31, 2025.

Total hours from contractors

2.4%

321 contractor hours this quarter

Physical Therapy Assistant: 2 Respiratory Therapy Technician: 2 Speech Language Pathologist: 1 Occupational Therapy Aide: 1 Medical Director: 1 Occupational Therapy Assistant: 1 Mental Health Service Worker: 1 Qualified Social Worker: 1

Staff by category

Q4 2025 · Oct 1 – Dec 31 More info This data comes from the CMS Payroll-Based Journal report covering October 1 – December 31, 2025.
Certified Nursing Assistant270277,42692100%8.2
Licensed Practical Nurse3031,81192100%10.4
Registered Nurse8081,34092100%7.7
Other Dietary Services Staff5057927986%7.3
Administrator2025296773%7.9
Nurse Practitioner1014835762%8.5
Physical Therapist1014405560%8
Speech Language Pathologist0112176672%3.3
Occupational Therapy Aide0112133%7
Physical Therapy Assistant0221778%2.4
Respiratory Therapy Technician022162325%0.7
Medical Director0111533%5
Occupational Therapy Assistant0111233%4
Mental Health Service Worker0111233%4
Qualified Social Worker0111167%1.8
27 Certified Nursing Assistant
% of Days 100%
3 Licensed Practical Nurse
% of Days 100%
8 Registered Nurse
% of Days 100%
5 Other Dietary Services Staff
% of Days 86%
2 Administrator
% of Days 73%
1 Nurse Practitioner
% of Days 62%
1 Physical Therapist
% of Days 60%
1 Speech Language Pathologist
% of Days 72%
1 Occupational Therapy Aide
% of Days 3%
2 Physical Therapy Assistant
% of Days 8%
2 Respiratory Therapy Technician
% of Days 25%
1 Medical Director
% of Days 3%
1 Occupational Therapy Assistant
% of Days 3%
1 Mental Health Service Worker
% of Days 3%
1 Qualified Social Worker
% of Days 7%

Penalties and fines

Federal penalties imposed by CMS for regulatory violations, including civil money penalties (fines) and denials of payment for new Medicare/Medicaid admissions.

Source: CMS Penalties Database

No penalties in the past 3 years

No civil money penalties or payment denials were reported in the last 3 years.

Quality of care over time

These measures show how residents usually do over time at this home, based on health outcomes and preventive care.

High-risk clinical events score Info A composite score based on pressure ulcers, falls with injury, weight loss, walking ability decline, and activities of daily living decline. 16.9
62% worse than State average

State average: 10.5

Functional decline score Info A composite score based on activities of daily living decline, walking ability decline, and incontinence. 36.8
78% worse than State average

State average: 20.7

Long-stay resident measures
Significantly below average State avg: 3.0 Info CMS star rating based on long-stay quality measure performance. 5 stars = significantly above average, 1 star = significantly below average.
Need for Help with Daily Activities Increased Info Percent of long-stay residents whose need for help with daily activities has increased 39.0%
105% worse than State average

State average: 19.0%

Walking Ability Worsened Info Percent of long-stay residents whose ability to move independently worsened 40.4%
109% worse than State average

State average: 19.4%

Low Risk Residents with Bowel/Bladder Incontinence Info Percent of low risk long-stay residents who lose control of their bowels or bladder 31.0%
31% worse than State average

State average: 23.8%

Falls with Major Injury Info Percent of long-stay residents experiencing one or more falls with major injury 5.3%
20% worse than State average

State average: 4.4%

High Risk Residents with Pressure Ulcers Info Percent of long-stay high risk residents with pressure ulcers 0.0%
100% better than State average

State average: 4.6%

Urinary Tract Infection Info Percent of long-stay residents with a urinary tract infection 2.3%
28% better than State average

State average: 3.1%

Lost Too Much Weight Info Percent of long-stay residents who lose too much weight 0.0%
100% better than State average

State average: 5.1%

Depressive Symptoms Info Percent of long-stay residents who have depressive symptoms 0.0%
100% better than State average

State average: 5.2%

Antipsychotic Use Info Percent of long-stay residents who received an antipsychotic medication 14.7%
13% better than State average

State average: 16.9%

Pneumococcal Vaccine Info Percent of long-stay residents assessed and appropriately given the pneumococcal vaccine 100.0%
9% better than State average

State average: 91.9%

Influenza Vaccine Info Percent of long-stay residents assessed and appropriately given the seasonal influenza vaccine 100.0%
5% better than State average

State average: 95.5%

Hospitalizations per 1,000 days Info Number of hospitalizations per 1,000 long-stay resident days. 2.72
48% worse than State average

State average: 1.84

ED visits per 1,000 days Info Number of outpatient emergency department visits per 1,000 long-stay resident days. 2.81
30% worse than State average

State average: 2.16

Breakdown by payment type

Medicare

84% of new residents, usually for short-term rehab.

Typical stay 2 - 3 months

Private pay

5% of new residents, often for short stays.

Typical stay 13 years

Medicaid

11% of new residents, often for long-term daily care.

Typical stay 6 - 7 years

Facility Characteristics

Source: CMS Long-Term Care Facility Characteristics (Data as of Jan 2026)

Total residents 30
Medicare
1
3.3% of residents
Medicaid
16
53.3% of residents
Private pay or other
13
43.3% of residents
Programs & Services
Residents Group

Residents meet regularly to discuss policies, care quality, and activities

Nurse Aide Training

State-approved Nurse Aide Training and Competency Evaluation Program on-site

Active Resident Council

Organized group of residents that meets regularly to discuss facility policies, quality of life, and activities.

Finances and operations

Based on CMS SNF Cost Report for fiscal year ending in 12/2023.

Nonprofit
Nonprofit Corporation
Net patient revenue Info Net patient revenue — what the home actually collects for resident care, after contractual allowances, bad debt and discounts are subtracted from its gross charges (CMS cost report, Worksheet G-3). It covers resident care only; money the home earns from other sources is shown separately as "Other income."
$3.1M
Net patient income Info Net patient income: net patient revenue minus the home's total operating expenses. A positive figure means it earns more from resident care than it spends to deliver it; a negative figure means the opposite. It excludes non-operating "other income."
$282.9K
Nonprofit Nonprofit Corporation
Net patient revenue Info Net patient revenue — what the home actually collects for resident care, after contractual allowances, bad debt and discounts are subtracted from its gross charges (CMS cost report, Worksheet G-3). It covers resident care only; money the home earns from other sources is shown separately as "Other income."
$3.1M
Net patient income Info Net patient income: net patient revenue minus the home's total operating expenses. A positive figure means it earns more from resident care than it spends to deliver it; a negative figure means the opposite. It excludes non-operating "other income."
$282.9K
Other income Info Money the home earns outside of resident care — such as investments, grants, rentals and other non-operating sources (CMS cost report, Worksheet G-3). It is tracked separately from net patient revenue: it is not part of that figure, and it is not included in net patient income.
$141.5K
Payroll costs Info Staff salaries plus wage-related costs — benefits such as payroll taxes, health insurance and retirement — from the home's own accounting records (CMS cost report, Worksheet A). Contract or agency labor is counted separately, under other operating costs.
$1.7M 54.8% of net patient revenue Info Payroll as a share of revenue: staff salaries and wage-related benefits divided by net patient revenue. A higher figure means more of each revenue dollar goes to staff pay.
Other operating costs Info Everything it costs to run the home apart from payroll — food, utilities, supplies, maintenance, contract labor and administration. Calculated as total operating expense minus payroll (staff salaries and wage-related benefits).
$1.1M
Total costs Info The home's total operating expense for the year — all the costs of running it, salaries included (CMS cost report, Worksheet G-3).
$2.9M

Who this home usually serves

TYPE OF STAY

Mostly short-term rehab stays

Most residents typically stay for a few weeks or months before returning home or moving on.

Most new residents arrive under Medicare (84% of admissions), and a typical Medicare stay runs around 2 - 3 months.

Admissions
19 total

Coverage residents most often arrive under.

Medicare 84%
Private pay 5%
Medicaid 11%
Discharges
14 total

Coverage residents most often leave under.

Medicare 71%
Private pay 21%
Medicaid 7%

Places of interest near The Nicol Home

Address 0.0 miles from city center Info Estimated distance in miles from Glasco's city center to The Nicol Home's address, calculated via Google Maps.

Calculate Travel Distance to The Nicol Home

Add your location

Address

Compare Nursing Homes around the area

The information below is reported by the Kansas Department for Aging and Disability Services.

Lexington Park Assisted Living
NH
AL
IL
SNF
Topeka (West Southwest 2) -60 A+ 60 studio / 1 bed
Larksfield Place Independent Living
NH
AL
IL
MC
RC
SNF
Wichita -80 A+ 32 -
Brewster Place
NH
AL
IL
MC
RC
SNF
Topeka (South/Southeast 1) -141 A+ 56 -
Aberdeen Village
NH
AL
IL
MC
SNF
Olathe (Aberdeen Village) -60 - 45 -
The Nicol Home
NH
RC
SNF
Glasco -32 - 18 -

Frequently Asked Questions about The Nicol Home

Is The Nicol Home in a walkable area?

The Nicol Home has a walk score of 18. Car-dependent. Most errands require a car, with limited nearby walkable options.

What is the license number of The Nicol Home?

According to KS state health department records, The Nicol Home's license number is 175473.

What is the occupancy rate at The Nicol Home?

The Nicol Home's occupancy is 94%.

Does The Nicol Home operate as a for-profit or non-profit?

The Nicol Home is registered as a non-profit in KS.

Who is the administrator of The Nicol Home?

Carter Olson is the administrator of The Nicol Home.

How many beds does The Nicol Home have?

The Nicol Home has 32 beds.

Are there photos of The Nicol Home?

Yes — there is 1 photo of The Nicol Home in the photo gallery on this page.

Guides for Better Senior Living

Care Cost Calculator: See Prices in Your Area

Nursing Home Data Explorer

Don’t Wait Too Long: 7 Red Flag Signs Your Parent Needs Assisted Living Now

The True Cost of Assisted Living in 2025 – And How Families Are Paying For It

Understanding Senior Living Costs: Pricing Models, Discounts & Financial Assistance