Mission Terrace
Nursing Home · Santa Barbara, CA
CMS overall rating Info The Overall CMS Rating is scored from 1 to 5 stars and combines results from health inspections, staffing levels, and quality measures. Health inspections carry the most weight. Staffing and quality scores can increase or decrease the final rating based on performance compared to state and national standards.

Mission Terrace

Nursing Home · Santa Barbara, CA
CMS overall rating Info The Overall CMS Rating is scored from 1 to 5 stars and combines results from health inspections, staffing levels, and quality measures. Health inspections carry the most weight. Staffing and quality scores can increase or decrease the final rating based on performance compared to state and national standards.
Calculator: See prices in your area
Mission Terrace accepts Medicare, Medicaid, and private pay.

Overview of Mission Terrace

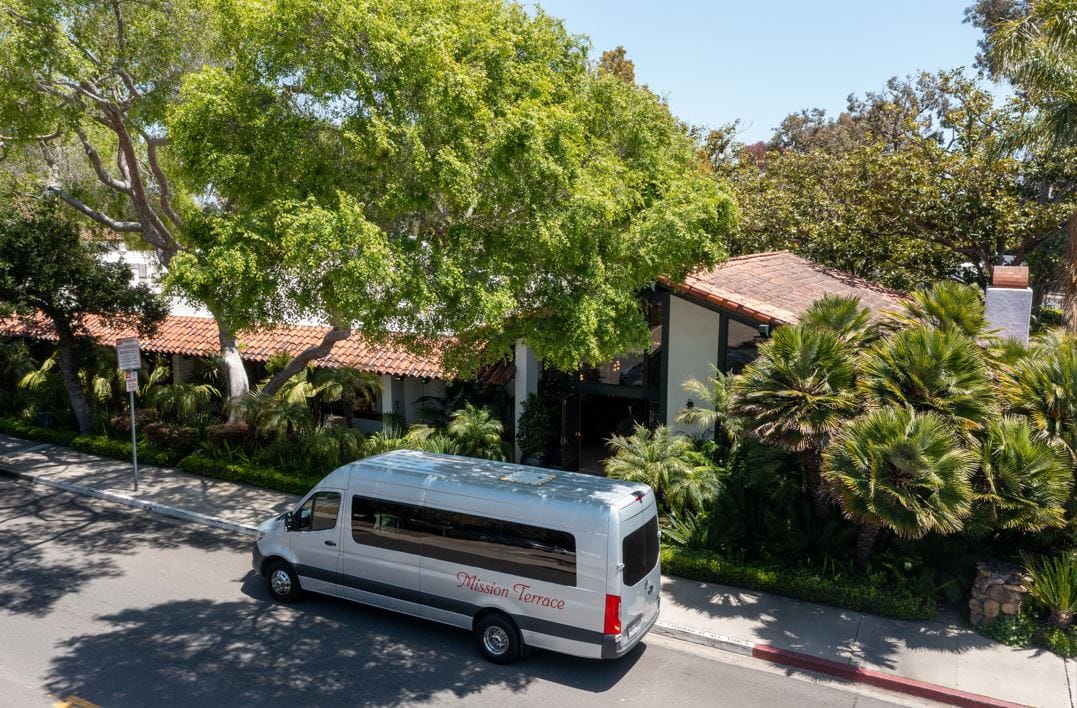
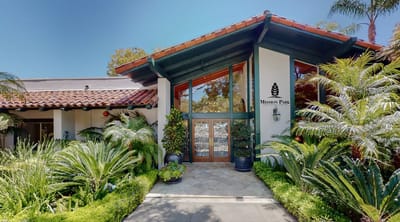
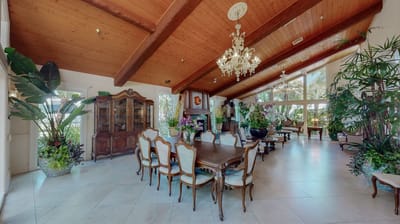
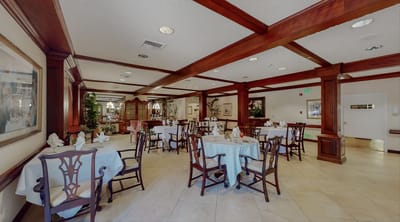
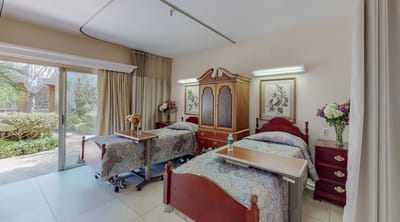
Mission Terrace, nestled in Santa Barbara, California, envisions a rehabilitation and skilled nursing community where the little joys of life contribute to a meaningful and fulfilling experience. Prioritizing comfort and an exceptional quality of life, Mission Terrace offers a range of amenities and activities. Residents can indulge in various enriching pursuits, from exercise classes and religious services to movies, bingo, and arts and crafts. The inviting decor, including elegant armoires and floral bedspreads, creates a homey atmosphere. Families are encouraged to spend quality time in the tastefully adorned surroundings, fostering a sense of welcome and comfort in the accessible location near downtown Santa Barbara.

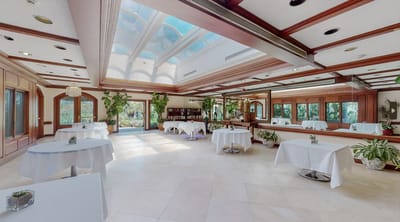
Mission Terrace’s commitment to excellence extends to the facilities and services provided. The ornate and eye-catching decor of the accommodations reflects a dedication to creating a comfortable living environment. For rehabilitation services, Mission Terrace stands out as Santa Barbara’s preferred choice for optimal recovery, especially for post-operative patients of various specialties. The culinary experience is elevated through collaboration between a licensed dietitian and an Executive Chef, ensuring residents savor fresh and delicious culinary delights prepared by trained assistants from a culinary institute. Mission Terrace offers skilled nursing and rehabilitation services at its best.

(805) 682-7443

Quality ratings

Measured by Centers for Medicare & Medicaid Services (CMS)

Overall rating Info The Overall CMS Rating combines results from health inspections, staffing levels and quality measures. Health inspections carry the most weight. Staffing and quality scores can increase or decrease the final rating based on performance compared to state and national standards.
▲ 58.8% Above CA avg. ▲ 58.8% Above CA avg.Click the badge to see the full State ranking.Click here to see the full State ranking.
Health Inspection Info Based on the results of the facility's three most recent standard inspections and any complaint investigations. CMS reviews the number, scope, and severity of deficiencies, with more recent findings weighted more heavily.
▲ 78.8% Above CA avg. ▲ 78.8% Above CA avg.Click the badge to see the full State ranking.Click here to see the full State ranking.
Staffing Info Measures average nursing staff hours per resident per day, including Registered Nurses (RNs) and total nursing staff. Ratings are adjusted based on the level of care residents require and are compared to state and national benchmarks.
▼ 36.3% Below CA avg. ▼ 36.3% Below CA avg.Click the badge to see the full State ranking.Click here to see the full State ranking.
Quality Measures Info Based on clinical and physical health indicators reported to CMS, such as hospital readmissions, falls, pressure ulcers, and improvements in mobility. These measures reflect how well residents' health needs are being managed.
▲ 22.4% Above CA avg. ▲ 22.4% Above CA avg.Click the badge to see the full State ranking.Click here to see the full State ranking.

Staffing hours breakdown

Info Daily nursing hours per resident by staff type, reported to CMS. Higher is generally better — compare this facility to state and national averages to see where staffing stands.

Hours per resident per day — compared to California state averages

Total nursing care / resident Info Total adjusted nursing hours per resident per day, combining RN, LPN, and aide time. CMS adjusts this for case-mix so facilities can be fairly compared.
4h 9m per day
This facility California avg (4h 13m per day)
vs California avg
-2%

3 of 6 metrics below state avg

Standout metric Physical Therapist is +40% above state avg
Staff typeHours / Day / Residentvs state avg
Registered Nurse (RN) Info RNs hold the highest nursing license and can assess residents, interpret test results, and direct care plans. More RN hours per day often signals stronger clinical oversight and faster response to health changes. 16m per day ▼ 59% State avg: 39m per day · National avg: 41m per day
LPN / LVN Info Licensed Practical Nurses (LPNs) or Licensed Vocational Nurses (LVNs) deliver routine hands-on care — medication administration, wound dressing, and monitoring vital signs. They work under RN supervision and make up a large share of daily bedside care. 1h 16m per day ▲ 4% State avg: 1h 13m per day · National avg: 52m per day
Nurse Aide Info Certified Nurse Aides (CNAs) provide the most direct day-to-day assistance: bathing, dressing, feeding, and mobility. Nurse aide hours are typically the largest staffing category and directly affect residents' quality of life. 2h 51m per day ▲ 8% State avg: 2h 39m per day · National avg: 2h 21m per day
Total Nursing (Weekend) Info Combined nursing hours (RN + LPN + Nurse Aide) per resident per day on weekends. Staffing often drops on weekends — this figure reveals whether the facility maintains adequate coverage outside of weekday hours. 3h 49m per day ▼ 6% State avg: 4h 5m per day · National avg: 3h 26m per day
Physical Therapist Info Hours per resident per day provided by licensed Physical Therapists (PTs) or PT Assistants. PT services help residents recover mobility after injury or illness and are especially important for post-acute (short-stay) rehabilitation. 7m per day ▲ 40% State avg: 5m per day · National avg: 4m per day
RN (Weekend) Info Registered nurse hours specifically on weekends. Facilities sometimes reduce RN presence on Saturdays and Sundays — a low weekend RN figure compared to weekday hours can indicate reduced clinical oversight when most administrative staff are absent. 12m per day ▼ 60% State avg: 30m per day · National avg: 29m per day

Capacity and availability

This home usually has availability

Occupancy lower than 85% suggests more openings may be available.

Lower occupancy than the California average: 84.7%
Occupancy rate 65.3%
Avg. Length of Stay 44 days
Occupancy rate
65.3%
Avg. Length of Stay
44 days

Who this home usually serves

TYPE OF STAY

Mostly short-term rehab stays

Most residents typically stay for a few weeks or months before returning home or moving on.

Breakdown by payment type

Medicare

40% of new residents, usually for short-term rehab.

Typical stay 1 - 2 months

Private pay

23% of new residents, often for short stays.

Typical stay 1 - 2 months

Medicaid

38% of new residents, often for long-term daily care.

Typical stay 1 - 2 months

Finances and operations

Privately-owned community
Home revenue
$24.8M
Profit
$505.3K
Privately-owned community
Home revenue
$24.8M
Profit
$505.3K
Payroll costs Info The portion of the home's budget spent on staff, including nurses, caregivers, and other employees who support care and operations.
$10.9M
44% of revenue
Other operating costs Info All remaining costs needed to run the home, such as food, utilities, building maintenance, supplies and administrative expenses.
$13.4M
Total costs $24.3M
Walk Score
Walk Score: 62 / 100
Moderately walkable. Some errands can be accomplished on foot, with a mix of nearby amenities.

Contact Mission Terrace

Health Inspection History

Inspections Since 2019
Total health inspections 10

California average 12.5


Last Health inspection on Dec 2024

Total health citations
14

California average 50.2

Citations per inspection
1.4

California average 4.65


Health citations are formal notices following inspections when they fail to comply with safety and care standards.

4 of 14 citations resulted from standard inspections; and 10 of 14 resulted from complaint investigations.

Breakdown of citation severity (last 7 years)
Critical Health citations
0
100% better than California average

California average: 0.4


Serious Health citations
0
100% better than California average

California average: 1

0 critical citations California average: 0.4

0 serious citations California average: 1

14 moderate citations California average: 47.2

0 minor citations California average: 1.5
Citations history (last 7 years)
Pharmacy moderate citation Dec 11, 2024
Corrected

Quality of Care moderate citation Dec 11, 2024
Corrected

Care Planning moderate citation Sep 25, 2024
Corrected

Resident Rights moderate citation Sep 25, 2024
Corrected

Financial Assistance for
Nursing Home in California

Mission Terrace is located in Santa Barbara, California.
Here are the financial assistance programs available to residents in California.

Get Financial aid guidance

Multipurpose Senior Services Program

MSSP (Medi-Cal Waiver)

Age 65+
General California resident, Medi-Cal eligible, nursing home risk.
Income Limits (2025) ~$2,829/month 300% FBR, individual
Asset Limits $2,000 (individual), $3,000 (couple).
CA

County-managed; waitlists possible.

Benefits
In-home support (4-6 hours/day) Respite care (14 days/year) Meals (~$6/meal) Transportation (8 trips/month) Care management

In-Home Supportive Services (IHSS)

California IHSS

Age 65+
General California resident, Medicaid-eligible or low-income.
Income Limits ~$1,732/month individual, Medi-Cal threshold
Asset Limits $2,000 individual
CA

Can hire family as caregivers.

Benefits
Personal care (up to 283 hours/month) Homemaker services Respite (varies)

Multipurpose Senior Services Program (MSSP)

CA MSSP

Age 65+
General California resident, Medi-Cal-eligible, nursing home-eligible but community-capable.
Income Limits ~$2,829/month 300% FBR, individual
Asset Limits $2,000 individual
CA

Available in 38 counties; waitlists common.

Benefits
Case management Respite care (up to 10 days/year) Minor home mods (avg. $500) Adult day care (~$50/day)

Property Tax Postponement Program (PTP)

CA PTP

Age 62+
General California resident, own and live in home, 40% equity.
Income Limits (2025) ~$51,500/year household, adjusted annually
Asset Limits Equity-based; no strict asset cap.
CA

Deferred taxes accrue interest (5% as of 2024); repaid upon sale/death.

Benefits
Property tax deferral (avg. $1,000-$3,000/year, varies by county)

Assisted Living Waiver (ALW)

CA ALW

Age 65+ or disabled
General California resident, Medi-Cal-eligible, nursing home-eligible.
Income Limits ~$2,829/month 300% FBR, individual
Asset Limits $2,000 individual
CA

Available in 15 counties (e.g., LA, Sacramento); waitlists common.

Benefits
Personal care in ALFs (5-7 hours/day) Medication management Social services

California CARES Program

CA CARES

Age
General Caregivers of California residents 60+ needing help with 3+ daily activities; no caregiver age limit.
Income Limits No strict limit; cost-sharing above ~$2,500/month threshold.
Asset Limits Not applicable; need-based.
CA

High demand in urban areas; complements IHSS respite.

Benefits
Respite care (up to 10 days/year) Counseling (4-6 sessions/year) Training (2-3 workshops/year) Supplies (~$200/year)

Places of interest near Mission Terrace

Address 1.7 miles from city center Info Estimated distance in miles from Santa Barbara's city center to Mission Terrace's address, calculated via Google Maps. — 0.23 miles to nearest hospital (Santa Barbara Cottage Hospital)

Calculate Travel Distance to Mission Terrace

Add your location

Address

Staffing Data

Reporting period: April 1 – June 30, 2025 (Q2 2025). Source: CMS Payroll-Based Journal report.

Total staff 277
Employees 186
Contractors 91
Staff to resident ratio 2.61:1
2613108% better than California average
California average ratio: 0.00:1 California average ratio: 0.00:1See full California ranking
Avg staff/day 91
Average shift 7.8 hours
0% compared with California average
California average: 7.7 hours California average shift: 7.7 hoursSee full California ranking
Total staff hours (quarter) 64,404

Nursing staff breakdown

Q2 2025 · Apr 1 – Jun 30 More info This data comes from the CMS Payroll-Based Journal report covering April 1 – June 30, 2025.
Registered Nurse

Manages medical care and health needs.

Total count 8
Average shift length Info Average shift length. Calculated as total hours divided by days worked and average staff per day. 7.8 hours

No contractors work on this role.

Licensed Practical Nurse

Assists with medical care and medications.

Total count 57
Average shift length Info Average shift length. Calculated as total hours divided by days worked and average staff per day. 8 hours

This role is partially covered by contractors.

Certified Nursing Assistant

Helps with daily care and mobility.

Total count 150
Average shift length Info Average shift length. Calculated as total hours divided by days worked and average staff per day. 7.9 hours

This role is partially covered by contractors.

Contractor staffing

Q2 2025 · Apr 1 – Jun 30 More info This data comes from the CMS Payroll-Based Journal report covering April 1 – June 30, 2025.

Total hours from contractors

7.4%

4,758 contractor hours this quarter

Certified Nursing Assistant: 57 Licensed Practical Nurse: 23 Qualified Activities Professional: 4 Other Physician: 2 RN Director of Nursing: 1 Medical Director: 1 Occupational Therapy Aide: 1 Occupational Therapy Assistant: 1 Clinical Nurse Specialist: 1

Staff by category

Q2 2025 · Apr 1 – Jun 30 More info This data comes from the CMS Payroll-Based Journal report covering April 1 – June 30, 2025.
Certified Nursing Assistant935715033,59891100%7.9
Licensed Practical Nurse34235713,25891100%8
Registered Nurse8082,36091100%7.8
Dental Services Staff110111,74691100%7.6
Other Dietary Services Staff7071,7359099%7.8
Physical Therapy Assistant6061,6878998%6.8
Speech Language Pathologist5051,5597582%7.7
Respiratory Therapy Technician6061,5148998%6.8
RN Director of Nursing5161,5097684%7.9
Physical Therapy Aide4041,3518189%7.4
Administrator2029946976%7.7
Qualified Social Worker2028638492%6.6
Nurse Practitioner1014886167%8
Dietitian1014836066%8.1
Mental Health Service Worker1014585763%8
Occupational Therapy Aide0113004853%6.3
Qualified Activities Professional0442972730%11
Clinical Nurse Specialist01168910%7.5
Medical Director011603336%1.8
Other Physician022543033%1.8
Occupational Therapy Assistant0112544%6.3
150 Certified Nursing Assistant
% of Days 100%
57 Licensed Practical Nurse
% of Days 100%
8 Registered Nurse
% of Days 100%
11 Dental Services Staff
% of Days 100%
7 Other Dietary Services Staff
% of Days 99%
6 Physical Therapy Assistant
% of Days 98%
5 Speech Language Pathologist
% of Days 82%
6 Respiratory Therapy Technician
% of Days 98%
6 RN Director of Nursing
% of Days 84%
4 Physical Therapy Aide
% of Days 89%
2 Administrator
% of Days 76%
2 Qualified Social Worker
% of Days 92%
1 Nurse Practitioner
% of Days 67%
1 Dietitian
% of Days 66%
1 Mental Health Service Worker
% of Days 63%
1 Occupational Therapy Aide
% of Days 53%
4 Qualified Activities Professional
% of Days 30%
1 Clinical Nurse Specialist
% of Days 10%
1 Medical Director
% of Days 36%
2 Other Physician
% of Days 33%
1 Occupational Therapy Assistant
% of Days 4%

Facility Characteristics

Source: CMS Long-Term Care Facility Characteristics (Data as of Jan 2026)

Total residents 106
Medicare
41
38.7% of residents
Private pay or other
65
61.3% of residents
Programs & Services
Residents Group

Residents meet regularly to discuss policies, care quality, and activities

Nurse Aide Training

State-approved Nurse Aide Training and Competency Evaluation Program on-site

Active Resident Council

Organized group of residents that meets regularly to discuss facility policies, quality of life, and activities.

Quality of care over time

These measures show how residents usually do over time at this home, based on health outcomes and preventive care.

High-risk clinical events score Info A composite score based on pressure ulcers, falls with injury, weight loss, walking ability decline, and activities of daily living decline. 7.2
8% worse than California average

California average: 6.6

Functional decline score Info A composite score based on activities of daily living decline, walking ability decline, and incontinence. 18.1
60% worse than California average

California average: 11.3

Long-stay resident measures
Significantly above average Info CMS star rating based on long-stay quality measure performance. 5 stars = significantly above average, 1 star = significantly below average.
Need for Help with Daily Activities Increased Info Percent of long-stay residents whose need for help with daily activities has increased 10.0%
10% better than California average

California average: 11.1%

Walking Ability Worsened Info Percent of long-stay residents whose ability to move independently worsened 15.3%
28% worse than California average

California average: 12.0%

Low Risk Residents with Bowel/Bladder Incontinence Info Percent of low risk long-stay residents who lose control of their bowels or bladder 29.0%
157% worse than California average

California average: 11.3%

Falls with Major Injury Info Percent of long-stay residents experiencing one or more falls with major injury 0.7%
59% better than California average

California average: 1.7%

High Risk Residents with Pressure Ulcers Info Percent of long-stay high risk residents with pressure ulcers 6.9%
39% worse than California average

California average: 5.0%

Urinary Tract Infection Info Percent of long-stay residents with a urinary tract infection 0.0%
100% better than California average

California average: 1.2%

Lost Too Much Weight Info Percent of long-stay residents who lose too much weight 3.1%
27% better than California average

California average: 4.2%

Depressive Symptoms Info Percent of long-stay residents who have depressive symptoms 3.6%
46% better than California average

California average: 6.7%

Antipsychotic Use Info Percent of long-stay residents who received an antipsychotic medication 20.1%
100% worse than California average

California average: 10.1%

Pneumococcal Vaccine Info Percent of long-stay residents assessed and appropriately given the pneumococcal vaccine 99.7%
In line with California average

California average: 98.5%

Influenza Vaccine Info Percent of long-stay residents assessed and appropriately given the seasonal influenza vaccine 100.0%
In line with California average

California average: 98.2%

Hospitalizations per 1,000 days Info Number of hospitalizations per 1,000 long-stay resident days. 1.47
35% better than California average

California average: 2.25

ED visits per 1,000 days Info Number of outpatient emergency department visits per 1,000 long-stay resident days. 0.91
43% better than California average

California average: 1.59

Short-stay resident measures
Significantly above average Info CMS star rating based on short-stay quality measure performance. 5 stars = much above average, 1 star = much below average.
Pneumococcal Vaccine Info Percent of short-stay residents assessed and appropriately given the pneumococcal vaccine 98.4%
5% better than California average

California average: 94.0%

Antipsychotic medication increase Info Percent of short-stay residents who newly received an antipsychotic medication 1.3%
10% better than California average

California average: 1.5%

Influenza Vaccine Info Percent of short-stay residents assessed and appropriately given the seasonal influenza vaccine 93.9%
In line with California average

California average: 93.2%

Re-hospitalized after SNF stay Info Percentage of short-stay residents who were re-hospitalized after their nursing home admission. 22.7%
In line with California average

California average: 23.2%

Emergency department visits Info Percentage of short-stay residents who had an outpatient emergency department visit. 7.9%
29% better than California average

California average: 11.2%

Falls with major injury Info Percentage of SNF residents who experience falls with major injury during their stay. 0.0%
100% better than California average

California average: 0.8%

Ability to care for self at discharge Info Percentage of residents at or above expected ability to care for themselves at discharge. 75.0%
40% better than California average

California average: 53.7%

Successful return to home or community Info Rate of successful return to home or community from a skilled nursing facility. 66.7%
32% better than California average

California average: 50.6%

Penalties and fines

Federal penalties imposed by CMS for regulatory violations, including civil money penalties (fines) and denials of payment for new Medicare/Medicaid admissions.

Source: CMS Penalties Database

No penalties in the past 3 years

No civil money penalties or payment denials were reported in the last 3 years.

Guides for Better Senior Living

Care Cost Calculator: See Prices in Your Area

Nursing Home Data Explorer

Don’t Wait Too Long: 7 Red Flag Signs Your Parent Needs Assisted Living Now

The True Cost of Assisted Living in 2025 – And How Families Are Paying For It

Understanding Senior Living Costs: Pricing Models, Discounts & Financial Assistance

Frequently Asked Questions about Mission Terrace

What neighborhood is Mission Terrace in?

Mission Terrace is in the Samarkand neighborhood.

Is Mission Terrace in a walkable area?

Mission Terrace has a walk score of 62. Moderately walkable. Some errands can be accomplished on foot, with a mix of nearby amenities.

What is the phone number of Mission Terrace?

(805) 682-7443 will put you in contact with the team at Mission Terrace.

Is Mission Terrace Medicare or Medicaid certified?

Yes — Mission Terrace is a CMS-certified provider of Medicare and Medicaid.

Explore Open Rooms
1 Contact details
2 What type of senior care service are you looking for?
3 What budget do you have in mind for senior care?
4 How soon do you need to find care?
5 Additional details

Thank you for your interest!

Our team will be in touch shortly to help with next steps.