Recover-Care Richmond LLC
Nursing Home & Assisted Living · Richmond, KS
CMS overall rating Info CMS (the Centers for Medicare & Medicaid Services) is the federal agency that rates nursing home quality. Its Overall Rating runs from 1 to 5 stars, combining health inspections, staffing, and quality measures, with inspections weighted most heavily.

Recover-Care Richmond LLC

Nursing Home & Assisted Living · Richmond, KS
CMS overall rating Info CMS (the Centers for Medicare & Medicaid Services) is the federal agency that rates nursing home quality. Its Overall Rating runs from 1 to 5 stars, combining health inspections, staffing, and quality measures, with inspections weighted most heavily.
Calculator: See prices in your area
Recover-Care Richmond LLC accepts Medicare, Medicaid, and private pay.

Overview of Recover-Care Richmond

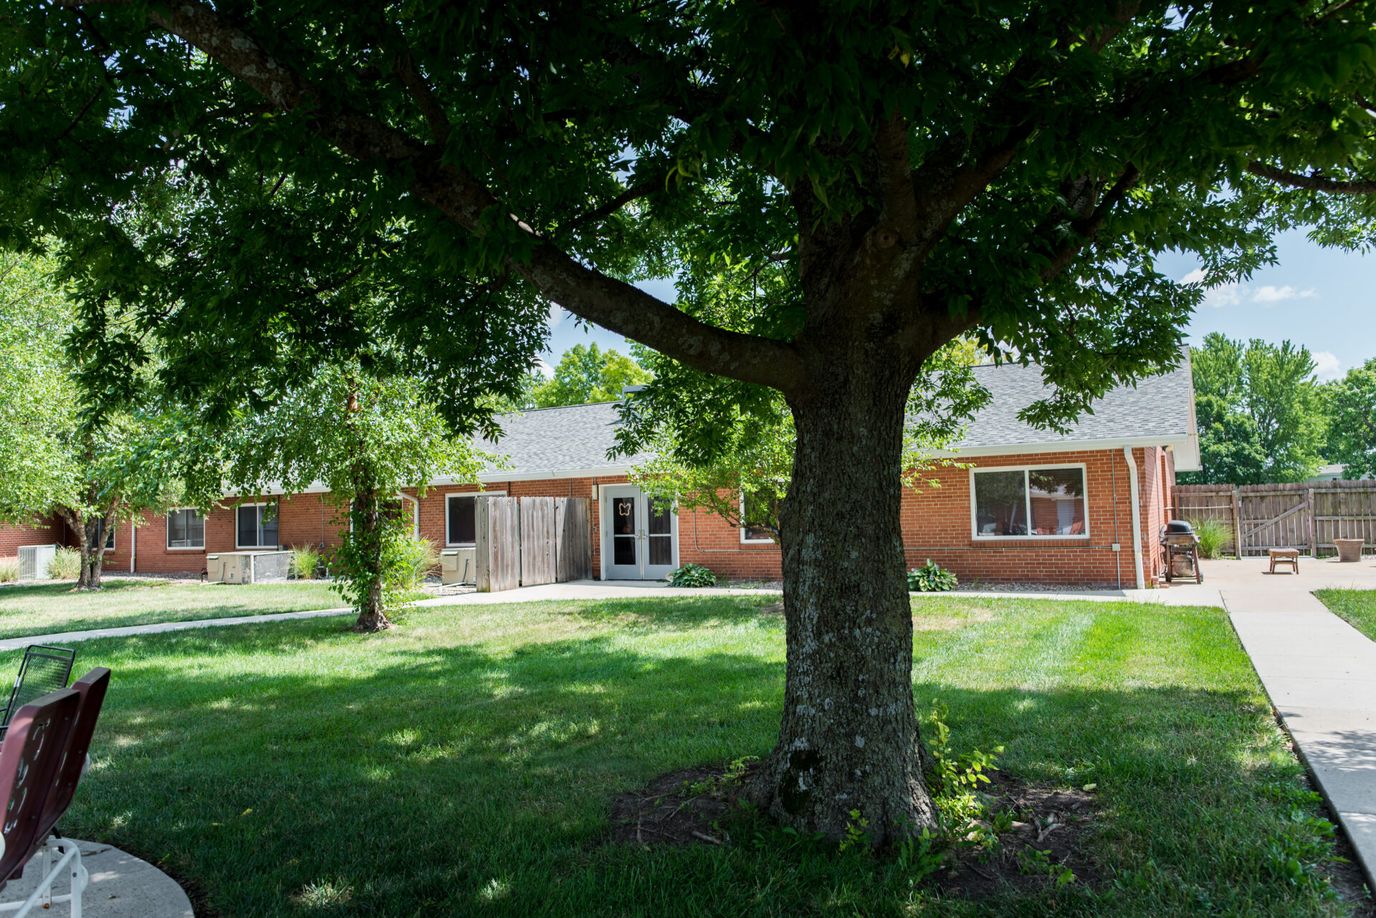
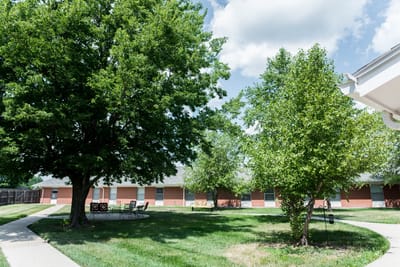
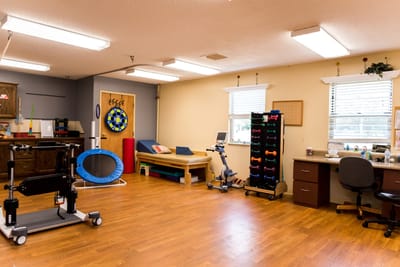
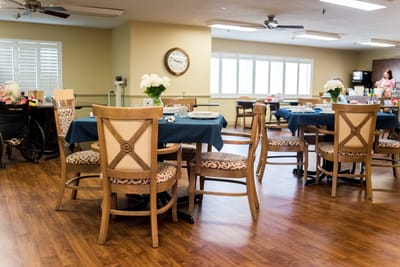
Recover-Care Richmond is a 60-bed skilled nursing and memory care facility at 340 East South Street in Richmond, Kansas. It’s operated by Richmond SNF Realty LLC in Franklin County. Accepted are Medicare, Medicaid, and private pay, with a mix of short-term rehabilitation and long-term care residents and an average stay duration of 177 days.

CMS grades the facility 1 star, 63.9 percent below Kansas’ average, with all four sub-ratings below state mean. Nurse hours reach 3h 15m per resident per day, 31 percent below Kansas’ average and ranked 131st of 141 Kansas skilled nursing facilities. Across 5 inspections since 2021, the facility totaled 39 citations, all moderate in severity, with no critical or serious findings, averaging 11.1 deficiencies annually, 56 percent above Kansas’ average. No fines or payment denials issued in the past three years, and the latest inspection found the facility in full compliance. At 80 percent occupancy, aligned with Kansas’s 79.5 percent average, the facility has some availability.

An active resident council exists.

Recover-Care Richmond caters to skilled nursing and memory care residents in rural Franklin County.

Quality ratings

Measured by Centers for Medicare & Medicaid Services (CMS)

Overall rating Info The Overall CMS Rating combines results from health inspections, staffing levels and quality measures. Health inspections carry the most weight. Staffing and quality scores can increase or decrease the final rating based on performance compared to state and national standards.
Health Inspection Info Based on the results of the facility's three most recent standard inspections and any complaint investigations. CMS reviews the number, scope, and severity of deficiencies, with more recent findings weighted more heavily.
Staffing Info Measures average nursing staff hours per resident per day, including Registered Nurses (RNs) and total nursing staff. Ratings are adjusted based on the level of care residents require and are compared to state and national benchmarks.
Quality Measures Info Based on clinical and physical health indicators reported to CMS, such as hospital readmissions, falls, pressure ulcers, and improvements in mobility. These measures reflect how well residents' health needs are being managed.

Staffing hours breakdown

Info Daily nursing hours per resident by staff type, reported to CMS. Higher is generally better — compare this facility to state and national averages to see where staffing stands.

Hours per resident per day — compared to state averages

Total nursing care / resident Info Total adjusted nursing hours per resident per day, combining RN, LPN, and aide time. CMS adjusts this for case-mix so facilities can be fairly compared.
3h 15m per day
vs avg
Staff typeHours / Day / Residentvs state avg
Registered Nurse (RN) Info RNs hold the highest nursing license and can assess residents, interpret test results, and direct care plans. More RN hours per day often signals stronger clinical oversight and faster response to health changes. 39m per day
LPN / LVN Info Licensed Practical Nurses (LPNs) or Licensed Vocational Nurses (LVNs) deliver routine hands-on care — medication administration, wound dressing, and monitoring vital signs. They work under RN supervision and make up a large share of daily bedside care. 19m per day
Nurse Aide Info Certified Nurse Aides (CNAs) provide the most direct day-to-day assistance: bathing, dressing, feeding, and mobility. Nurse aide hours are typically the largest staffing category and directly affect residents' quality of life. 2h 38m per day
Weekend Total Nursing Info Combined nursing hours (RN + LPN + Nurse Aide) per resident per day on weekends. Staffing often drops on weekends — this figure reveals whether the facility maintains adequate coverage outside of weekday hours. 3h 17m per day
Physical Therapist Info Hours per resident per day provided by licensed Physical Therapists (PTs) or PT Assistants. PT services help residents recover mobility after injury or illness and are especially important for post-acute (short-stay) rehabilitation. 1m per day
Weekend RN Info Registered nurse hours specifically on weekends. Facilities sometimes reduce RN presence on Saturdays and Sundays — a low weekend RN figure compared to weekday hours can indicate reduced clinical oversight when most administrative staff are absent. 31m per day

Capacity and availability

Avg. Length of Stay Info Average number of days residents stay at this facility, based on CMS cost report data. Shorter stays often reflect post-acute or rehab care; longer stays reflect long-term care.
177 days
Bed community size
60-bed community Rank #94 / 224Bed count — State benchmarkedThis home is ranked 94th out of 224 homes in Kansas. Shows this facility's certified or reported bed count compared to other Kansas facilities. Larger communities may offer more amenities, programs, and on-site services for residents and families.Rankings are based only on facilities in Kansas that report data for that category. Facilities without available data are excluded from the ranking.Click the rank badge to see the full State ranking.Click here to see the full State ranking.
A moderately sized community that may balance personal attention with shared amenities and social activities.
Walk Score
Walk Score: 7 / 100 Rank #343 / 363Walk Score — State benchmarkedThis home is ranked 343rd out of 363 homes in Kansas. Shows how walkable this facility's neighborhood is compared to the average Walk Score across Kansas facilities. Higher scores benefit residents, families, and staff.Rankings are based only on facilities in Kansas that report data for that category. Facilities without available data are excluded from the ranking.Click the rank badge to see the full State ranking.Click here to see the full State ranking.
Car-dependent. Most errands require a car, with limited nearby walkable options.

About this community

Occupancy

Occupancy rate
80%
Similar to the Kansas average: 79.5%
Occupied beds
48 / 60
Average occupied beds in Kansas homes 50 beds

License Details

Facility TypeNursing Facility
StatusActive
CountyFranklin
License Number175444
CMS Certification Number175444

Ownership & Operating Entity

Recover-Care Richmond LLC is administered by Kevin Bellinger.

Owner NameRichmond Snf Realty LLC

Contact Recover-Care Richmond LLC

Inspection History

In Kansas, the Department for Aging and Disability Services, Survey and Certification Commission performs the unannounced inspections required for facility licensing and federal certification.

Since 2012 · 14 years of data 151 deficiencies

Inspection Scorecard Info This scorecard compares key inspection, deficiency, and complaint metrics at this facility against the Kansas state average. Metrics rated ≥15% worse than average are highlighted in red; those ≥15% better are highlighted in green.

Since 2012 vs. Kansas state average
Overall vs. KS average 2 Worse Metrics worse than Kansas average:
• Total deficiencies (51% above)
• Deficiencies per year (52% above)
0 Better No metrics in this bucket.
Latest Inspection March 20, 2025

Deficiencies Info Deficiencies are formal regulatory issues recorded during state inspections.

This FacilityKS Averagevs. KS Avg
Total deficiencies Info Formal regulatory issues recorded by inspectors across all inspection types. 151100 This facility has 51% more total deficiencies than a typical Kansas assisted living residence (151 vs. KS avg 100).↑ 51% worse
Deficiencies per year Info Average deficiencies per year since 2012. 10.87.1 This facility has 52% more deficiencies per year than a typical Kansas assisted living residence (10.8 vs. KS avg 7.1).↑ 52% worse

Inspection Reports Summary Info An editor-reviewed summary of the themes and findings across this facility's recent inspection reports.

  • The most recent inspection on March 18, 2016, found that all previously cited deficiencies had been corrected, with no outstanding issues noted at that time. Earlier inspections showed a pattern of deficiencies primarily related to dietary services, including failure to retain a certified dietary manager and sanitation problems in the kitchen, as well as issues with resident care documentation, medication administration, and facility maintenance. Complaint investigations substantiated failures in oral care, restorative services, catheter care, and timely medication administration, some of which led to resident harm or risk. Enforcement actions included denial of payment for new Medicare admissions at times, but no fines or license suspensions were listed in the available reports. The facility’s record shows improvement over time, with repeated revisits confirming correction of prior deficiencies and substantial compliance achieved by the most recent survey.

Health Inspection History

Inspections since 2021
Total health inspections 5

State average N/A


Last Health inspection on Feb 2025

Total health citations
39

State average N/A

Citations per inspection
7.8

State average N/A


Health citations are formal notices following inspections when they fail to comply with safety and care standards.

31 of 39 citations resulted from standard inspections; 7 of 39 resulted from complaint investigations; and 1 of 39 came from combined inspections (standard and complaint).

Breakdown of citation severity (last 5 years)
Critical health citations
0
In line with State average

State average: N/A


Serious health citations
0
In line with State average

State average: N/A

0 critical citations State average: N/A

0 serious citations State average: N/A

39 moderate citations State average: N/A

0 minor citations State average: N/A
Citations history (last 5 years)
Administration moderate citation Feb 26, 2025
Corrected

Infection Control moderate citation Feb 26, 2025
Corrected

Nursing Services moderate citation Feb 26, 2025
Corrected

Nursing Services moderate citation Feb 26, 2025
Corrected

Staffing Data

Reporting period: October 1 – December 31, 2025 (Q4 2025). Source: CMS Payroll-Based Journal report.

Total staff 81
Employees 63
Contractors 18
Staff to resident ratio 1.72 : 1
0% compared with State average

State average ratio: 0 : 0

Avg staff/day 23
Average shift 8.8 hours
0% compared with State average

State average: 0 hours

Total staff hours (quarter) 18,550

Nursing staff breakdown

Q4 2025 · Oct 1 – Dec 31 More info This data comes from the CMS Payroll-Based Journal report covering October 1 – December 31, 2025.
Registered Nurse

Manages medical care and health needs.

RN Staff Info 11 total: 4 full-time employees and 7 contractors. 11
Average shift length Info Average shift length. Calculated as total hours divided by days worked and average staff per day. 9.2 hours
Licensed Practical Nurse

Assists with medical care and medications.

LPN Staff Info All 4 LPN Staff are full-time employees. No contractors work on this role. 4
Average shift length Info Average shift length. Calculated as total hours divided by days worked and average staff per day. 10.9 hours
Certified Nursing Assistant

Helps with daily care and mobility.

CNA Staff Info All 39 CNA Staff are full-time employees. No contractors work on this role. 39
Average shift length Info Average shift length. Calculated as total hours divided by days worked and average staff per day. 9.5 hours

Contractor staffing

Q4 2025 · Oct 1 – Dec 31 More info This data comes from the CMS Payroll-Based Journal report covering October 1 – December 31, 2025.

Total hours from contractors

16.1%

2,984 contractor hours this quarter

Registered Nurse: 7 Respiratory Therapy Technician: 4 Physical Therapy Aide: 3 Speech Language Pathologist: 2 Qualified Social Worker: 1 Physical Therapy Assistant: 1

Staff by category

Q4 2025 · Oct 1 – Dec 31 More info This data comes from the CMS Payroll-Based Journal report covering October 1 – December 31, 2025.
Certified Nursing Assistant390399,63492100%9.5
Medication Aide/Technician8081,9719098%11.1
Registered Nurse47111,94092100%9.2
Physical Therapy Aide0338686672%6.5
RN Director of Nursing2027696470%7.5
Licensed Practical Nurse4046555358%10.9
Dietitian1015346672%8.1
Administrator1015286672%8
Nurse Practitioner2024906166%7.6
Clinical Nurse Specialist1014786065%8
Speech Language Pathologist0223746166%6.1
Physical Therapy Assistant0111002426%4.2
Qualified Social Worker011813134%2.6
Respiratory Therapy Technician044701921%3.7
Nurse Aide in Training10160910%6.7
39 Certified Nursing Assistant
% of Days 100%
8 Medication Aide/Technician
% of Days 98%
11 Registered Nurse
% of Days 100%
3 Physical Therapy Aide
% of Days 72%
2 RN Director of Nursing
% of Days 70%
4 Licensed Practical Nurse
% of Days 58%
1 Dietitian
% of Days 72%
1 Administrator
% of Days 72%
2 Nurse Practitioner
% of Days 66%
1 Clinical Nurse Specialist
% of Days 65%
2 Speech Language Pathologist
% of Days 66%
1 Physical Therapy Assistant
% of Days 26%
1 Qualified Social Worker
% of Days 34%
4 Respiratory Therapy Technician
% of Days 21%
1 Nurse Aide in Training
% of Days 10%

Penalties and fines

Federal penalties imposed by CMS for regulatory violations, including civil money penalties (fines) and denials of payment for new Medicare/Medicaid admissions.

Source: CMS Penalties Database

No penalties in the past 3 years

No civil money penalties or payment denials were reported in the last 3 years.

Quality of care over time

These measures show how residents usually do over time at this home, based on health outcomes and preventive care.

High-risk clinical events score Info A composite score based on pressure ulcers, falls with injury, weight loss, walking ability decline, and activities of daily living decline. 16.0
52% worse than State average

State average: 10.5

Functional decline score Info A composite score based on activities of daily living decline, walking ability decline, and incontinence. 35.9
73% worse than State average

State average: 20.7

Long-stay resident measures
Need for Help with Daily Activities Increased Info Percent of long-stay residents whose need for help with daily activities has increased 34.6%
82% worse than State average

State average: 19.0%

Walking Ability Worsened Info Percent of long-stay residents whose ability to move independently worsened 36.1%
86% worse than State average

State average: 19.4%

Low Risk Residents with Bowel/Bladder Incontinence Info Percent of low risk long-stay residents who lose control of their bowels or bladder 37.0%
56% worse than State average

State average: 23.8%

Falls with Major Injury Info Percent of long-stay residents experiencing one or more falls with major injury 5.2%
18% worse than State average

State average: 4.4%

High Risk Residents with Pressure Ulcers Info Percent of long-stay high risk residents with pressure ulcers 0.9%
80% better than State average

State average: 4.6%

Urinary Tract Infection Info Percent of long-stay residents with a urinary tract infection 1.8%
42% better than State average

State average: 3.1%

Lost Too Much Weight Info Percent of long-stay residents who lose too much weight 2.9%
42% better than State average

State average: 5.1%

Depressive Symptoms Info Percent of long-stay residents who have depressive symptoms 13.3%
157% worse than State average

State average: 5.2%

Antipsychotic Use Info Percent of long-stay residents who received an antipsychotic medication 31.0%
83% worse than State average

State average: 16.9%

Pneumococcal Vaccine Info Percent of long-stay residents assessed and appropriately given the pneumococcal vaccine 98.9%
8% better than State average

State average: 91.9%

Influenza Vaccine Info Percent of long-stay residents assessed and appropriately given the seasonal influenza vaccine 95.4%
In line with State average

State average: 95.5%

Short-stay resident measures
Pneumococcal Vaccine Info Percent of short-stay residents assessed and appropriately given the pneumococcal vaccine 76.2%
In line with State average

State average: 75.6%

Antipsychotic medication increase Info Percent of short-stay residents who newly received an antipsychotic medication 3.3%
51% worse than State average

State average: 2.2%

Influenza Vaccine Info Percent of short-stay residents assessed and appropriately given the seasonal influenza vaccine 73.5%
In line with State average

State average: 73.5%

Breakdown by payment type

Medicare

29% of new residents, usually for short-term rehab.

Typical stay 1 - 2 months

Private pay

53% of new residents, often for short stays.

Typical stay 2 - 3 months

Medicaid

18% of new residents, often for long-term daily care.

Typical stay 1 - 2 years

Facility Characteristics

Source: CMS Long-Term Care Facility Characteristics (Data as of Jan 2026)

Total residents 47
Medicare
8
17% of residents
Medicaid
28
59.6% of residents
Private pay or other
11
23.4% of residents
Programs & Services
Residents Group

Residents meet regularly to discuss policies, care quality, and activities

Active Resident Council

Organized group of residents that meets regularly to discuss facility policies, quality of life, and activities.

Finances and operations

Based on CMS SNF Cost Report for fiscal year ending in 12/2023.

For-profit
Corporation
Net patient revenue Info Net patient revenue — what the home actually collects for resident care, after contractual allowances, bad debt and discounts are subtracted from its gross charges (CMS cost report, Worksheet G-3). It covers resident care only; money the home earns from other sources is shown separately as "Other income."
$4.7M
Net patient income Info Net patient income: net patient revenue minus the home's total operating expenses. A positive figure means it earns more from resident care than it spends to deliver it; a negative figure means the opposite. It excludes non-operating "other income."
-$162.2K
For-profit Corporation
Net patient revenue Info Net patient revenue — what the home actually collects for resident care, after contractual allowances, bad debt and discounts are subtracted from its gross charges (CMS cost report, Worksheet G-3). It covers resident care only; money the home earns from other sources is shown separately as "Other income."
$4.7M
Net patient income Info Net patient income: net patient revenue minus the home's total operating expenses. A positive figure means it earns more from resident care than it spends to deliver it; a negative figure means the opposite. It excludes non-operating "other income."
-$162.2K
Other income Info Money the home earns outside of resident care — such as investments, grants, rentals and other non-operating sources (CMS cost report, Worksheet G-3). It is tracked separately from net patient revenue: it is not part of that figure, and it is not included in net patient income.
$35.9K
Payroll costs Info Staff salaries plus wage-related costs — benefits such as payroll taxes, health insurance and retirement — from the home's own accounting records (CMS cost report, Worksheet A). Contract or agency labor is counted separately, under other operating costs.
$2.6M 54.8% of net patient revenue Info Payroll as a share of revenue: staff salaries and wage-related benefits divided by net patient revenue. A higher figure means more of each revenue dollar goes to staff pay.
Other operating costs Info Everything it costs to run the home apart from payroll — food, utilities, supplies, maintenance, contract labor and administration. Calculated as total operating expense minus payroll (staff salaries and wage-related benefits).
$2.3M
Total costs Info The home's total operating expense for the year — all the costs of running it, salaries included (CMS cost report, Worksheet G-3).
$4.8M

Who this home usually serves

TYPE OF STAY

Mix of rehab and long-term care

This home supports both short-term rehab and long-term care, with residents staying for a wide range of durations.

Most new residents arrive under private pay (53% of admissions), and a typical private pay stay runs around 2 - 3 months.

Admissions
98 total

Coverage residents most often arrive under.

Medicare 29%
Private pay 53%
Medicaid 18%
Discharges
94 total

Coverage residents most often leave under.

Medicare 22%
Private pay 62%
Medicaid 16%

Places of interest near Recover-Care Richmond LLC

Address 0.0 miles from city center Info Estimated distance in miles from Richmond's city center to Recover-Care Richmond LLC's address, calculated via Google Maps.

Calculate Travel Distance to Recover-Care Richmond LLC

Add your location

Address

Compare Nursing Homes around the area

The information below is reported by the Kansas Department for Aging and Disability Services.

Lexington Park Assisted Living
NH
AL
IL
SNF
Topeka (West Southwest 2) -60 A+ 60 studio / 1 bed
Larksfield Place Independent Living
NH
AL
IL
MC
RC
SNF
Wichita -80 A+ 32 -
Brewster Place
NH
AL
IL
MC
RC
SNF
Topeka (South/Southeast 1) -141 A+ 56 -
Aberdeen Village
NH
AL
IL
MC
SNF
Olathe (Aberdeen Village) -60 - 45 -
Recover-Care Richmond LLC
NH
AL
Richmond -60 - 7 -

Frequently Asked Questions about Recover-Care Richmond LLC

Who is the owner of Recover-Care Richmond LLC?

Recover-Care Richmond LLC is legally operated by Richmond Snf Realty LLC, and administered by Kevin Bellinger.

Is Recover-Care Richmond LLC in a walkable area?

Recover-Care Richmond LLC has a walk score of 7. Car-dependent. Most errands require a car, with limited nearby walkable options.

What is the license number of Recover-Care Richmond LLC?

According to KS state health department records, Recover-Care Richmond LLC's license number is 175444.

What is the occupancy rate at Recover-Care Richmond LLC?

Recover-Care Richmond LLC's occupancy is 80%.

Does Recover-Care Richmond LLC operate as a for-profit or non-profit?

Recover-Care Richmond LLC is registered as a for-profit in KS.

Who is the administrator of Recover-Care Richmond LLC?

Kevin Bellinger is the administrator of Recover-Care Richmond LLC.

How many beds does Recover-Care Richmond LLC have?

Recover-Care Richmond LLC has 60 beds.

Guides for Better Senior Living

Care Cost Calculator: See Prices in Your Area

Nursing Home Data Explorer

Don’t Wait Too Long: 7 Red Flag Signs Your Parent Needs Assisted Living Now

The True Cost of Assisted Living in 2025 – And How Families Are Paying For It

Understanding Senior Living Costs: Pricing Models, Discounts & Financial Assistance