


Total staff
517
Employees
511
Contractors
6
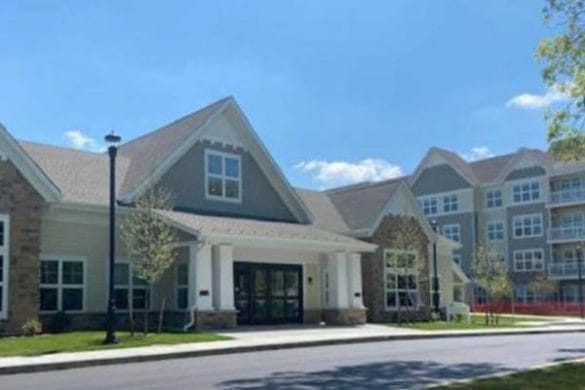


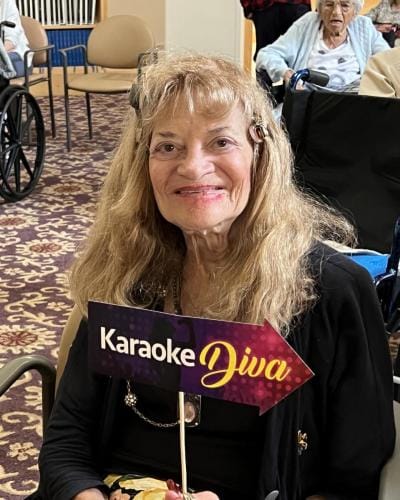


Gurwin Jewish Nursing & Rehabilitation Center in Commack, NY, is a nursing home that offers rehabilitation and skilled nursing. The community’s nurturing and welcoming environment ensures older adults’ comfort and safety. With 24-hour care, comprehensive therapies, and recreational activities, residents can maintain their independence. To meet residents’ unique needs and preferences, customized care plans are also provided for their recovery and wellness.
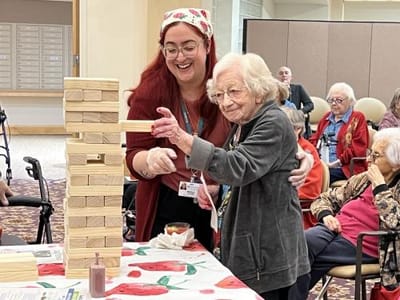
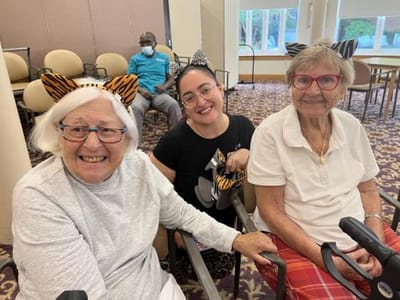
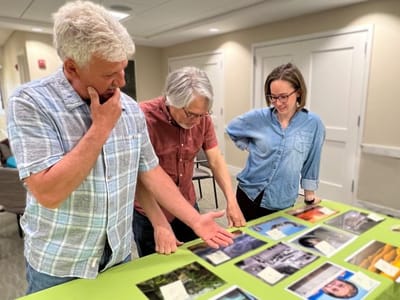
Social events, light exercises, and educational programs provide residents with more opportunities to make friends and gain meaningful experiences. Thoughtfully curated amenities and spacious common areas ensure residents can rest and move around comfortably. Set along the road in the residential area of Commack, the community ensures residents have a laid-back lifestyle. Providing exceptional standards of care, this nursing home is one of the best choices for senior living in New York.
| Staff type | Hours / Day / Resident | vs state avg |
|---|---|---|
|
Registered Nurse (RN)
| 51m per day | ▲ 22% State avg: 42m per day · National avg: 41m per day |
|
LPN / LVN
| 42m per day | ▼ 11% State avg: 47m per day · National avg: 52m per day |
|
Nurse Aide
| 2h 21m per day | ▲ 8% State avg: 2h 11m per day · National avg: 2h 20m per day |
|
Weekend Total Nursing
| 3h 20m per day | ▲ 3% State avg: 3h 14m per day · National avg: 3h 27m per day |
|
Physical Therapist
| 5m per day | ▼ 33% State avg: 7m per day · National avg: 4m per day |
|
Weekend RN
| 27m per day | ▼ 7% State avg: 29m per day · National avg: 29m per day |
Reporting period: October 1 – December 31, 2025 (Q4 2025). Source: CMS Payroll-Based Journal report.
Manages medical care and health needs.
Assists with medical care and medications.
Helps with daily care and mobility.
Total hours from contractors
1,915 contractor hours this quarter
| Certified Nursing Assistant | 224 | 0 | 224 | 93,020 | 92 | 100% | 7.8 |
| Registered Nurse | 83 | 0 | 83 | 28,078 | 92 | 100% | 7.6 |
| Licensed Practical Nurse | 67 | 0 | 67 | 26,437 | 92 | 100% | 8.3 |
| Physical Therapy Aide | 20 | 0 | 20 | 6,940 | 92 | 100% | 7.3 |
| Speech Language Pathologist | 19 | 0 | 19 | 5,880 | 92 | 100% | 7.3 |
| Clinical Nurse Specialist | 13 | 0 | 13 | 5,188 | 73 | 79% | 7.4 |
| Qualified Activities Professional | 17 | 0 | 17 | 3,721 | 92 | 100% | 8.4 |
| Mental Health Service Worker | 8 | 0 | 8 | 3,480 | 76 | 83% | 7.5 |
| Respiratory Therapy Technician | 11 | 1 | 12 | 2,962 | 92 | 100% | 7 |
| Occupational Therapy Assistant | 8 | 0 | 8 | 2,554 | 88 | 96% | 7.4 |
| Dietitian | 6 | 0 | 6 | 2,354 | 92 | 100% | 7.3 |
| Physical Therapy Assistant | 12 | 0 | 12 | 2,296 | 89 | 97% | 6.6 |
| Occupational Therapy Aide | 2 | 3 | 5 | 2,088 | 64 | 70% | 8 |
| Qualified Social Worker | 6 | 0 | 6 | 1,284 | 83 | 90% | 7.1 |
| Other Social Services Staff | 3 | 0 | 3 | 1,242 | 87 | 95% | 7.4 |
| Administrator | 3 | 0 | 3 | 1,154 | 61 | 66% | 7.5 |
| Other Activities Staff | 3 | 0 | 3 | 1,041 | 79 | 86% | 9.2 |
| RN Director of Nursing | 2 | 0 | 2 | 887 | 64 | 70% | 7.4 |
| Other Dietary Services Staff | 2 | 1 | 3 | 509 | 79 | 86% | 3.7 |
| Nurse Practitioner | 1 | 0 | 1 | 443 | 59 | 64% | 7.5 |
| Respiratory Therapist | 1 | 0 | 1 | 406 | 57 | 62% | 7.1 |
| Medical Director | 0 | 1 | 1 | 204 | 51 | 55% | 4 |
Federal penalties imposed by CMS for regulatory violations, including civil money penalties (fines) and denials of payment for new Medicare/Medicaid admissions.
Source: CMS Penalties Database
No penalties in the past 3 years
No civil money penalties or payment denials were reported in the last 3 years.
These measures show how residents usually do over time at this home, based on health outcomes and preventive care.
New York average: 9.8
New York average: 18.1
New York average: 16.4%
New York average: 16.6%
New York average: 21.4%
New York average: 3.0%
New York average: 7.2%
New York average: 1.4%
New York average: 6.1%
New York average: 18.1%
New York average: 12.6%
New York average: 91.4%
New York average: 95.2%
New York average: 76.6%
New York average: 1.3%
New York average: 78.8%
Quality measures are calculated from Minimum Data Set (MDS) assessments. For most measures, lower percentages indicate better care quality.
70% of new residents, usually for short-term rehab.
16% of new residents, often for short stays.
14% of new residents, often for long-term daily care.
Source: CMS Long-Term Care Facility Characteristics (Data as of Jan 2026)
Residents meet regularly to discuss policies, care quality, and activities
State-approved Nurse Aide Training and Competency Evaluation Program on-site
Part of a Continuing Care Retirement Community offering multiple care levels
Organized group of residents that meets regularly to discuss facility policies, quality of life, and activities.
Data sourced from CMS Long-Term Care Facility Characteristics quarterly report. Payer mix reflects the current resident census by primary payment source.
Historical financial and operational data for Gurwin Jewish Nursing & Rehabilitation Center from 2011–2023, based on CMS SNF Cost Reports.
Key figures below are for fiscal year ending in 12/2023.
Based on CMS SNF Cost Report for fiscal year ending in 12/2023.
No pets allowed
Building Type: 3-story
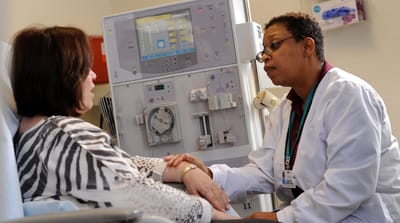
Rehabilitative Support

On-site Medical Care and Health Services
Most residents typically stay for a few weeks or months before returning home or moving on.
Most new residents arrive under Medicare (70% of admissions), and a typical Medicare stay runs around 1 - 2 months.
Coverage residents most often arrive under.
Coverage residents most often leave under.
![]() 68 Hauppauge Rd, Commack, NY 11725
68 Hauppauge Rd, Commack, NY 11725
Add your location
Gurwin Jewish Nursing & Rehabilitation Center is located in Commack, New York State.
Here are the financial assistance programs available to residents in New York State.
Gurwin Jewish Nursing & Rehabilitation Center is in the East Mission Avenue neighborhood.
Gurwin Jewish Nursing & Rehabilitation Center has a walk score of 88. Very walkable. Most errands can be accomplished on foot, and many essentials are within a short walk.
Gurwin Jewish Nursing & Rehabilitation Center's occupancy is 85.6%.
No, Gurwin Jewish Nursing & Rehabilitation Center has a no-pet policy.
Gurwin Jewish Nursing & Rehabilitation Center is registered as a non-profit.
Yes — there are 62 photos of Gurwin Jewish Nursing & Rehabilitation Center in the photo gallery on this page.
Gurwin Jewish Nursing & Rehabilitation Center is located at 68 Hauppauge Rd, Commack, NY 11725.
Care Cost Calculator: See Prices in Your Area
Nursing Home Data Explorer
Don’t Wait Too Long: 7 Red Flag Signs Your Parent Needs Assisted Living Now
The True Cost of Assisted Living in 2025 – And How Families Are Paying For It
Understanding Senior Living Costs: Pricing Models, Discounts & Financial Assistance


