Mostly short-term rehab stays
Most residents typically stay for a few weeks or months before returning home or moving on.
Most new residents arrive under Medicare (72% of admissions), and a typical Medicare stay runs around 1 - 2 months.
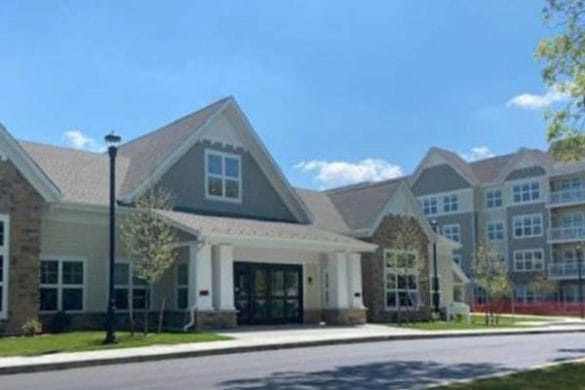
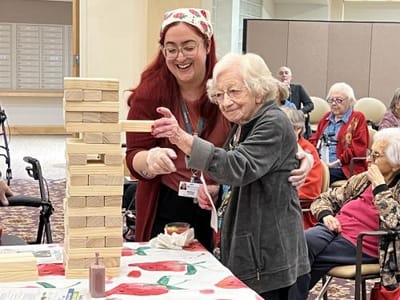
Gurwin Jewish Nursing & Rehabilitation Center in Commack, NY, is a nursing home that offers rehabilitation and skilled nursing. The community’s nurturing and welcoming environment ensures older adults’ comfort and safety. With 24-hour care, comprehensive therapies, and recreational activities, residents can maintain their independence. To meet residents’ unique needs and preferences, customized care plans are also provided for their recovery and wellness.
Social events, light exercises, and educational programs provide residents with more opportunities to make friends and gain meaningful experiences. Thoughtfully curated amenities and spacious common areas ensure residents can rest and move around comfortably. Set along the road in the residential area of Commack, the community ensures residents have a laid-back lifestyle. Providing exceptional standards of care, this nursing home is one of the best choices for senior living in New York.
Standout metric: Registered nurse (RN) is +7% above New York average
4 of 6 metrics below New York average
99% of staff hours were worked by the facility's own employees
New York average: 87.9% · Contractors this quarter: Occupational Therapy Aide (3), Respiratory Therapy Technician (1), Medical Director (1), Other Dietary Services Staff (1)
Why it matters: employees work here week after week and get to know each resident's routines and needs. Agency contractors often rotate between facilities, so a higher employee share usually means more consistent care.
High-capacity home · May provide extensive amenities, services and programs.
Based on residents per day and 460 beds.
Source: CMS Provider Information, average daily residents
Latest inspection: Jan 08, 2026 · 5 citations, all corrected
Most cited category: Quality of Life & Care, 5 of 17 citations · 7 categories in total
Health citations are formal notices following inspections when they fail to comply with safety and care standards.
15 of 17 citations resulted from standard inspections; and 2 of 17 came from combined inspections (standard and complaint).
Includes all CMS health inspection records for this property, which could include management/ownership changes.
Data sourced from CMS Health Deficiencies reports. Citation severity codes range from A (least serious) to L (most serious). Immediate Jeopardy (J-L) citations indicate situations where the facility's noncompliance has placed residents at risk of death or serious harm.
Source: CMS Penalties Database · Data as of Aug 2026
No penalties in the past 3 years
No civil money penalties or payment denials on record since Aug 2023.
How residents at this home fare on health outcomes and preventive care, compared with the New York average.
11 long-stay measures: 9 better, 1 worse, 1 near NY average
3 short-stay measures: 3 better
People who live at the home · 11 measures
Rehab and recovery after a hospital stay · 3 measures
Arrows show whether a figure is above or below the average. Green is better for residents, red is worse, and yellow means within 5% of the average. The line on each bar marks the average.
Quality measures are calculated by CMS from Minimum Data Set (MDS) resident assessments and Medicare claims.
72% of new residents, usually for short-term rehab.
14% of new residents, often for short stays.
14% of new residents, often for long-term daily care.
Source: CMS Long-Term Care Facility Characteristics (Data as of Jun 2026)
Residents meet regularly to discuss policies, care quality, and activities
State-approved Nurse Aide Training and Competency Evaluation Program on-site
Part of a Continuing Care Retirement Community offering multiple care levels
Organized group of residents that meets regularly to discuss facility policies, quality of life, and activities.
Gurwin Jewish Nursing & Rehabilitation Center’s finances from its CMS cost report for the fiscal year ending December 2024, compared with 454 New York nursing homes that filed a recent report. Includes all financial data for this property, which could include management/ownership changes.
Is it financially stable?
Breaking even on care
2.9% operating margin
+6.0 pts vs prior year
Positive margin in 1 of the last 8 reported years. Net income $9.0M after other income.
Does it invest in staff?
Spends more on payroll than most New York homes
62.1% payroll share of revenue
NY average 56.1%Rank #106 / 452Payroll % of net patient revenue — State benchmarked This nursing home is ranked 106th out of 452 nursing homes we track in New York for payroll % of net patient revenue. Shows payroll as a percentage of net patient revenue versus the New York average, among facilities reporting a recent fiscal year. Below 25% may signal understaffing or heavy agency use — read with Staffing ratings. Communities with the same value for a metric share the same rank. Rankings compare like with like: every nursing home we track in New York that reports data for that category. Nursing homes without available data are excluded, so the pool size varies from metric to metric.
Payroll rose $4.3M while revenue rose $12.9M. Check hours per resident in the staffing section to confirm it reaches the floor.
FY 2024 scorecard
Each row shows the FY 2024 figure, the change since the prior report, the trend, and how it compares with New York homes.
Profitable on care
| Metric | FY 2024 | vs prior year | Trend 2017 → 2024Trend | NY median | Compared with NY homesRank in NY | In short |
|---|---|---|---|---|---|---|
| Net patient revenue What the home earns from resident care, after discounts and bad debt. | $92.2M | +$12.9M | Trend 20172024 | NY median $23.7M | Rank in NY Rank #10 / 454Net patient revenue — State benchmarked This nursing home is ranked 10th out of 454 nursing homes we track in New York for net patient revenue. Shows this facility's net patient revenue compared to the New York average, among facilities reporting a recent fiscal year. Higher revenue generally means more resources for staffing and capital — read alongside Payroll %. Communities with the same value for a metric share the same rank. Rankings compare like with like: every nursing home we track in New York that reports data for that category. Nursing homes without available data are excluded, so the pool size varies from metric to metric. Higher than 98% of homes | Top 2% in NY Higher net patient revenue than 98% of NY homes that filed a recent report. Revenue mostly follows how big a home is. |
| Operating expenses Everything it costs to run the home: staff, supplies, rent, admin. | $89.5M | +$7.8M | Trend 20172024 | NY median — | Rank in NY Not ranked | Within revenue Operating expenses are lower than net patient revenue, so resident care covers its costs. |
| Net patient income Revenue minus operating expenses. Negative means care loses money. | $2.7M | +$5.1M | Trend 20172024 | NY median — | Rank in NY Not ranked | Profit, growing Resident care made money this year, more than in the prior report. |
| Operating margin Net patient income as a share of revenue. The clearest health signal. | 2.9% | +6.0 pts | Trend 20172024 | NY median — | Rank in NY Not ranked | Thin margin A margin from 0% to 5% of revenue leaves little room for unexpected costs. |
| Other income Money not from resident care: investments, grants, services. | $6.3M | — | Trend — | NY median — | Rank in NY Not ranked | Adds to profit Income from outside resident care, on top of the profit from care. |
| Net income The bottom line after other income. | $9.0M | +$4.8M | Trend — | NY median — | Rank in NY Not ranked | Profit The bottom line is above zero after other income. |
Spends more of revenue on staff than most New York homes
| Metric | FY 2024 | vs prior year | Trend 2017 → 2024Trend | NY median | Compared with NY homesRank in NY | In short |
|---|---|---|---|---|---|---|
| Payroll costs Salaries and wage-related benefits, not counting contract labor. | $57.2M | +$4.3M | Trend 20172024 | NY median $12.4M | Rank in NY Rank #7 / 454Payroll costs — State benchmarked This nursing home is ranked 7th out of 454 nursing homes we track in New York for payroll costs. Shows total staff payroll — salaries plus wage-related benefits — benchmarked to the New York average, among facilities reporting a recent fiscal year. Higher payroll relative to peers often signals better staffing and less reliance on contract labor. Communities with the same value for a metric share the same rank. Rankings compare like with like: every nursing home we track in New York that reports data for that category. Nursing homes without available data are excluded, so the pool size varies from metric to metric. Higher than 99% of homes | Top 2% in NY by size Higher payroll than 99% of NY homes. Payroll in dollars mostly follows how big a home is, so this compares size, not staffing levels. |
| Payroll share of revenue Payroll divided by revenue. Higher usually means more staff per resident. | 62.1% | −4.7 pts | Trend 20172024 | NY median 52.6% | Rank in NY Rank #106 / 452Payroll % of net patient revenue — State benchmarked This nursing home is ranked 106th out of 452 nursing homes we track in New York for payroll % of net patient revenue. Shows payroll as a percentage of net patient revenue versus the New York average, among facilities reporting a recent fiscal year. Below 25% may signal understaffing or heavy agency use — read with Staffing ratings. Communities with the same value for a metric share the same rank. Rankings compare like with like: every nursing home we track in New York that reports data for that category. Nursing homes without available data are excluded, so the pool size varies from metric to metric. Higher than 77% of homes | 6.0 pts over NY average The NY average is 56.1% of revenue. Within 3 points of it reads as near the average. |
USD, millions
Net patient revenue Operating expenses Net patient income
% of net patient revenue
Payroll share Operating margin NY payroll average
| Metric | 2017 | 2018 | 2019 | 2020 | 2021 | 2022 | 2023 | 2024 |
|---|---|---|---|---|---|---|---|---|
| Net patient revenue | $81.6M | $84.0M | $86.1M | $71.0M | $66.6M | $69.8M | $79.2M | $92.2M |
| Operating expenses | $85.8M | $88.8M | $90.1M | $85.7M | $76.1M | $78.1M | $81.7M | $89.5M |
| Net patient income | −$4.1M | −$4.8M | −$4.0M | −$14.7M | −$9.4M | −$8.4M | −$2.4M | $2.7M |
| Operating margin | −5.0% | −5.8% | −4.7% | −20.8% | −14.2% | −12.0% | −3.1% | 2.9% |
| Net income | −$1.0M | −$1.2M | −$1.3M | −$4.4M | $1.3M | −$1.0M | $4.2M | $9.0M |
| Payroll costs | $56.7M | $59.0M | $60.1M | $57.2M | $48.4M | $51.5M | $52.9M | $57.2M |
| Payroll share of revenue | 69.5% | 70.2% | 69.8% | 80.6% | 72.7% | 73.8% | 66.8% | 62.1% |
| Beds | 460 | 460 | 460 | 460 | 460 | 460 | 460 | 460 |
| Gross revenue | $81.6M | $84.0M | $116.4M | $106.2M | $95.1M | $98.8M | $107.8M | $92.2M |
| Salaries | $43.8M | $45.6M | $46.5M | $42.6M | $36.8M | $40.2M | $42.6M | $46.4M |
| Wage-related costs | $12.9M | $13.4M | $13.6M | $14.6M | $11.6M | $11.3M | $10.4M | $10.9M |
| Contract labor | $0.4M | $0.5M | — | — | — | — | — | — |
| Other operating costs | $29.0M | $29.9M | $30.0M | $28.6M | $27.7M | $26.7M | $28.7M | $32.3M |
| Net patient revenue per day | $454 | $452 | $492 | $471 | $486 | $514 | $552 | $609 |
| Cost per day | $477 | $478 | $515 | $569 | $554 | $576 | $568 | $591 |
| Average length of stay | 115.7 days | 106.6 days | 109.5 days | 95.8 days | 89.5 days | 87.4 days | 93.8 days | 92.9 days |
Showing 2024–2022 · scroll sideways for 5 earlier years
Earlier and partial years are in the download. Download CSV
Most residents typically stay for a few weeks or months before returning home or moving on.
Most new residents arrive under Medicare (72% of admissions), and a typical Medicare stay runs around 1 - 2 months.
Coverage residents most often arrive under.
Coverage residents most often leave under.
68 Hauppauge Rd, Commack, NY 11725
Add your location
Gurwin Jewish Nursing & Rehabilitation Center is located in Commack, New York State.
Here are the financial assistance programs available to residents in New York State.
Gurwin Jewish Nursing & Rehabilitation Center has a walk score of 88. Very walkable. Most errands can be accomplished on foot, and many essentials are within a short walk.
Gurwin Jewish Nursing & Rehabilitation Center's occupancy is 93.4%.
No, Gurwin Jewish Nursing & Rehabilitation Center has a no-pet policy.
The team at Gurwin Jewish Nursing & Rehabilitation Center can be reached at giving@gurwin.org.
Gurwin Jewish Nursing & Rehabilitation Center is registered as a non-profit.
Gurwin Jewish Nursing & Rehabilitation Center received a 5-star overall rating from the CMS (Centers for Medicare and Medicaid Services). This score combines results from staffing levels, quality measures, and health inspections.
Gurwin Jewish Nursing & Rehabilitation Center has 460 beds.
Care Cost Calculator: See Prices in Your Area
Nursing Home Data Explorer
Don’t Wait Too Long: 7 Red Flag Signs Your Parent Needs Assisted Living Now
The True Cost of Assisted Living in 2025 – And How Families Are Paying For It
Understanding Senior Living Costs: Pricing Models, Discounts & Financial Assistance