Washington Center for Rehabilitation and Healthcare
Nursing Home & Memory Care · Argyle, NY
CMS overall rating Info CMS (the Centers for Medicare & Medicaid Services) is the federal agency that rates nursing home quality. Its Overall Rating runs from 1 to 5 stars, combining health inspections, staffing, and quality measures, with inspections weighted most heavily.

Washington Center for Rehabilitation and Healthcare

Nursing Home & Memory Care · Argyle, NY
CMS overall rating Info CMS (the Centers for Medicare & Medicaid Services) is the federal agency that rates nursing home quality. Its Overall Rating runs from 1 to 5 stars, combining health inspections, staffing, and quality measures, with inspections weighted most heavily.
Calculator: See prices in your area
Washington Center for Rehabilitation and Healthcare accepts Medicare, Medicaid, and private pay.

Overview of Washington Center for Rehabilitation and Healthcare

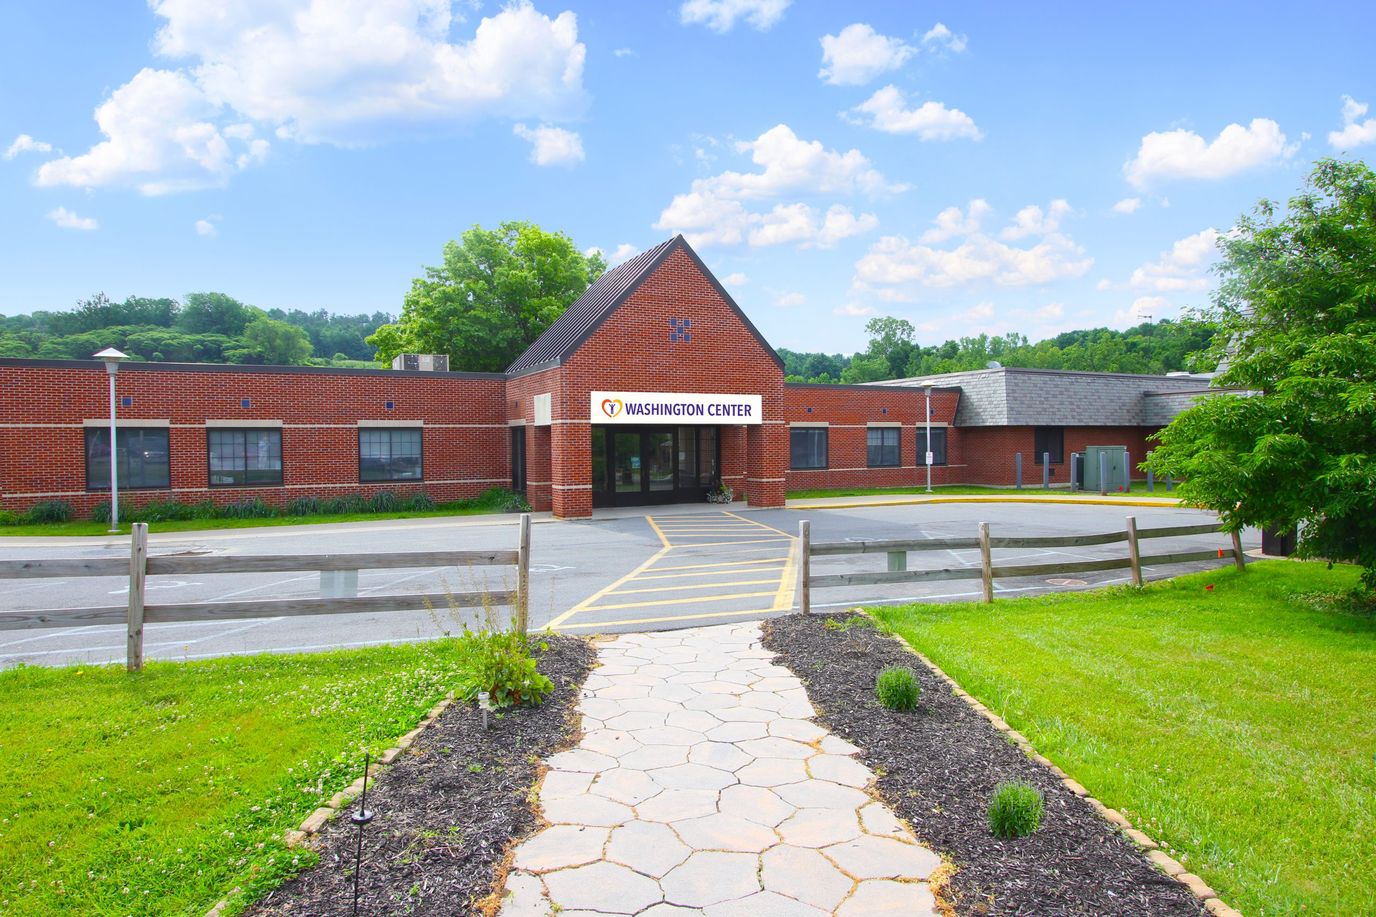
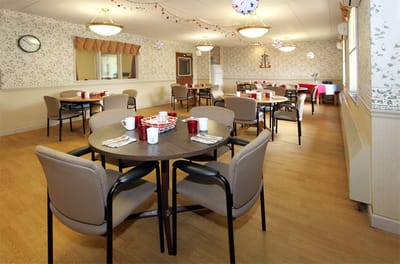
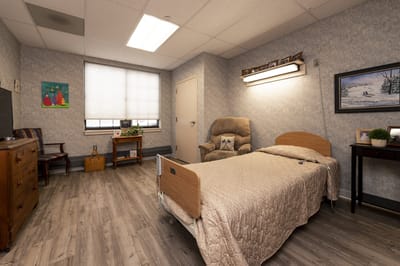
Operating in Argyle, Washington County, New York, Washington Center for Rehabilitation and Healthcare maintains 122 licensed beds under private ownership by Washington Operations Associates. The facility staffs nursing care at 3 hours 16 minutes per resident daily and maintains 24-hour coverage. Rehabilitation services, respite care, and memory care programming form the clinical core. The facility earned recognition with a CMS Five Star Rating.

The inspection trajectory reveals consistent compliance above the state benchmark. Five years of regulatory activity produced 18 documented deficiencies; a rate of 3.6 annually, placing the facility 29 percent better than New York’s 5.1-per-year baseline.

Complaint investigations, the dominant inspection type, were not substantiated.

The September 2025 investigation identified 12 deficiencies across garbage and refuse handling, abuse and neglect protocols, pharmacy operations, resident autonomy, respiratory care procedures, electrical equipment integrity, emergency contact procedures, fire alarm maintenance, egress lighting, comprehensive hazard assessment, sprinkler testing and maintenance, and utility systems; a broad operational scope consistent with standard compliance auditing.

Earlier inspections from 2021 through 2024 documented isolated, corrected violations: a severe CPR gap in 2023 (systemic but resolved), abuse prevention protocols in 2024, PASARR mental-health screening in 2022, staff COVID-19 immunization requirements in 2022, and care-plan development in 2021.

All deficiencies were corrected within weeks to months. No federal enforcement, fines, or ongoing immediate jeopardy appears in the public record.

The facility faces four lawsuits filed since 2020; two remain active, one was stayed pending regulatory developments, and one industry-related proceeding settled in 2025.

Programs include Health Services, Health Programs, RehabStrong™, and coordinated nutrition planning.

The facility’s rehabilitation and respite capacity suit residents and families seeking post-acute care in a setting with above-average regulatory performance.

Quality ratings

Measured by Centers for Medicare & Medicaid Services (CMS)

Overall rating Info The Overall CMS Rating combines results from health inspections, staffing levels and quality measures. Health inspections carry the most weight. Staffing and quality scores can increase or decrease the final rating based on performance compared to state and national standards.
▼ 2.4% Below NY avg. ▼ 2.4% Below NY avg.NY average: 3.1Click the badge to see the full State ranking.Click here to see the full State ranking.
Health Inspection Info Based on the results of the facility's three most recent standard inspections and any complaint investigations. CMS reviews the number, scope, and severity of deficiencies, with more recent findings weighted more heavily.
▼ 29.3% Below NY avg. ▼ 29.3% Below NY avg.NY average: 2.8Click the badge to see the full State ranking.Click here to see the full State ranking.
Staffing Info Measures average nursing staff hours per resident per day, including Registered Nurses (RNs) and total nursing staff. Ratings are adjusted based on the level of care residents require and are compared to state and national benchmarks.
▼ 26.4% Below NY avg. ▼ 26.4% Below NY avg.NY average: 2.7Click the badge to see the full State ranking.Click here to see the full State ranking.
Quality Measures Info Based on clinical and physical health indicators reported to CMS, such as hospital readmissions, falls, pressure ulcers, and improvements in mobility. These measures reflect how well residents' health needs are being managed.
▲ 30.9% Above NY avg. ▲ 30.9% Above NY avg.NY average: 3.8Click the badge to see the full State ranking.Click here to see the full State ranking.

Staffing hours breakdown

Info Daily nursing hours per resident by staff type, reported to CMS. Higher is generally better — compare this facility to state and national averages to see where staffing stands.

Hours per resident per day — compared to New York state averages

Total nursing care / resident Info This home is ranked 193rd out of 407 homes in New York for nurse hours. Total adjusted nursing hours per resident per day, combining RN, LPN, and aide time. CMS adjusts this for case-mix so facilities can be fairly compared.
3h 16m per day
Rank #193 / 407Nurse hours — State benchmarkedThis home is ranked 193rd out of 407 homes in New York. Shows adjusted nurse hours per resident per day benchmarked to the New York average, with a ranking across 407 New York facilities. More hours mean more direct care. The national average is about 3.5 hrs; below 3.0 is a red flag.Rankings are based only on facilities in New York that report data for that category. Facilities without available data are excluded from the ranking.Click the rank badge to see the full State ranking.Click here to see the full State ranking.
This facility New York avg (3h 35m per day)
vs New York avg
-9%

4 of 6 metrics below state avg

Standout metric LPN / LVN is +32% above state avg
Staff typeHours / Day / Residentvs state avg
Registered Nurse (RN) Info RNs hold the highest nursing license and can assess residents, interpret test results, and direct care plans. More RN hours per day often signals stronger clinical oversight and faster response to health changes. 28m per day ▼ 32% State avg: 42m per day · National avg: 41m per day
LPN / LVN Info Licensed Practical Nurses (LPNs) or Licensed Vocational Nurses (LVNs) deliver routine hands-on care — medication administration, wound dressing, and monitoring vital signs. They work under RN supervision and make up a large share of daily bedside care. 1h 1m per day ▲ 32% State avg: 46m per day · National avg: 52m per day
Nurse Aide Info Certified Nurse Aides (CNAs) provide the most direct day-to-day assistance: bathing, dressing, feeding, and mobility. Nurse aide hours are typically the largest staffing category and directly affect residents' quality of life. 2h 2m per day ▼ 6% State avg: 2h 11m per day · National avg: 2h 20m per day
Weekend Total Nursing Info Combined nursing hours (RN + LPN + Nurse Aide) per resident per day on weekends. Staffing often drops on weekends — this figure reveals whether the facility maintains adequate coverage outside of weekday hours. 3h 7m per day ■ Avg State avg: 3h 10m per day · National avg: 3h 26m per day
Physical Therapist Info Hours per resident per day provided by licensed Physical Therapists (PTs) or PT Assistants. PT services help residents recover mobility after injury or illness and are especially important for post-acute (short-stay) rehabilitation. 5m per day ▼ 24% State avg: 7m per day · National avg: 4m per day
Weekend RN Info Registered nurse hours specifically on weekends. Facilities sometimes reduce RN presence on Saturdays and Sundays — a low weekend RN figure compared to weekday hours can indicate reduced clinical oversight when most administrative staff are absent. 20m per day ▼ 30% State avg: 28m per day · National avg: 28m per day

Capacity and availability

This home is often near full

Higher occupancy than the New York average: 88.3%
Occupancy rate
96.5% Rank #74 / 436Occupancy rate — State benchmarkedThis home is ranked 74th out of 436 homes in New York. Shows this facility's occupancy rate versus the New York average, with its Statewide rank out of 436. Higher occupancy signals strong local demand and financial stability.Rankings are based only on facilities in New York that report data for that category. Facilities without available data are excluded from the ranking.Click the rank badge to see the full State ranking.Click here to see the full State ranking.
Avg. Length of Stay
192 days
Bed community size
122-bed community Rank #404 / 748Bed count — State benchmarkedThis home is ranked 404th out of 748 homes in New York. Shows this facility's certified or reported bed count compared to other New York facilities. Larger communities may offer more amenities, programs, and on-site services for residents and families.Rankings are based only on facilities in New York that report data for that category. Facilities without available data are excluded from the ranking.Click the rank badge to see the full State ranking.Click here to see the full State ranking.
A larger shared setting that may offer more common spaces and organized community services.
Walk Score
Walk Score: 25 / 100 Rank #996 / 1173Walk Score — State benchmarkedThis home is ranked 996th out of 1173 homes in New York. Shows how walkable this facility's neighborhood is compared to the average Walk Score across New York facilities. Higher scores benefit residents, families, and staff.Rankings are based only on facilities in New York that report data for that category. Facilities without available data are excluded from the ranking.Click the rank badge to see the full State ranking.Click here to see the full State ranking.
Somewhat walkable. A few nearby services may be reachable on foot, but most trips require transportation.

About this community

Awards

CMS Five Star Rating

License Details

Facility TypeNursing Home
StatusActive
CountyWashington
License Number5750301N

Ownership & Operating Entity

Washington Center for Rehabilitation and Healthcare is legally operated by Washington Operations Associates, LLC (For Profit).

Owner NameWashington Operations Associates, LLC (For Profit)

Therapy & Rehabilitation

2 services
Rehabilitation Services
Short-Term Rehab

Staffing & Medical

2 services
Doctor on Staff
24-Hour Staffing

Additional Policies & Features

Pets Allowed
Admission CriteriaAdmissions team works with physicians and hospital case managers to determine skilled nursing needs.

Amenities & Lifestyle

Specific ProgramsHealth Programs, RehabStrong™, Nutrition Program
Operating Hours24/7

Contact Washington Center for Rehabilitation and Healthcare

Inspection History

In New York State, the Department of Health, Office of Aging and Long Term Care performs unannounced onsite inspections to monitor compliance with state and federal healthcare regulations.

Inspection Score Info A composite 0–100 score combining this facility's inspections, citations, complaints, and enforcement actions relative to the New York State state average. The score below shows how many points this facility sits above or below the typical New York State nursing home score (the benchmark); higher is better.

8 points below the New York State average for nursing homes (83/100)

Rank #436 / 593 in New York State Inspection Score — State benchmarked This home is ranked 436th out of 593 homes in New York State. Shows this facility's inspection score compared to the New York State average among 593 comparable communities in the ranking pool. Rankings are based only on facilities in New York State that report data for that category. Facilities without available data are excluded from the ranking. Inspection score: 75 out of 100. Letter grade C. 8 points below the New York State average for nursing homes (83/100)

Enforcement Actions Info Enforcement actions are formal penalties or interventions imposed by New York State regulators when a nursing home fails to meet state or federal care, safety, or regulatory standards. They may include directed plans of correction, civil monetary penalties, denial of payment, or appointment of temporary management.

Since 2015
5 enforcement actions

This facility has 5 enforcement actions. 33% of New York State nursing homes have zero, and the statewide average is 1.6.

  • September 12, 2025 Quality of Care #NH-26-006
  • May 23, 2023 Resident Rights #NH-24-015
  • February 10, 2021 Quality of Care #NH-21-148
  • January 3, 2017 Multiple Deficiencies #NH-17-003
  • September 11, 2015 Multiple Deficiencies #NH-16-134

Inspection Scorecard Info This scorecard compares key inspection, citation, and complaint metrics at this facility against the New York State state average. Metrics rated ≥15% worse than average are highlighted in red; those ≥15% better are highlighted in green.

Since 2020 vs. New York State state average
Overall vs. NY average 6 Worse Metrics worse than New York State average:
• Total citations (54% above)
• Citations per year (50% above)
• Citations per inspection (7% above)
• Total inspections (44% above)
• Inspections with citations (25% above)
• Complaints per bed (1900% above)
6 Better Metrics better than New York State average:
• Health citations (15% below)
• Life safety citations (25% below)
• Inspection citation rate (14% below)
• Total complaints (30% below)
• Complaints per year (30% below)
• Complaint investigations (7% below)
Latest Inspection September 12, 2025 Complaint Investigation

Citations Info Citations are formal regulatory issues recorded during state inspections.

This FacilityNY Averagevs. NY Avg
Total citations Info Formal regulatory issues recorded by inspectors across all inspection types. 2013 This facility has 54% more total citations than a typical New York State nursing home (20 vs. NY avg 13).↑ 54% worse
Health citations Info Citations related to resident care, clinical practices, and day-to-day operations. 1720 This facility has 15% fewer health citations than a typical New York State nursing home (17 vs. NY avg 20).↓ 15% better
Life safety citations Info Citations related to building safety — fire prevention, emergency egress, and similar. 34 This facility has 25% fewer life safety citations than a typical New York State nursing home (3 vs. NY avg 4).↓ 25% better
Citations per year Info Average citations per year since 2020. 3.32.2 This facility has 50% more citations per year than a typical New York State nursing home (3.3 vs. NY avg 2.2).↑ 50% worse
Citations per inspection Info Average citations per inspection. 1.51.4 This facility has 7% more citations per inspection than a typical New York State nursing home (1.5 vs. NY avg 1.4).↑ 7% worse

Inspections Info State inspections evaluate whether the facility meets health and safety standards.

This FacilityNY Averagevs. NY Avg
Total inspections Info Combined count of all routine and focused inspections. Excludes complaint investigations. 139 This facility has 44% more total inspections than a typical New York State nursing home (13 vs. NY avg 9).↑ 44% worse
Inspections with citations Info Inspections that resulted in at least one regulatory citation. 54 This facility has 25% more inspections with citations than a typical New York State nursing home (5 vs. NY avg 4).↑ 25% worse
Inspection citation rate Info Percentage of inspections that resulted in at least one citation. 38%44% This facility has 6 percentage points lower inspection citation rate than a typical New York State nursing home (38% vs. NY avg 44%).↓ 6% better

Complaints & Investigations Info Complaints are formal concerns filed by residents, families, or staff. Investigations are on-site follow-ups.

This FacilityNY Averagevs. NY Avg
Total complaints Info Formal expressions of concern made by residents, families, or staff. 5579 This facility has 30% fewer total complaints than a typical New York State nursing home (55 vs. NY avg 79).↓ 30% better
Complaints per year Info Average complaints per year since 2020. 9.213.2 This facility has 30% fewer complaints per year than a typical New York State nursing home (9.2 vs. NY avg 13.2).↓ 30% better
Complaints per bed Info Size-adjusted complaint rate based on occupied beds. 10.000.50 This facility has 1900% more complaints per bed than a typical New York State nursing home (10 vs. NY avg 0.5).↑ 1900% worse
Complaint investigations Info On-site investigations triggered by complaints filed with New York State regulators. 1415 This facility has 7% fewer complaint investigations than a typical New York State nursing home (14 vs. NY avg 15).↓ 7% better

Inspection Reports Summary Info An editor-reviewed summary of the themes and findings across this facility's recent inspection reports.

  • September 12, 2025 inspection found 12 deficiencies including abuse and neglect, pharmacy services, respiratory care, and multiple life safety code violations.
  • March 26, 2024 inspection cited one abuse and neglect deficiency with no actual harm, which was corrected on site.
  • May 23, 2023 inspection cited immediate jeopardy for CPR deficiencies as a severe systemic issue, later corrected.

Health Inspection History

Inspections since 2020
Total health inspections 4

New York State average 3.6


Last Health inspection on Sep 2025

Total health citations
13 Rank #129 / 414Health citations — State benchmarkedThis home is ranked 129th out of 414 homes in New York. Shows this facility's total health deficiency citations benchmarked to the New York State average, with a ranking across all 414 NY facilities. Lower citation counts earn a better rank.Rankings are based only on facilities in New York that report data for that category. Facilities without available data are excluded from the ranking.Click the rank badge to see the full State ranking.Click here to see the full State ranking.

New York State average 18.5

Citations per inspection
3.25 Rank #86 / 414Citations per inspection — State benchmarkedThis home is ranked 86th out of 414 homes in New York. Shows average deficiency citations per CMS inspection for this facility versus the New York mean across 414 facilities with citation data. Lower is better.Rankings are based only on facilities in New York that report data for that category. Facilities without available data are excluded from the ranking.Click the rank badge to see the full State ranking.Click here to see the full State ranking.

New York State average 5.05


Health citations are formal notices following inspections when they fail to comply with safety and care standards.

10 of 13 citations resulted from standard inspections; 2 of 13 resulted from complaint investigations; and 1 of 13 came from combined inspections (standard and complaint).

Breakdown of citation severity (last 6 years)
Critical health citations
1
400% worse than New York State average

New York State average: 0.2


Serious health citations
1
400% worse than New York State average

New York State average: 0.2

1 critical citation New York State average: 0.2

1 serious citation New York State average: 0.2

11 moderate citations New York State average: 17.4

0 minor citations New York State average: 0.7
Citations history (last 6 years)
Abuse/Neglect serious citation Sep 12, 2025
Corrected

Nutrition moderate citation Sep 12, 2025
Corrected

Quality of Care moderate citation Sep 12, 2025
Corrected

Resident Rights moderate citation Sep 12, 2025
Corrected

Infection Prevention & Vaccination

How this facility protects residents through staff vaccination policies and immunization practices.

Employee Flu Vaccination Rate: 85%

Percentage of facility employees vaccinated against influenza.

Lawsuit overview for Washington Center for Rehabilitation and Healthcare

Summary of court-record activity tied to this facility, compiled from publicly available case dockets.

Source: State court e-filing records

Total Cases Info Every lawsuit on record involving this facility since the earliest filing. Long-term volume signals overall legal exposure. 4
Active Cases Info Lawsuits still moving through the courts. Active claims can affect day-to-day operations, settlement risk, and insurance posture. 2
Closed Info Cases that have been disposed of — dismissed, settled, or decided. Shows how the facility has historically resolved disputes. 1
Since Info Year of the earliest case on record. A long history with steady filings suggests persistent issues; a recent first filing means newer exposure. 2020
Most Recent Info Most recent filing on record. Recent activity means legal disputes are still being raised against this facility. 2026
Next Court Date Info Next scheduled court appearance on record across active cases. May 01, 2026

Staffing Data

Reporting period: October 1 – December 31, 2025 (Q4 2025). Source: CMS Payroll-Based Journal report.

Total staff 129
Employees 111
Contractors 18
Staff to resident ratio 1.09 : 1
524% more staff per resident than New York average
New York average ratio: 0.18 : 1 New York average ratio: 0.18 : 1See full New York ranking
Avg staff/day 55
Average shift 8.6 hours
12% better than New York average
New York average: 7.7 hours New York average shift: 7.7 hoursSee full New York ranking
Total staff hours (quarter) 43,734

Nursing staff breakdown

Q4 2025 · Oct 1 – Dec 31 More info This data comes from the CMS Payroll-Based Journal report covering October 1 – December 31, 2025.
Registered Nurse

Manages medical care and health needs.

RN Staff Info All 10 RN Staff are full-time employees. No contractors work on this role. 10
Average shift length Info Average shift length. Calculated as total hours divided by days worked and average staff per day. 7.6 hours
Licensed Practical Nurse

Assists with medical care and medications.

LPN Staff Info All 31 LPN Staff are full-time employees. No contractors work on this role. 31
Average shift length Info Average shift length. Calculated as total hours divided by days worked and average staff per day. 8.1 hours
Certified Nursing Assistant

Helps with daily care and mobility.

CNA Staff Info 44 total: 41 full-time employees and 3 contractors. 44
Average shift length Info Average shift length. Calculated as total hours divided by days worked and average staff per day. 10.3 hours

Contractor staffing

Q4 2025 · Oct 1 – Dec 31 More info This data comes from the CMS Payroll-Based Journal report covering October 1 – December 31, 2025.

Total hours from contractors

7.4%

3,226 contractor hours this quarter

Respiratory Therapy Technician: 6 Certified Nursing Assistant: 3 Physical Therapy Aide: 3 Physical Therapy Assistant: 2 Speech Language Pathologist: 2 Qualified Social Worker: 1 Qualified Activities Professional: 1

Staff by category

Q4 2025 · Oct 1 – Dec 31 More info This data comes from the CMS Payroll-Based Journal report covering October 1 – December 31, 2025.
Certified Nursing Assistant4134422,04892100%10.3
Licensed Practical Nurse3103110,92892100%8.1
Clinical Nurse Specialist140142,79592100%7.4
Registered Nurse100101,8619199%7.6
Respiratory Therapy Technician0669566672%6.7
Occupational Therapy Aide3039176571%7.5
Physical Therapy Aide0337196773%5.8
Nurse Practitioner1014766470%7.4
Other Social Services Staff1014506065%7.5
Mental Health Service Worker1014435964%7.5
Dental Services Staff1014205661%7.5
Administrator1014135257%7.9
Speech Language Pathologist0223415459%5.9
Physical Therapy Assistant0223346773%4.9
Qualified Social Worker0112635054%5.3
Other Dietary Services Staff3032184043%5.2
Medical Director202921516%6.1
Nurse Aide in Training202361415%2.6
Qualified Activities Professional01126910%2.9
44 Certified Nursing Assistant
% of Days 100%
31 Licensed Practical Nurse
% of Days 100%
14 Clinical Nurse Specialist
% of Days 100%
10 Registered Nurse
% of Days 99%
6 Respiratory Therapy Technician
% of Days 72%
3 Occupational Therapy Aide
% of Days 71%
3 Physical Therapy Aide
% of Days 73%
1 Nurse Practitioner
% of Days 70%
1 Other Social Services Staff
% of Days 65%
1 Mental Health Service Worker
% of Days 64%
1 Dental Services Staff
% of Days 61%
1 Administrator
% of Days 57%
2 Speech Language Pathologist
% of Days 59%
2 Physical Therapy Assistant
% of Days 73%
1 Qualified Social Worker
% of Days 54%
3 Other Dietary Services Staff
% of Days 43%
2 Medical Director
% of Days 16%
2 Nurse Aide in Training
% of Days 15%
1 Qualified Activities Professional
% of Days 10%

Penalties and fines

Includes penalties issued in 2025

Federal penalties imposed by CMS for regulatory violations, including civil money penalties (fines) and denials of payment for new Medicare/Medicaid admissions.

Source: CMS Penalties Database (Data as of Jan 2026)

Total fines amount $29K Rank #348 / 415Federal fines — State benchmarkedThis home is ranked 348th out of 415 homes in New York. Shows this facility's cumulative CMS federal fine dollars versus the New York average among facilities with fines, and where it ranks among 415 facilities in the pool. Lower total dollars mean a better rank.Rankings are based only on facilities in New York that report data for that category. Facilities without available data are excluded from the ranking.Click the rank badge to see the full State ranking.Click here to see the full State ranking.
56% lower than New York State average

New York State average: $66K

Number of fines 2
In line with New York State average

New York State average: 2.0

Payment Denials Info Serious action where Medicare and/or Medicaid temporarily stops payments for new residents until issues are fixed. 0
100% fewer payment denials than New York State average

New York State average: 0.1

Fines amount comparison
This facility $29K
New York State average $66K
Penalty History

Penalties are imposed by CMS for violations of federal nursing home regulations.

1 penalty in the past 3 years

Sep 12, 2025 · $15K

Civil Money Penalty Info Fines imposed for noncompliance, which can be assessed per day or per instance of violation. Sep 12, 2025
$15K

Last updated: Jan 2026

Quality of care over time

These measures show how residents usually do over time at this home, based on health outcomes and preventive care.

High-risk clinical events score Info A composite score based on pressure ulcers, falls with injury, weight loss, walking ability decline, and activities of daily living decline. 8.2
17% better than New York State average

New York State average: 9.8

Functional decline score Info A composite score based on activities of daily living decline, walking ability decline, and incontinence. 18.2
In line with New York State average

New York State average: 18.1

Long-stay resident measures
Significantly above average Info CMS star rating based on long-stay quality measure performance. 5 stars = significantly above average, 1 star = significantly below average.
Need for Help with Daily Activities Increased Info Percent of long-stay residents whose need for help with daily activities has increased 12.9%
21% better than New York State average

New York State average: 16.4%

Walking Ability Worsened Info Percent of long-stay residents whose ability to move independently worsened 13.9%
16% better than New York State average

New York State average: 16.6%

Low Risk Residents with Bowel/Bladder Incontinence Info Percent of low risk long-stay residents who lose control of their bowels or bladder 27.7%
30% worse than New York State average

New York State average: 21.4%

Falls with Major Injury Info Percent of long-stay residents experiencing one or more falls with major injury 5.8%
96% worse than New York State average

New York State average: 3.0%

High Risk Residents with Pressure Ulcers Info Percent of long-stay high risk residents with pressure ulcers 2.7%
63% better than New York State average

New York State average: 7.2%

Urinary Tract Infection Info Percent of long-stay residents with a urinary tract infection 1.2%
16% better than New York State average

New York State average: 1.4%

Lost Too Much Weight Info Percent of long-stay residents who lose too much weight 5.5%
10% better than New York State average

New York State average: 6.1%

Depressive Symptoms Info Percent of long-stay residents who have depressive symptoms 19.9%
10% worse than New York State average

New York State average: 18.1%

Antipsychotic Use Info Percent of long-stay residents who received an antipsychotic medication 3.6%
71% better than New York State average

New York State average: 12.6%

Pneumococcal Vaccine Info Percent of long-stay residents assessed and appropriately given the pneumococcal vaccine 100.0%
9% better than New York State average

New York State average: 91.4%

Influenza Vaccine Info Percent of long-stay residents assessed and appropriately given the seasonal influenza vaccine 100.0%
5% better than New York State average

New York State average: 95.2%

Short-stay resident measures
Significantly above average Info CMS star rating based on short-stay quality measure performance. 5 stars = much above average, 1 star = much below average.
Pneumococcal Vaccine Info Percent of short-stay residents assessed and appropriately given the pneumococcal vaccine 95.2%
24% better than New York State average

New York State average: 76.6%

Antipsychotic medication increase Info Percent of short-stay residents who newly received an antipsychotic medication 1.0%
22% better than New York State average

New York State average: 1.3%

Influenza Vaccine Info Percent of short-stay residents assessed and appropriately given the seasonal influenza vaccine 96.8%
23% better than New York State average

New York State average: 78.8%

Re-hospitalized after SNF stay Info Percentage of short-stay residents who were re-hospitalized after their nursing home admission. 20.9%
In line with New York State average

New York State average: 20.6%

Emergency department visits Info Percentage of short-stay residents who had an outpatient emergency department visit. 6.8%
30% better than New York State average

New York State average: 9.7%

Falls with major injury Info Percentage of SNF residents who experience falls with major injury during their stay. 2.3%
195% worse than New York State average

New York State average: 0.8%

Ability to care for self at discharge Info Percentage of residents at or above expected ability to care for themselves at discharge. 45.2%
16% worse than New York State average

New York State average: 53.7%

Successful return to home or community Info Rate of successful return to home or community from a skilled nursing facility. 42.9%
15% worse than New York State average

New York State average: 50.6%

Breakdown by payment type

Medicare

24% of new residents, usually for short-term rehab.

Typical stay 1 - 2 months

Private pay

58% of new residents, often for short stays.

Typical stay 1 - 2 months

Medicaid

17% of new residents, often for long-term daily care.

Typical stay 2 - 3 years

Facility Characteristics

Source: CMS Long-Term Care Facility Characteristics (Data as of Jan 2026)

Total residents 118
Medicare
10
8.5% of residents
Medicaid
98
83.1% of residents
Private pay or other
10
8.5% of residents
Programs & Services
Residents Group

Residents meet regularly to discuss policies, care quality, and activities

Active Resident Council

Organized group of residents that meets regularly to discuss facility policies, quality of life, and activities.

Finances and operations

Based on CMS SNF Cost Report for fiscal year ending in 12/2023.

For-profit
Corporation
Net patient revenue Info Net patient revenue — what the home actually collects for resident care, after contractual allowances, bad debt and discounts are subtracted from its gross charges (CMS cost report, Worksheet G-3). It covers resident care only; money the home earns from other sources is shown separately as "Other income."
$14.3M
Net patient income Info Net patient income: net patient revenue minus the home's total operating expenses. A positive figure means it earns more from resident care than it spends to deliver it; a negative figure means the opposite. It excludes non-operating "other income."
-$644.2K
For-profit Corporation
Net patient revenue Info Net patient revenue — what the home actually collects for resident care, after contractual allowances, bad debt and discounts are subtracted from its gross charges (CMS cost report, Worksheet G-3). It covers resident care only; money the home earns from other sources is shown separately as "Other income."
$14.3M Rank #335 / 403Revenue — State benchmarkedThis home is ranked 335th out of 403 homes in New York. Shows this facility's annual revenue compared to the New York average. Higher revenue generally means more resources for staffing and capital — read alongside Payroll %.Rankings are based only on facilities in New York that report data for that category. Facilities without available data are excluded from the ranking.Click the rank badge to see the full State ranking.Click here to see the full State ranking.
Net patient income Info Net patient income: net patient revenue minus the home's total operating expenses. A positive figure means it earns more from resident care than it spends to deliver it; a negative figure means the opposite. It excludes non-operating "other income."
-$644.2K
Other income Info Money the home earns outside of resident care — such as investments, grants, rentals and other non-operating sources (CMS cost report, Worksheet G-3). It is tracked separately from net patient revenue: it is not part of that figure, and it is not included in net patient income.
$243.1K
Payroll costs Info Staff salaries plus wage-related costs — benefits such as payroll taxes, health insurance and retirement — from the home's own accounting records (CMS cost report, Worksheet A). Contract or agency labor is counted separately, under other operating costs. Rank #319 / 403Payroll — State benchmarkedThis home is ranked 319th out of 403 homes in New York. Shows total annual staff payroll benchmarked to the New York average. Higher payroll investment relative to peers often signals better staffing and less reliance on cheaper contract labor.Rankings are based only on facilities in New York that report data for that category. Facilities without available data are excluded from the ranking.Click the rank badge to see the full State ranking.Click here to see the full State ranking.
$5.7M 39.7% of net patient revenue Info Payroll as a share of revenue: staff salaries and wage-related benefits divided by net patient revenue. A higher figure means more of each revenue dollar goes to staff pay. Rank #136 / 403Payroll % — State benchmarkedThis home is ranked 136th out of 403 homes in New York. Shows payroll as a percentage of revenue versus the New York average. Well-run New York facilities typically land around 53–65% — the top third Statewide. Below 25% may signal understaffing or heavy agency use — read with Staffing ratings.Rankings are based only on facilities in New York that report data for that category. Facilities without available data are excluded from the ranking.Click the rank badge to see the full State ranking.Click here to see the full State ranking.
Other operating costs Info Everything it costs to run the home apart from payroll — food, utilities, supplies, maintenance, contract labor and administration. Calculated as total operating expense minus payroll (staff salaries and wage-related benefits).
$9.2M
Total costs Info The home's total operating expense for the year — all the costs of running it, salaries included (CMS cost report, Worksheet G-3).
$14.9M

Who this home usually serves

TYPE OF STAY

Mix of rehab and long-term care

This home supports both short-term rehab and long-term care, with residents staying for a wide range of durations.

Most new residents arrive under private pay (58% of admissions), and a typical private pay stay runs around 1 - 2 months.

Admissions
218 total

Coverage residents most often arrive under.

Medicare 24%
Private pay 58%
Medicaid 17%
Discharges
224 total

Coverage residents most often leave under.

Medicare 18%
Private pay 38%
Medicaid 44%

Places of interest near Washington Center for Rehabilitation and Healthcare

Address 0.0 miles from city center Info Estimated distance in miles from Argyle's city center to Washington Center for Rehabilitation and Healthcare's address, calculated via Google Maps.

Calculate Travel Distance to Washington Center for Rehabilitation and Healthcare

Add your location

Address

Compare Nursing Homes around New York State

The information below is reported by the New York State Department of Health.

5 facilities compared · CMS & NY Dept. of Health data

Edna Tina Wilson Living Center
NH
HC
MC
Rochester (Island Cottage Road)
120
Facility 120
NY AVG 160
Rank #412 / 748
98.3%
Facility 98.3%
NY AVG 88.3%
Rank #17 / 436
+11%
4.83
Facility 4.83
NY AVG 3.58
Rank #21 / 407
-56%+35%
$0
Facility $0
NY AVG $67.6k
Rank #1 / 415
86
Facility 86
NY AVG 83
Rank #242 / 593
5
Facility 5
NY AVG 18.5
Rank #15 / 414
1.7
Facility 1.7
NY AVG 5.1
Rank #10 / 414
-118-
2
Facility 2
NY AVG 63
Rank #1144 / 1173
Sandra Loan
$12.9M
Facility $12.9M
NY AVG $32.0M
Rank #312 / 403
$11.1M
Facility $11.1M
NY AVG $10.7M
Rank #255 / 403
85.5%
Facility 85.5%
NY AVG 37%
Rank #44 / 403
335769
Amsterdam Nursing Home
NH
New York City (Manhattan)
409
Facility 409
NY AVG 160
Rank #23 / 748
98.0%
Facility 98.0%
NY AVG 88.3%
Rank #107 / 436
+11%
3.25
Facility 3.25
NY AVG 3.58
Rank #212 / 407
+5%-9%
$0
Facility $0
NY AVG $67.6k
Rank #1 / 415
78
Facility 78
NY AVG 83
Rank #382 / 593
14
Facility 14
NY AVG 18.5
Rank #153 / 414
7.0
Facility 7.0
NY AVG 5.1
Rank #339 / 414
-402A+
93
Facility 93
NY AVG 63
Rank #192 / 1173
Judith Fenster
$81.1M
Facility $81.1M
NY AVG $32.0M
Rank #19 / 403
$30.1M
Facility $30.1M
NY AVG $10.7M
Rank #25 / 403
37.1%
Facility 37.1%
NY AVG 37%
Rank #245 / 403
335570
Massapequa Center Rehabilitation & Nursing
NH
ADC
PC
Amityville (Louden Avenue)
320
Facility 320
NY AVG 160
Rank #45 / 748
89.1%
Facility 89.1%
NY AVG 88.3%
Rank #242 / 436
+1%
3.01
Facility 3.01
NY AVG 3.58
Rank #271 / 407
-14%-16%
$0
Facility $0
NY AVG $67.6k
Rank #1 / 415
75
Facility 75
NY AVG 83
Rank #436 / 593
11
Facility 11
NY AVG 18.5
Rank #94 / 414
5.5
Facility 5.5
NY AVG 5.1
Rank #266 / 414
-290-
62
Facility 62
NY AVG 63
Rank #680 / 1173
Aharon Bleier
$58.5M
Facility $58.5M
NY AVG $32.0M
Rank #34 / 403
$28.0M
Facility $28.0M
NY AVG $10.7M
Rank #42 / 403
47.8%
Facility 47.8%
NY AVG 37%
Rank #248 / 403
335213
Washington Center for Rehabilitation and Healthcare
NH
MC
Argyle
122
Facility 122
NY AVG 160
Rank #404 / 748
--
3.27
Facility 3.27
NY AVG 3.58
Rank #193 / 407
-38%-9%
$24.1k
Facility $24.1k
NY AVG $67.6k
Rank #348 / 415
75
Facility 75
NY AVG 83
Rank #436 / 593
13
Facility 13
NY AVG 18.5
Rank #129 / 414
3.3
Facility 3.3
NY AVG 5.1
Rank #86 / 414
2118-
25
Facility 25
NY AVG 63
Rank #996 / 1173
Brooke Daley
$14.3M
Facility $14.3M
NY AVG $32.0M
Rank #335 / 403
$5.7M
Facility $5.7M
NY AVG $10.7M
Rank #319 / 403
39.7%
Facility 39.7%
NY AVG 37%
Rank #136 / 403
335413
Van Duyn Center for Rehabilitation and Nursing
NH
Syracuse (West Seneca Turnpike)
513
Facility 513
NY AVG 160
Rank #12 / 748
69.8%
Facility 69.8%
NY AVG 88.3%
Rank #390 / 436
-21%
4.77
Facility 4.77
NY AVG 3.58
Rank #21 / 407
--49%+33%
$750.3k
Facility $750.3k
NY AVG $67.6k
Rank #415 / 415
62
Facility 62
NY AVG 83
Rank #580 / 593
65
Facility 65
NY AVG 18.5
Rank #411 / 414
8.1
Facility 8.1
NY AVG 5.1
Rank #380 / 414
7358A+
8
Facility 8
NY AVG 63
Rank #1097 / 1173
Jack Augenstein
$40.8M
Facility $40.8M
NY AVG $32.0M
Rank #36 / 403
$21.6M
Facility $21.6M
NY AVG $10.7M
Rank #58 / 403
52.9%
Facility 52.9%
NY AVG 37%
Rank #324 / 403
335184

Financial Assistance for
Nursing Home in New York

Washington Center for Rehabilitation and Healthcare is located in Argyle, New York.
Here are the financial assistance programs available to residents in New York.

Get Financial aid guidance

Community First Choice Option

NY Medicaid CFCO

Age 65+ or disabled
General New York resident, Medicaid- eligible, care need (not necessarily nursing home level).
Income Limits (2025) ~$2,829/month 300% FBR, individual
Asset Limits $30,182 individual, higher due to NY Medicaid expansion
NY

Higher asset limit; urban density increases demand.

Benefits
Personal care (5-7 hours/day) Respite care (240 hours/year) Home modifications ($1,500 avg.) Assistive technology ($500 avg.)

Expanded In-Home Services for the Elderly Program (EISEP)

NY EISEP

Age 60+
General New York resident, at risk of decline but not nursing home level.
Income Limits ~$2,500/month individual, varies
Asset Limits $15,000 individual
NY

Cost-sharing required above certain income; urban/rural balance.

Benefits
In-home care (3-5 hours/week) Respite (up to 10 days/year) Case management Transportation (~5 trips/month)

Senior Citizen Rent Increase Exemption (SCRIE)

NY SCRIE

Age 62+
General NYC resident, live in rent-controlled/stabilized apartment, spend >1/3 of income on rent.
Income Limits (2025) $50,000/year household
Asset Limits No strict asset cap, but income-focused eligibility.
NY

Limited to NYC’s rent-regulated units; high demand in urban areas.

Benefits
Rent freeze (e.g., covers increases of $50-$200+/month); tax credit for landlord

Senior Citizen Homeowners’ Exemption (SCHE)

NY SCHE

Age 65+
General NYC resident, own and live in a 1-3 family home, co-op, or condo.
Income Limits (2025) $58,399/year household
Asset Limits No strict asset cap, income-driven eligibility.
NY

Applies only in NYC; excludes large apartment buildings.

Benefits
Property tax reduction (5-50%, e.g., $500-$5,000/year based on income and property value)

New York Foundation for Senior Citizens (NYFSC) Home Sharing Program

NYFSC Home Sharing

Age One participant must be 60+ (host or guest)
General NYC resident, able to share living space.
Income Limits No strict limit, but targets those needing cost relief.
Asset Limits Not applicable; focus on housing need.
NY

Primarily NYC-focused; limited slots due to demand.

Benefits
Shared housing (reduces rent/living costs by 30-50%, e.g., $500-$1,000/month savings); optional light assistance between housemates

Frequently Asked Questions about Washington Center for Rehabilitation and Healthcare

Who is the owner of Washington Center for Rehabilitation and Healthcare?

Washington Center for Rehabilitation and Healthcare is legally operated by Washington Operations Associates, LLC (For Profit).

Is Washington Center for Rehabilitation and Healthcare in a walkable area?

Washington Center for Rehabilitation and Healthcare has a walk score of 25. Somewhat walkable. A few nearby services may be reachable on foot, but most trips require transportation.

What is the license number of Washington Center for Rehabilitation and Healthcare?

According to NY state health department records, Washington Center for Rehabilitation and Healthcare's license number is 5750301N.

What is the occupancy rate at Washington Center for Rehabilitation and Healthcare?

Washington Center for Rehabilitation and Healthcare's occupancy is 4.1%.

Does Washington Center for Rehabilitation and Healthcare operate as a for-profit or non-profit?

Washington Center for Rehabilitation and Healthcare is registered as a for-profit in NY.

How many beds does Washington Center for Rehabilitation and Healthcare have?

Washington Center for Rehabilitation and Healthcare has 122 beds.

Has Washington Center for Rehabilitation and Healthcare had any recent citations?

Washington Center for Rehabilitation and Healthcare has had 20 recently reported citations.

Guides for Better Senior Living

Care Cost Calculator: See Prices in Your Area

Nursing Home Data Explorer

Don’t Wait Too Long: 7 Red Flag Signs Your Parent Needs Assisted Living Now

The True Cost of Assisted Living in 2025 – And How Families Are Paying For It

Understanding Senior Living Costs: Pricing Models, Discounts & Financial Assistance