The McKendree Post Acute and Rehabilitation
CMS overall rating Info CMS (the Centers for Medicare & Medicaid Services) is the federal agency that rates nursing home quality. Its Overall Rating runs from 1 to 5 stars, combining health inspections, staffing, and quality measures, with inspections weighted most heavily.

The McKendree Post Acute and Rehabilitation

CMS overall rating Info CMS (the Centers for Medicare & Medicaid Services) is the federal agency that rates nursing home quality. Its Overall Rating runs from 1 to 5 stars, combining health inspections, staffing, and quality measures, with inspections weighted most heavily.
Calculator: See prices in your area
The McKendree Post Acute and Rehabilitation accepts Medicare, Medicaid, and private pay.

Overview of The Mckendree Post Acute and Rehabilitation

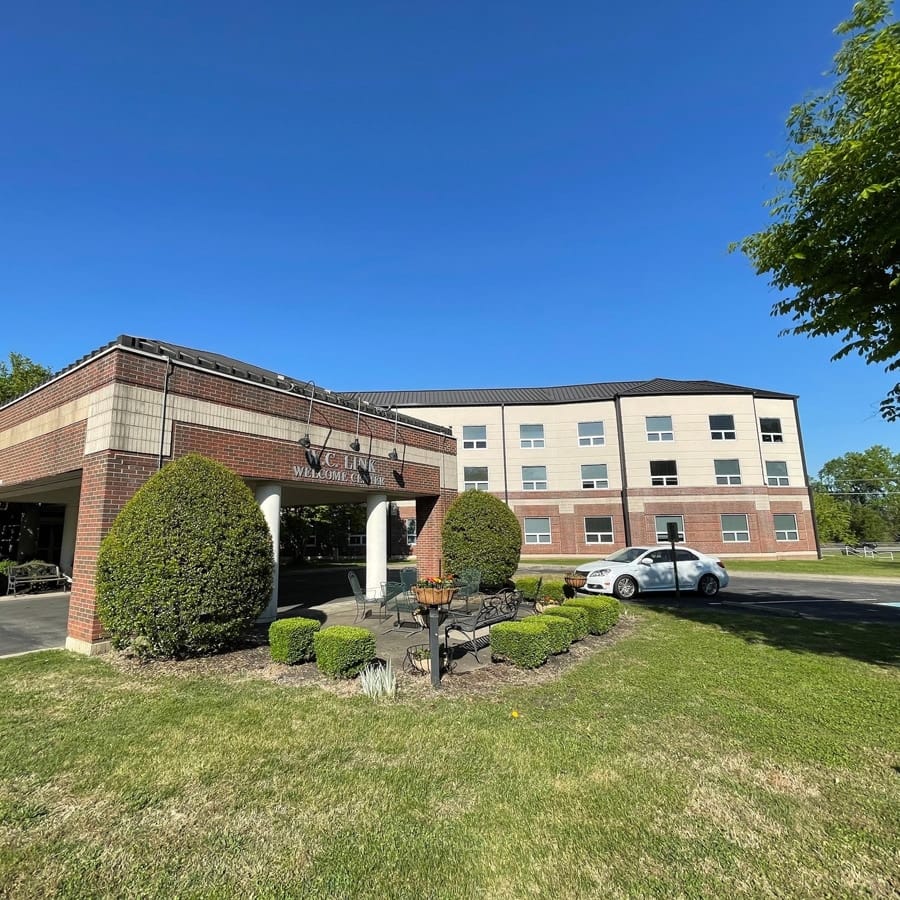
The Mckendree Post Acute and Rehabilitation is an 180-bed nursing home in Hermitage, TN, offering a full continuum of support, including assisted living, memory care, short-term rehabilitation, long-term care, and skilled nursing. Licensed in July 1992 under McKendree SNF Operations, LLC, which is affiliated with Hill Valley Healthcare, the community currently holds a 1-star CMS overall performance rating. Medicare, Medicaid, and private insurance payments are also accepted.

Therapeutic rehabilitation stands out as a verified highlight of the community, with daily physical therapist contact averaging 7 minutes per resident, marking a 40% increase over the Tennessee state average of 5 minutes, which delivers a substantial advantage to individuals recovering from acute medical events. Weekend registered nurse coverage reaches 30 minutes per resident each day, outperforming the state average of 24 minutes and ensuring comprehensive clinical monitoring throughout Saturdays and Sundays. Staffing documentation from the second quarter of 2025 also confirms the presence of a nurse practitioner, clinical nurse specialists, respiratory therapy technicians, speech-language pathologists, and mental health professionals. Overall nursing care averages 3 hours and 3 minutes per resident daily, falling short of the Tennessee average of approximately 3 hours and 40 minutes, while individual hours for registered nurses, licensed practical nurses, and nursing assistants track between 4% and 11% below state benchmarks.

Throughout an eight-year review period, the Tennessee Department of Health executed 4 separate inspections, compiling a total of 47 health citations, representing the largest volume of deficiencies among evaluated local options. 7 of which were deemed critical, 1 was categorized as serious, 38 were labeled moderate, and 1 was judged minor. Specifically, quality of life and clinical care accounted for 11 citations, resident rights made up 8 deficiencies, and issues surrounding abuse, neglect, or exploitation generated 6 citations. Additionally, the most recent formal evaluation on October 3, 2023, yielded critical as well as multiple moderate citations related to abuse and neglect, all of which were documented as resolved.

CMS has designated this community as a Special Focus Facility Candidate, a status reserved for properties possessing a recorded pattern of significant care issues that have not yet entered the official Special Focus Facility program. Independent data indicate the community was subject to active federal monitoring for at least one month between August 2024 and July 2025. However, no monetary fines or payment suspensions were noted in the state records. In September 2025, the management submitted a Certificate of Need request to add 30 dually certified skilled nursing beds, pointing to operational enhancements introduced by the current ownership and a rising regional need for post-acute care.

With an expansive 42-acre campus near Long Hunter State Park and Stones River Bend Park, the community provides structured wellness options and lifestyle events delivered daily through the local EngageLife program.

The Mckendree Post Acute and Rehabilitation is a practical option for older adults seeking a broad spectrum of medical and lifestyle support.

(615) 871-8271

Quality ratings

Measured by Centers for Medicare & Medicaid Services (CMS)

Overall rating Info The Overall CMS Rating combines results from health inspections, staffing levels and quality measures. Health inspections carry the most weight. Staffing and quality scores can increase or decrease the final rating based on performance compared to state and national standards.
▼ 67.3% Below TN avg. ▼ 67.3% Below TN avg.Click the badge to see the full State ranking.Click here to see the full State ranking.
Health Inspection Info Based on the results of the facility's three most recent standard inspections and any complaint investigations. CMS reviews the number, scope, and severity of deficiencies, with more recent findings weighted more heavily.
▼ 65.8% Below TN avg. ▼ 65.8% Below TN avg.Click the badge to see the full State ranking.Click here to see the full State ranking.
Staffing Info Measures average nursing staff hours per resident per day, including Registered Nurses (RNs) and total nursing staff. Ratings are adjusted based on the level of care residents require and are compared to state and national benchmarks.
▼ 59.2% Below TN avg. ▼ 59.2% Below TN avg.Click the badge to see the full State ranking.Click here to see the full State ranking.
Quality Measures Info Based on clinical and physical health indicators reported to CMS, such as hospital readmissions, falls, pressure ulcers, and improvements in mobility. These measures reflect how well residents' health needs are being managed.
▲ 7.2% Above TN avg. ▲ 7.2% Above TN avg.Click the badge to see the full State ranking.Click here to see the full State ranking.

Staffing hours breakdown

Info Daily nursing hours per resident by staff type, reported to CMS. Higher is generally better — compare this facility to state and national averages to see where staffing stands.

Hours per resident per day — compared to Tennessee state averages

Total nursing care / resident Info This home is ranked 142nd out of 172 homes in Tennessee for nurse hours. Total adjusted nursing hours per resident per day, combining RN, LPN, and aide time. CMS adjusts this for case-mix so facilities can be fairly compared.
3h 3m per day
Rank #142 / 172Nurse hours — State benchmarkedThis home is ranked 142nd out of 172 homes in Tennessee for nurse hours. Shows adjusted nurse hours per resident per day benchmarked to the Tennessee average, with a ranking across 172 Tennessee SNFs. More hours mean more direct care. The national average is about 3.5 hrs; below 3.0 is a red flag.Click the rank badge to see the full State ranking.Click here to see the full State ranking.
This facility Tennessee avg (3h 40m per day)
vs Tennessee avg
-17%

4 of 6 metrics below state avg

Standout metric Physical Therapist is +40% above state avg
Staff typeHours / Day / Residentvs state avg
Registered Nurse (RN) Info RNs hold the highest nursing license and can assess residents, interpret test results, and direct care plans. More RN hours per day often signals stronger clinical oversight and faster response to health changes. 33m per day ▼ 11% State avg: 37m per day · National avg: 41m per day
LPN / LVN Info Licensed Practical Nurses (LPNs) or Licensed Vocational Nurses (LVNs) deliver routine hands-on care — medication administration, wound dressing, and monitoring vital signs. They work under RN supervision and make up a large share of daily bedside care. 58m per day ▼ 11% State avg: 1h 5m per day · National avg: 52m per day
Nurse Aide Info Certified Nurse Aides (CNAs) provide the most direct day-to-day assistance: bathing, dressing, feeding, and mobility. Nurse aide hours are typically the largest staffing category and directly affect residents' quality of life. 2h 4m per day ▼ 4% State avg: 2h 9m per day · National avg: 2h 20m per day
Weekend Total Nursing Info Combined nursing hours (RN + LPN + Nurse Aide) per resident per day on weekends. Staffing often drops on weekends — this figure reveals whether the facility maintains adequate coverage outside of weekday hours. 3h 3m per day ▼ 9% State avg: 3h 21m per day · National avg: 3h 26m per day
Physical Therapist Info Hours per resident per day provided by licensed Physical Therapists (PTs) or PT Assistants. PT services help residents recover mobility after injury or illness and are especially important for post-acute (short-stay) rehabilitation. 7m per day ▲ 40% State avg: 5m per day · National avg: 4m per day
Weekend RN Info Registered nurse hours specifically on weekends. Facilities sometimes reduce RN presence on Saturdays and Sundays — a low weekend RN figure compared to weekday hours can indicate reduced clinical oversight when most administrative staff are absent. 30m per day ▲ 25% State avg: 24m per day · National avg: 28m per day

Capacity and availability

This home usually has availability

Higher occupancy than the Tennessee average: 73%
Occupancy rate
81.2% Rank #121 / 303Occupancy rate — State benchmarkedThis home is ranked 121st out of 303 homes in Tennessee for occupancy rate. Shows this facility's occupancy rate versus the Tennessee average, with its Statewide rank out of 303. Higher occupancy signals strong local demand and financial stability.Click the rank badge to see the full State ranking.Click here to see the full State ranking.
Avg. Length of Stay
206 days
Bed community size
180-bed community Rank #17 / 427Bed count — State benchmarkedThis home is ranked 17th out of 427 homes in Tennessee for bed count. Shows this facility's certified or reported bed count compared to other Tennessee SNFs. Larger communities may offer more amenities, programs, and on-site services for residents and families.Click the rank badge to see the full State ranking.Click here to see the full State ranking.
A large-scale community that may provide a wide range of amenities, services, and structured programs.
Years in operation
33 years in operation Rank #67 / 385Years in operation — State benchmarkedThis home is ranked 67th out of 385 homes in Tennessee for years in operation. Shows how long this facility has been in operation compared to other Tennessee SNFs. Longer operating histories may benefit residents, families, and staff.Click the rank badge to see the full State ranking.Click here to see the full State ranking.
A longer operating history, which may indicate experience navigating regulations and delivering ongoing care.
Walk Score
Walk Score: 4 / 100 Rank #489 / 554Walk Score — State benchmarkedThis home is ranked 489th out of 554 homes in Tennessee for walk score. Shows how walkable this facility's neighborhood is compared to the average Walk Score across Tennessee SNFs. Higher scores benefit residents, families, and staff.Click the rank badge to see the full State ranking.Click here to see the full State ranking.
Car-dependent. Most errands require a car, with limited nearby walkable options.

About this community

License Details

Facility TypeNursing Home
StatusLicensed
IssuanceJuly 1, 1992
ExpirationFebruary 7, 2026
License Number00000058

Ownership & Operating Entity

The McKendree Post Acute and Rehabilitation is administrated by Britney Nash.

Owner NameMckendree Snf Operations, LLC

Safety & Compliance

Emergency SystemsYes
Safety FeaturesEmergency call systems available.

Therapy & Rehabilitation

2 services
Rehabilitation Services
Respite Care

Staffing & Medical

1 service
24-Hour Staffing

Amenities & Lifestyle

ActivitiesEngageLife events and activities are available.
Specific ProgramsShort-Term Rehab, Programs & Activities Calendar, Wellness Programs & Amenities, Public Events
Operating HoursOpen 24 hours

Pricing & Financial Information

Assisted Living$3,750 per month
Memory Care$5,065 per month

Dining & Nutrition

Food DescriptionDining experiences are offered with a focus on flavorful meals.

Contact The McKendree Post Acute and Rehabilitation

Inspection History

In Tennessee, the Department of Health, Division of Health Care Facilities performs unannounced inspections and investigations to ensure facilities provide high-quality resident care.

Since 2022 · 4 years of data 2 citations

Inspection Scorecard Info This scorecard compares key inspection, citation, and complaint metrics at this facility against the Tennessee state average. Metrics rated ≥15% worse than average are highlighted in red; those ≥15% better are highlighted in green.

Since 2022 vs. Tennessee state average
Overall vs. TN average 0 Worse No metrics in this bucket. 2 Better Metrics better than Tennessee average:
• Total citations (50% below)
• Citations per year (50% below)
Latest Inspection October 3, 2023

Citations Info Citations are formal regulatory issues recorded during state inspections.

This FacilityTN Averagevs. TN Avg
Total citations Info Formal regulatory issues recorded by inspectors across all inspection types. 24 This facility has 50% fewer total citations than a typical Tennessee nursing home (2 vs. TN avg 4).↓ 50% better
Citations per year Info Average citations per year since 2022. 0.51 This facility has 50% fewer citations per year than a typical Tennessee nursing home (0.5 vs. TN avg 1).↓ 50% better

Health Inspection History

Inspections since 2018
Total health inspections 4

Tennessee average 3.5


Last Health inspection on Oct 2023

Total health citations
47 Rank #176 / 176Health citations — State benchmarkedThis home is ranked 176th out of 176 homes in Tennessee for health citations. Shows this facility's total health deficiency citations benchmarked to the Tennessee State average, with a ranking across all 176 TN SNFs. Lower citation counts earn a better rank.Click the rank badge to see the full State ranking.Click here to see the full State ranking.

Tennessee average 15.4

Citations per inspection
11.75 Rank #176 / 176Citations per inspection — State benchmarkedThis home is ranked 176th out of 176 homes in Tennessee for citations per inspection. Shows average deficiency citations per CMS inspection for this facility versus the Tennessee mean across 176 SNFs with citation data. Lower is better.Click the rank badge to see the full State ranking.Click here to see the full State ranking.

Tennessee average 4.39


Health citations are formal notices following inspections when they fail to comply with safety and care standards.

11 of 47 citations resulted from standard inspections; 11 of 47 resulted from complaint investigations; and 25 of 47 came from combined inspections (standard and complaint).

Breakdown of citation severity (last 8 years)
Critical health citations
7
536% worse than Tennessee average

Tennessee average: 1.1


Serious health citations
1
67% worse than Tennessee average

Tennessee average: 0.6

7 critical citations Tennessee average: 1.1

1 serious citation Tennessee average: 0.6

38 moderate citations Tennessee average: 13.7

1 minor citation Tennessee average: 0.1
Citations history (last 8 years)
Abuse/Neglect critical citation Oct 03, 2023
Corrected

Abuse/Neglect moderate citation Oct 03, 2023
Corrected

Abuse/Neglect moderate citation Oct 03, 2023
Corrected

Abuse/Neglect moderate citation Oct 03, 2023
Corrected

Staffing Data

Reporting period: October 1 – December 31, 2025 (Q4 2025). Source: CMS Payroll-Based Journal report.

Total staff 413
Employees 210
Contractors 203
Staff to resident ratio 2.85 : 1
63% more staff per resident than Tennessee average
Tennessee average ratio: 1.75 : 1 Tennessee average ratio: 1.75 : 1See full Tennessee ranking
Avg staff/day 88
Average shift 8.8 hours
6% better than Tennessee average
Tennessee average: 8.3 hours Tennessee average shift: 8.3 hoursSee full Tennessee ranking
Total staff hours (quarter) 71,350

Nursing staff breakdown

Q4 2025 · Oct 1 – Dec 31 More info This data comes from the CMS Payroll-Based Journal report covering October 1 – December 31, 2025.
Registered Nurse

Manages medical care and health needs.

RN Staff Info 76 total: 17 full-time employees and 59 contractors. 76
Average shift length Info Average shift length. Calculated as total hours divided by days worked and average staff per day. 11 hours
Licensed Practical Nurse

Assists with medical care and medications.

LPN Staff Info 89 total: 30 full-time employees and 59 contractors. 89
Average shift length Info Average shift length. Calculated as total hours divided by days worked and average staff per day. 9.9 hours
Certified Nursing Assistant

Helps with daily care and mobility.

CNA Staff Info 174 total: 89 full-time employees and 85 contractors. 174
Average shift length Info Average shift length. Calculated as total hours divided by days worked and average staff per day. 9.2 hours

Contractor staffing

Q4 2025 · Oct 1 – Dec 31 More info This data comes from the CMS Payroll-Based Journal report covering October 1 – December 31, 2025.

Total hours from contractors

10.8%

7,715 contractor hours this quarter

Certified Nursing Assistant: 85 Licensed Practical Nurse: 59 Registered Nurse: 59

Staff by category

Q4 2025 · Oct 1 – Dec 31 More info This data comes from the CMS Payroll-Based Journal report covering October 1 – December 31, 2025.
Certified Nursing Assistant898517431,74492100%9.2
Licensed Practical Nurse30598911,63492100%9.9
Registered Nurse1759766,46992100%11
Physical Therapist160165,74292100%7.3
RN Director of Nursing140144,7098896%8.2
Clinical Nurse Specialist9091,7227379%7.8
Respiratory Therapy Technician9091,5948390%6.4
Other Dietary Services Staff5051,4998896%7.6
Mental Health Service Worker2029846470%8
Physical Therapy Assistant5059407885%6.2
Physical Therapy Aide3038796975%6.9
Qualified Social Worker5058697076%6.9
Speech Language Pathologist2025656470%7.2
Administrator1015126470%8
Nurse Practitioner1015126470%8
Dietitian1014966267%8
Occupational Therapy Aide1014806065%8
174 Certified Nursing Assistant
% of Days 100%
89 Licensed Practical Nurse
% of Days 100%
76 Registered Nurse
% of Days 100%
16 Physical Therapist
% of Days 100%
14 RN Director of Nursing
% of Days 96%
9 Clinical Nurse Specialist
% of Days 79%
9 Respiratory Therapy Technician
% of Days 90%
5 Other Dietary Services Staff
% of Days 96%
2 Mental Health Service Worker
% of Days 70%
5 Physical Therapy Assistant
% of Days 85%
3 Physical Therapy Aide
% of Days 75%
5 Qualified Social Worker
% of Days 76%
2 Speech Language Pathologist
% of Days 70%
1 Administrator
% of Days 70%
1 Nurse Practitioner
% of Days 70%
1 Dietitian
% of Days 67%
1 Occupational Therapy Aide
% of Days 65%

Penalties and fines

Includes penalties issued in 2023

Federal penalties imposed by CMS for regulatory violations, including civil money penalties (fines) and denials of payment for new Medicare/Medicaid admissions.

Source: CMS Penalties Database (Data as of Jan 2026)

Total fines amount $252K Rank #172 / 177Federal fines — State benchmarkedThis home is ranked 172nd out of 177 homes in Tennessee for federal fines. Shows this facility's cumulative CMS federal fine dollars versus the Tennessee average among facilities with fines, and where it ranks among 177 skilled nursing facilities in the pool. Lower total dollars mean a better rank.Click the rank badge to see the full State ranking.Click here to see the full State ranking.
192% higher than Tennessee average

Tennessee average: $86K

Number of fines 1
43% fewer fines than Tennessee average

Tennessee average: 1.7

Payment Denials Info Serious action where Medicare and/or Medicaid temporarily stops payments for new residents until issues are fixed. 1
96% more payment denials than Tennessee average

Tennessee average: 0.5

Fines amount comparison
This facility $252K
Tennessee average $86K
Penalty History

Penalties are imposed by CMS for violations of federal nursing home regulations.

2 penalties in the past 3 years

Multiple penalties were reported in the last 3 years.

Civil Money Penalty Info Fines imposed for noncompliance, which can be assessed per day or per instance of violation. Oct 3, 2023
$252K
Payment Denial Info Serious action where Medicare and/or Medicaid temporarily stops payments for new residents until issues are fixed. Oct 3, 2023
74 days

Last updated: Jan 2026

Quality of care over time

These measures show how residents usually do over time at this home, based on health outcomes and preventive care.

High-risk clinical events score Info A composite score based on pressure ulcers, falls with injury, weight loss, walking ability decline, and activities of daily living decline. 11.2
7% worse than Tennessee average

Tennessee average: 10.5

Functional decline score Info A composite score based on activities of daily living decline, walking ability decline, and incontinence. 19.8
In line with Tennessee average

Tennessee average: 19.5

Long-stay resident measures
Above average Info CMS star rating based on long-stay quality measure performance. 5 stars = significantly above average, 1 star = significantly below average.
Need for Help with Daily Activities Increased Info Percent of long-stay residents whose need for help with daily activities has increased 15.6%
In line with Tennessee average

Tennessee average: 16.0%

Walking Ability Worsened Info Percent of long-stay residents whose ability to move independently worsened 17.8%
18% better than Tennessee average

Tennessee average: 21.7%

Low Risk Residents with Bowel/Bladder Incontinence Info Percent of low risk long-stay residents who lose control of their bowels or bladder 26.0%
25% worse than Tennessee average

Tennessee average: 20.7%

Falls with Major Injury Info Percent of long-stay residents experiencing one or more falls with major injury 3.1%
16% better than Tennessee average

Tennessee average: 3.7%

High Risk Residents with Pressure Ulcers Info Percent of long-stay high risk residents with pressure ulcers 7.4%
37% worse than Tennessee average

Tennessee average: 5.4%

Urinary Tract Infection Info Percent of long-stay residents with a urinary tract infection 0.4%
82% better than Tennessee average

Tennessee average: 2.1%

Lost Too Much Weight Info Percent of long-stay residents who lose too much weight 12.2%
93% worse than Tennessee average

Tennessee average: 6.3%

Depressive Symptoms Info Percent of long-stay residents who have depressive symptoms 28.3%
157% worse than Tennessee average

Tennessee average: 11.0%

Antipsychotic Use Info Percent of long-stay residents who received an antipsychotic medication 16.6%
In line with Tennessee average

Tennessee average: 16.5%

Pneumococcal Vaccine Info Percent of long-stay residents assessed and appropriately given the pneumococcal vaccine 37.3%
59% worse than Tennessee average

Tennessee average: 89.9%

Influenza Vaccine Info Percent of long-stay residents assessed and appropriately given the seasonal influenza vaccine 79.9%
15% worse than Tennessee average

Tennessee average: 94.5%

Hospitalizations per 1,000 days Info Number of hospitalizations per 1,000 long-stay resident days. 1.91
21% worse than Tennessee average

Tennessee average: 1.58

ED visits per 1,000 days Info Number of outpatient emergency department visits per 1,000 long-stay resident days. 0.75
52% better than Tennessee average

Tennessee average: 1.57

Short-stay resident measures
Average Info CMS star rating based on short-stay quality measure performance. 5 stars = much above average, 1 star = much below average.
Pneumococcal Vaccine Info Percent of short-stay residents assessed and appropriately given the pneumococcal vaccine 7.9%
90% worse than Tennessee average

Tennessee average: 79.7%

Antipsychotic medication increase Info Percent of short-stay residents who newly received an antipsychotic medication 1.1%
38% better than Tennessee average

Tennessee average: 1.7%

Influenza Vaccine Info Percent of short-stay residents assessed and appropriately given the seasonal influenza vaccine 8.0%
90% worse than Tennessee average

Tennessee average: 79.8%

Re-hospitalized after SNF stay Info Percentage of short-stay residents who were re-hospitalized after their nursing home admission. 26.3%
18% worse than Tennessee average

Tennessee average: 22.2%

Emergency department visits Info Percentage of short-stay residents who had an outpatient emergency department visit. 11.3%
In line with Tennessee average

Tennessee average: 11.2%

Falls with major injury Info Percentage of SNF residents who experience falls with major injury during their stay. 1.1%
40% worse than Tennessee average

Tennessee average: 0.8%

Ability to care for self at discharge Info Percentage of residents at or above expected ability to care for themselves at discharge. 54.9%
In line with Tennessee average

Tennessee average: 53.7%

Successful return to home or community Info Rate of successful return to home or community from a skilled nursing facility. 50.8%
In line with Tennessee average

Tennessee average: 50.6%

Breakdown by payment type

Medicare

35% of new residents, usually for short-term rehab.

Typical stay 8 - 9 months

Private pay

60% of new residents, often for short stays.

Typical stay 3 - 4 months

Medicaid

5% of new residents, often for long-term daily care.

Typical stay 9 - 10 months

Facility Characteristics

Source: CMS Long-Term Care Facility Characteristics (Data as of Jan 2026)

Total residents 145
Medicare
7
4.8% of residents
Medicaid
80
55.2% of residents
Private pay or other
58
40% of residents
Programs & Services
Residents Group

Residents meet regularly to discuss policies, care quality, and activities

CCRC

Part of a Continuing Care Retirement Community offering multiple care levels

Active Resident Council

Organized group of residents that meets regularly to discuss facility policies, quality of life, and activities.

Finances and operations

Governmental community
Operated by a subsidized facility district.
Home revenue
$25.7M
Operating deficit
-$5.2M
Governmental community Operated by a subsidized facility district.
Home revenue
$25.7M Rank #10 / 176Revenue — State benchmarkedThis home is ranked 10th out of 176 homes in Tennessee for revenue. Shows this facility's annual revenue compared to the Tennessee SNF average. Higher revenue generally means more resources for staffing and capital — read alongside Payroll %.Click the rank badge to see the full State ranking.Click here to see the full State ranking.
Operating deficit
-$5.2M
Payroll costs Info The portion of the home's budget spent on staff, including nurses, caregivers, and other employees who support care and operations. Rank #7 / 176Payroll — State benchmarkedThis home is ranked 7th out of 176 homes in Tennessee for payroll. Shows total annual staff payroll benchmarked to the Tennessee average. Higher payroll investment relative to peers often signals better staffing and less reliance on cheaper contract labor.Click the rank badge to see the full State ranking.Click here to see the full State ranking.
$14.7M
57.3% of revenue Rank #19 / 176Payroll % — State benchmarkedThis home is ranked 19th out of 176 homes in Tennessee for payroll %. Shows payroll as a percentage of revenue versus the Tennessee average. Well-run Tennessee SNFs typically land around 50–60% — the top third Statewide. Below 25% may signal understaffing or heavy agency use — read with Staffing ratings.Click the rank badge to see the full State ranking.Click here to see the full State ranking.
Other operating costs Info All remaining costs needed to run the home, such as food, utilities, building maintenance, supplies and administrative expenses.
$16.2M
Total costs $30.9M

Who this home usually serves

TYPE OF STAY

Mix of rehab and long-term care

This home supports both short-term rehab and long-term care, with residents staying for a wide range of durations.

Places of interest near The McKendree Post Acute and Rehabilitation

Address 4.5 miles from city center Info Estimated distance in miles from Hermitage's city center to The McKendree Post Acute and Rehabilitation's address, calculated via Google Maps.

Calculate Travel Distance to The McKendree Post Acute and Rehabilitation

Add your location

Address

Financial Assistance for
Nursing Home in Tennessee

The McKendree Post Acute and Rehabilitation is located in Hermitage, Tennessee.
Here are the financial assistance programs available to residents in Tennessee.

Get Financial aid guidance

CHOICES Program

TN Medicaid CHOICES

Age 65+ or disabled
General Tennessee resident, Medicaid-eligible, nursing home-level care need.
Income Limits (2025) ~$2,829/month 300% FBR, individual
Asset Limits $2,000 (individual), $3,000 (couple).
TN

Managed care model; high rural demand.

Benefits
Personal care (5-7 hours/day) Respite (240 hours/year) Adult day care ($65/day) Home modifications ($1,500 avg.)

Tennessee Options for Community Living

TN Options

Age 60+
General Tennessee resident, at risk of nursing home.
Income Limits ~$2,000/month individual, varies
Asset Limits $5,000 individual
TN

Limited funding; rural/urban balance.

Benefits
In-home care (3-5 hours/week) Respite (up to 10 days/year) Transportation (~5 trips/month)

Medicare Savings Program (MSP)

Tennessee Medicare Savings Program

Age 65+ or disabled
General TN resident, Medicare Part A/B.
Income Limits (2025) ~$2,510/month (QMB), ~$3,380/month (SLMB), ~$3,598/month (QI)—individual.
Asset Limits $9,430 (individual), $14,130 (couple).
TN

Three tiers; includes Extra Help for Part D; no waitlist.

Benefits
Covers Part B premiums ($174.70/month) Deductibles ($240/year) Copays (~20%)

Family Caregiver Support Program (FCSP)

Tennessee Family Caregiver Support Program

Age
General Caregivers of 60+ needing care or 55+ caregivers of others; TN resident; functional needs (2+ ADLs).
Income Limits (2025) No strict cap; prioritizes low-income ~$24,980/year
Asset Limits Not assessed; need-based.
TN

Includes grandparent caregivers; high rural demand.

Benefits
Respite (4-6 hours/week or 5 days/year) Adult day care ($60/day) Training Supplies (~$500/year)

VA Aid and Attendance (A&A) and Housebound Benefits

Tennessee VA Aid and Attendance/Housebound

Age 65+ or disabled veteran/spouse
General TN resident, wartime service, need for ADL help (A&A) or homebound.
Income Limits (2025) Net income < ~$1,984/month (veteran with dependent, A&A); pension offsets income.
Asset Limits ~$155,356 net worth limit
TN

High veteran population; supports rural/urban care needs.

Benefits
Cash (~$1,433-$2,642/month veteran, ~$951-$1,318 spouse) for care costs (e.g., in-home, assisted living)

Elderly Nutrition Program

Tennessee Elderly Nutrition Program

Age 60+
General TN resident; no income limit but prioritizes low-income.
Income Limits (2025) None; donations encouraged.
Asset Limits Not assessed.
TN

Serves ~50,000 annually; 200+ congregate sites plus Meals on Wheels.

Benefits
Congregate meals ($5-$7/meal value) at senior centers Home-delivered meals ($5-$7/meal)

Property Tax Relief Program

Tennessee Property Tax Relief Program

Age 65+
General TN resident, homeowner/renter (or widow/er 50+, disabled 18+).
Income Limits (2025) ~$45,000/year household, excludes half of Social Security
Asset Limits Not assessed; income-focused.
TN

Rebates up to $1,000; serves ~100,000 annually.

Benefits
Tax rebates (~$250-$1,000 based on income; e.g., $1,000 if income < $8,000)

Frequently Asked Questions about The McKendree Post Acute and Rehabilitation

Who is the owner of The McKendree Post Acute and Rehabilitation?

The legal owner and operator of The McKendree Post Acute and Rehabilitation is McKendree SNF Operations, LLC.

Is The McKendree Post Acute and Rehabilitation in a walkable area?

The McKendree Post Acute and Rehabilitation has a walk score of 4. Car-dependent. Most errands require a car, with limited nearby walkable options.

What is the license number of The McKendree Post Acute and Rehabilitation?

According to TN state health department records, The McKendree Post Acute and Rehabilitation's license number is 00000058.

When does The McKendree Post Acute and Rehabilitation's license expire?

According to TN state health department records, The McKendree Post Acute and Rehabilitation's license expires on February 7, 2026.

Who is the administrator of The McKendree Post Acute and Rehabilitation?

Britney Nash is the administrator of The McKendree Post Acute and Rehabilitation.

How many beds does The McKendree Post Acute and Rehabilitation have?

The McKendree Post Acute and Rehabilitation has 180 beds.

Are there photos of The McKendree Post Acute and Rehabilitation?

Yes — there are 10 photos of The McKendree Post Acute and Rehabilitation in the photo gallery on this page.

Guides for Better Senior Living

Care Cost Calculator: See Prices in Your Area

Nursing Home Data Explorer

Don’t Wait Too Long: 7 Red Flag Signs Your Parent Needs Assisted Living Now

The True Cost of Assisted Living in 2025 – And How Families Are Paying For It

Understanding Senior Living Costs: Pricing Models, Discounts & Financial Assistance

Explore Open Rooms
1 Contact details
2 What type of senior care service are you looking for?
3 What budget do you have in mind for senior care?
4 How soon do you need to find care?
5 Additional details

Thank you for your interest!

Our team will be in touch shortly to help with next steps.