Tri State Health and Rehabilitation Center
CMS overall rating Info CMS (the Centers for Medicare & Medicaid Services) is the federal agency that rates nursing home quality. Its Overall Rating runs from 1 to 5 stars, combining health inspections, staffing, and quality measures, with inspections weighted most heavily.

Tri State Health and Rehabilitation Center

CMS overall rating Info CMS (the Centers for Medicare & Medicaid Services) is the federal agency that rates nursing home quality. Its Overall Rating runs from 1 to 5 stars, combining health inspections, staffing, and quality measures, with inspections weighted most heavily.
Calculator: See prices in your area
Tri State Health and Rehabilitation Center accepts Medicaid, Medicare, and private pay.

Overview of Tri State Health and Rehabilitation Center

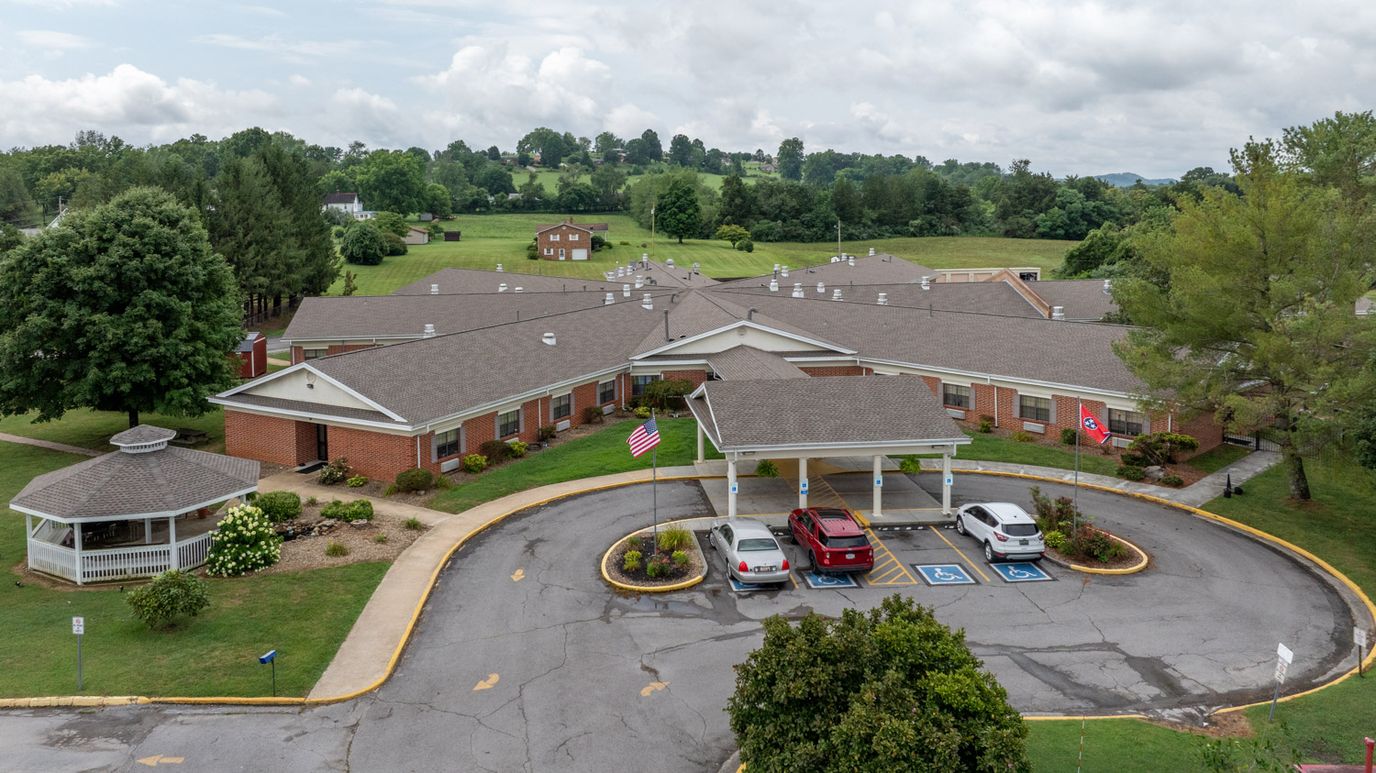
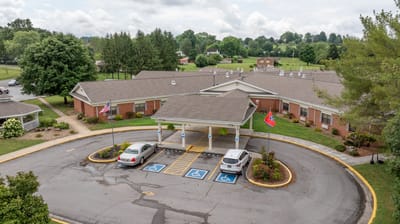
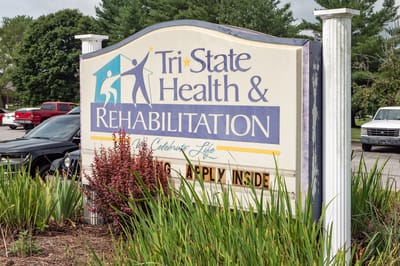
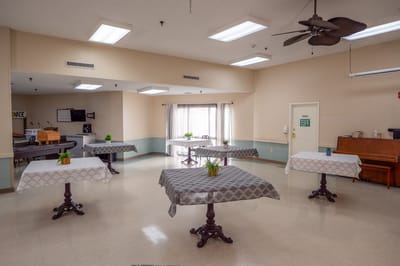
Tri-State Health and Rehabilitation Center in Harrogate, TN, is a nursing home that offers long-term care, short-term rehabilitation, memory support, expert nursing, and respite stays. Serving the region since July 1992, this long-standing provider is owned by Raven Lake Healthcare Inc., with Magen Ann Smith acting as administrator under the larger Ensign Services network umbrella. Admitting individuals who rely on Medicare, Medicaid, or private funds, the community currently holds a 1-star quality score from CMS. An active monthly calendar, religious services, a signature “Stay Active” wellness framework, and 24-hour care via on-staff doctors, credentialed nurses, and certified aides are also provided.

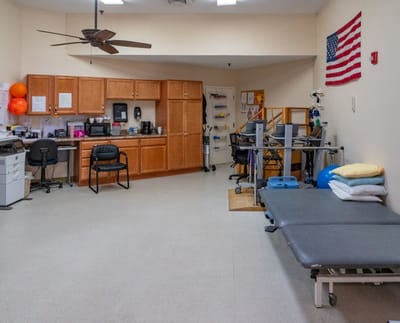
A primary differentiator for this neighborhood is its exceptional allocation of registered nurse hours. The data indicate that registered nurses spend an average of 45 minutes of direct attention on each resident daily, beating the Tennessee state norm of 37 minutes by 22% and comfortably passing the national benchmark of 41 minutes. This robust staffing metric leads all other personnel data categories. Certified nursing assistants, licensed practical nurses, and registered nurses all completed their 91-day cycles with unbroken 100% shift coverage. The local workforce additionally includes respiratory therapists, dental practitioners, speech therapists, and nurse practitioners. Total adjusted nursing attention equals 3 hours and 16 minutes per resident every day, though licensed practical nurse and nursing assistant hours track slightly under state medians. Crucially for families prioritizing rehabilitation, physical therapist availability averages 3 minutes per resident daily, a 40% reduction when measured against the state average of 5 minutes.

Regulatory records from the Tennessee Department of Health document 4 total evaluations throughout a seven-year period, resulting in 12 health deficiencies. Significantly, 8 of these 12 citations grew out of specific complaint investigations rather than routine annual reviews, a pattern pointing toward a heavily complaint-driven oversight dynamic. Of the 12 deficiencies, 5 reached a critical tier of severity, with zero serious, 7 moderate, and 0 minor marks. The most recent state overview from September 26, 2024, uncovered 3 critical administrative citations and 1 moderate citation regarding abuse or neglect, all of which are now officially marked as resolved. Broadly sorted, quality of life issues and administrative oversight combined for half the total findings with 3 citations each, while infection control and abuse themes contributed 1 apiece. Third-party channels show 4 verified complaints alongside a single civil monetary penalty in recent cycles.

Since it represents the only skilled nursing choice in Harrogate, the community draws heavily from a short-stay demographic. Private insurance accounts for 64% of arrivals, typically involving stays lasting one to two months, while Medicare admissions for post-acute rehabilitation comprise 26% of the base, holding a similar one-to-two-month duration. Total occupancy hovers around 75.3%, trailing the statewide average.

For those seeking localized medical care along the tri-state borders of Tennessee, Kentucky, and Virginia, Tri-State Health and Rehabilitation Center offers families a localized care choice with an entirely permanent, employee-only nursing staff and strong registered nurse availability for older adults.

Quality ratings

Measured by Centers for Medicare & Medicaid Services (CMS)

Overall rating Info The Overall CMS Rating combines results from health inspections, staffing levels and quality measures. Health inspections carry the most weight. Staffing and quality scores can increase or decrease the final rating based on performance compared to state and national standards.
▼ 67.3% Below TN avg. ▼ 67.3% Below TN avg.Click the badge to see the full State ranking.Click here to see the full State ranking.
Health Inspection Info Based on the results of the facility's three most recent standard inspections and any complaint investigations. CMS reviews the number, scope, and severity of deficiencies, with more recent findings weighted more heavily.
▼ 65.8% Below TN avg. ▼ 65.8% Below TN avg.Click the badge to see the full State ranking.Click here to see the full State ranking.
Staffing Info Measures average nursing staff hours per resident per day, including Registered Nurses (RNs) and total nursing staff. Ratings are adjusted based on the level of care residents require and are compared to state and national benchmarks.
▲ 22.4% Above TN avg. ▲ 22.4% Above TN avg.Click the badge to see the full State ranking.Click here to see the full State ranking.
Quality Measures Info Based on clinical and physical health indicators reported to CMS, such as hospital readmissions, falls, pressure ulcers, and improvements in mobility. These measures reflect how well residents' health needs are being managed.
▲ 7.2% Above TN avg. ▲ 7.2% Above TN avg.Click the badge to see the full State ranking.Click here to see the full State ranking.

Staffing hours breakdown

Info Daily nursing hours per resident by staff type, reported to CMS. Higher is generally better — compare this facility to state and national averages to see where staffing stands.

Hours per resident per day — compared to Tennessee state averages

Total nursing care / resident Info This home is ranked 101st out of 172 homes in Tennessee for nurse hours. Total adjusted nursing hours per resident per day, combining RN, LPN, and aide time. CMS adjusts this for case-mix so facilities can be fairly compared.
3h 16m per day
Rank #101 / 172Nurse hours — State benchmarkedThis home is ranked 101st out of 172 homes in Tennessee for nurse hours. Shows adjusted nurse hours per resident per day benchmarked to the Tennessee average, with a ranking across 172 Tennessee SNFs. More hours mean more direct care. The national average is about 3.5 hrs; below 3.0 is a red flag.Click the rank badge to see the full State ranking.Click here to see the full State ranking.
This facility Tennessee avg (3h 40m per day)
vs Tennessee avg
-11%

5 of 6 metrics below state avg

Standout metric Registered Nurse (RN) is +22% above state avg
Staff typeHours / Day / Residentvs state avg
Registered Nurse (RN) Info RNs hold the highest nursing license and can assess residents, interpret test results, and direct care plans. More RN hours per day often signals stronger clinical oversight and faster response to health changes. 45m per day ▲ 22% State avg: 37m per day · National avg: 41m per day
LPN / LVN Info Licensed Practical Nurses (LPNs) or Licensed Vocational Nurses (LVNs) deliver routine hands-on care — medication administration, wound dressing, and monitoring vital signs. They work under RN supervision and make up a large share of daily bedside care. 51m per day ▼ 22% State avg: 1h 5m per day · National avg: 52m per day
Nurse Aide Info Certified Nurse Aides (CNAs) provide the most direct day-to-day assistance: bathing, dressing, feeding, and mobility. Nurse aide hours are typically the largest staffing category and directly affect residents' quality of life. 2h 2m per day ▼ 5% State avg: 2h 9m per day · National avg: 2h 20m per day
Weekend Total Nursing Info Combined nursing hours (RN + LPN + Nurse Aide) per resident per day on weekends. Staffing often drops on weekends — this figure reveals whether the facility maintains adequate coverage outside of weekday hours. 3h 12m per day ▼ 4% State avg: 3h 21m per day · National avg: 3h 26m per day
Physical Therapist Info Hours per resident per day provided by licensed Physical Therapists (PTs) or PT Assistants. PT services help residents recover mobility after injury or illness and are especially important for post-acute (short-stay) rehabilitation. 3m per day ▼ 40% State avg: 5m per day · National avg: 4m per day
Weekend RN Info Registered nurse hours specifically on weekends. Facilities sometimes reduce RN presence on Saturdays and Sundays — a low weekend RN figure compared to weekday hours can indicate reduced clinical oversight when most administrative staff are absent. 22m per day ▼ 8% State avg: 24m per day · National avg: 28m per day

Capacity and availability

This home usually has availability

Higher occupancy than the Tennessee average: 73%
Occupancy rate
75.3% Rank #159 / 303Occupancy rate — State benchmarkedThis home is ranked 159th out of 303 homes in Tennessee for occupancy rate. Shows this facility's occupancy rate versus the Tennessee average, with its Statewide rank out of 303. Higher occupancy signals strong local demand and financial stability.Click the rank badge to see the full State ranking.Click here to see the full State ranking.
Avg. Length of Stay
82 days
Bed community size
116-bed community Rank #106 / 427Bed count — State benchmarkedThis home is ranked 106th out of 427 homes in Tennessee for bed count. Shows this facility's certified or reported bed count compared to other Tennessee SNFs. Larger communities may offer more amenities, programs, and on-site services for residents and families.Click the rank badge to see the full State ranking.Click here to see the full State ranking.
A larger shared setting that may offer more common spaces and organized community services.
Years in operation
33 years in operation Rank #67 / 385Years in operation — State benchmarkedThis home is ranked 67th out of 385 homes in Tennessee for years in operation. Shows how long this facility has been in operation compared to other Tennessee SNFs. Longer operating histories may benefit residents, families, and staff.Click the rank badge to see the full State ranking.Click here to see the full State ranking.
A longer operating history, which may indicate experience navigating regulations and delivering ongoing care.
Walk Score
Walk Score: 47 / 100 Rank #167 / 554Walk Score — State benchmarkedThis home is ranked 167th out of 554 homes in Tennessee for walk score. Shows how walkable this facility's neighborhood is compared to the average Walk Score across Tennessee SNFs. Higher scores benefit residents, families, and staff.Click the rank badge to see the full State ranking.Click here to see the full State ranking.
Somewhat walkable. A few nearby services may be reachable on foot, but most trips require transportation.

About this community

License Details

Facility TypeNursing Home
StatusLicensed
IssuanceJuly 1, 1992
ExpirationAugust 1, 2026
License Number00000038

Ownership & Operating Entity

Tri State Health and Rehabilitation Center is administrated by Magen Ann Smith.

Owner NameRaven Lake Healthcare Inc

Payment & Insurance

2 services
Accept Medicaid
Accept Medicare

Therapy & Rehabilitation

1 service
Rehabilitation Services

Staffing & Medical

2 services
Doctor on Staff
24-Hour Staffing

Amenities & Lifestyle

ActivitiesMonthly activity calendars packed with options designed to help residents stay active.
Specific ProgramsIn-House Therapy, Stay Active, Videos & Photos
Religious ServicesYes

Dining & Nutrition

Food DescriptionNutritious satisfying menus are provided.

Contact Tri State Health and Rehabilitation Center

Inspection History

In Tennessee, the Department of Health, Division of Health Care Facilities performs unannounced inspections and investigations to ensure facilities provide high-quality resident care.

Since 2019 · 7 years of data 1 citation

Inspection Scorecard Info This scorecard compares key inspection, citation, and complaint metrics at this facility against the Tennessee state average. Metrics rated ≥15% worse than average are highlighted in red; those ≥15% better are highlighted in green.

Since 2019 vs. Tennessee state average
Overall vs. TN average 0 Worse No metrics in this bucket. 2 Better Metrics better than Tennessee average:
• Total citations (75% below)
• Citations per year (83% below)
Latest Inspection August 16, 2023

Citations Info Citations are formal regulatory issues recorded during state inspections.

This FacilityTN Averagevs. TN Avg
Total citations Info Formal regulatory issues recorded by inspectors across all inspection types. 14 This facility has 75% fewer total citations than a typical Tennessee nursing home (1 vs. TN avg 4).↓ 75% better
Citations per year Info Average citations per year since 2019. 0.10.6 This facility has 83% fewer citations per year than a typical Tennessee nursing home (0.1 vs. TN avg 0.6).↓ 83% better

Health Inspection History

Inspections since 2019
Total health inspections 4

Tennessee average 3.5


Last Health inspection on Sep 2024

Total health citations
12 Rank #70 / 176Health citations — State benchmarkedThis home is ranked 70th out of 176 homes in Tennessee for health citations. Shows this facility's total health deficiency citations benchmarked to the Tennessee State average, with a ranking across all 176 TN SNFs. Lower citation counts earn a better rank.Click the rank badge to see the full State ranking.Click here to see the full State ranking.

Tennessee average 15.4

Citations per inspection
3 Rank #42 / 176Citations per inspection — State benchmarkedThis home is ranked 42nd out of 176 homes in Tennessee for citations per inspection. Shows average deficiency citations per CMS inspection for this facility versus the Tennessee mean across 176 SNFs with citation data. Lower is better.Click the rank badge to see the full State ranking.Click here to see the full State ranking.

Tennessee average 4.39


Health citations are formal notices following inspections when they fail to comply with safety and care standards.

4 of 12 citations resulted from standard inspections; and 8 of 12 resulted from complaint investigations.

Breakdown of citation severity (last 7 years)
Critical health citations
5
355% worse than Tennessee average

Tennessee average: 1.1


Serious health citations
0
100% better than Tennessee average

Tennessee average: 0.6

5 critical citations Tennessee average: 1.1

0 serious citations Tennessee average: 0.6

7 moderate citations Tennessee average: 13.7

0 minor citations Tennessee average: 0.1
Citations history (last 7 years)
Abuse/Neglect moderate citation Sep 26, 2024
Corrected

Administration critical citation Sep 26, 2024
Corrected

Administration critical citation Sep 26, 2024
Corrected

Administration critical citation Sep 26, 2024
Corrected

Staffing Data

Reporting period: October 1 – December 31, 2025 (Q4 2025). Source: CMS Payroll-Based Journal report.

Total staff 109
Employees 109
Contractors 0
Staff to resident ratio 1.31 : 1
25% fewer staff per resident than Tennessee average
Tennessee average ratio: 1.75 : 1 Tennessee average ratio: 1.75 : 1See full Tennessee ranking
Avg staff/day 48
Average shift 8.8 hours
6% better than Tennessee average
Tennessee average: 8.3 hours Tennessee average shift: 8.3 hoursSee full Tennessee ranking
Total staff hours (quarter) 38,991

Nursing staff breakdown

Q4 2025 · Oct 1 – Dec 31 More info This data comes from the CMS Payroll-Based Journal report covering October 1 – December 31, 2025.
Registered Nurse

Manages medical care and health needs.

RN Staff Info All 17 RN Staff are full-time employees. No contractors work on this role. 17
Average shift length Info Average shift length. Calculated as total hours divided by days worked and average staff per day. 9.5 hours
Licensed Practical Nurse

Assists with medical care and medications.

LPN Staff Info All 15 LPN Staff are full-time employees. No contractors work on this role. 15
Average shift length Info Average shift length. Calculated as total hours divided by days worked and average staff per day. 9.4 hours
Certified Nursing Assistant

Helps with daily care and mobility.

CNA Staff Info All 48 CNA Staff are full-time employees. No contractors work on this role. 48
Average shift length Info Average shift length. Calculated as total hours divided by days worked and average staff per day. 9.3 hours

Contractor staffing

Q4 2025 · Oct 1 – Dec 31 More info This data comes from the CMS Payroll-Based Journal report covering October 1 – December 31, 2025.
Total hours from contractors 0% — all staff are direct employees this quarter

Staff by category

Q4 2025 · Oct 1 – Dec 31 More info This data comes from the CMS Payroll-Based Journal report covering October 1 – December 31, 2025.
Certified Nursing Assistant4804818,30792100%9.3
Licensed Practical Nurse150157,33792100%9.4
Registered Nurse170173,73792100%9.5
Clinical Nurse Specialist5051,7006672%8.9
Speech Language Pathologist4041,5786874%6.6
Other Dietary Services Staff5051,43392100%7.3
Dental Services Staff3031,2957076%7.5
Physical Therapy Aide3039817177%7.3
Physical Therapy Assistant2028606773%7.1
Nurse Practitioner1015406065%9
Administrator1014966267%8
Qualified Social Worker2023856470%5.9
Respiratory Therapy Technician3033426065%5.6
48 Certified Nursing Assistant
% of Days 100%
15 Licensed Practical Nurse
% of Days 100%
17 Registered Nurse
% of Days 100%
5 Clinical Nurse Specialist
% of Days 72%
4 Speech Language Pathologist
% of Days 74%
5 Other Dietary Services Staff
% of Days 100%
3 Dental Services Staff
% of Days 76%
3 Physical Therapy Aide
% of Days 77%
2 Physical Therapy Assistant
% of Days 73%
1 Nurse Practitioner
% of Days 65%
1 Administrator
% of Days 67%
2 Qualified Social Worker
% of Days 70%
3 Respiratory Therapy Technician
% of Days 65%

Penalties and fines

Includes penalties issued in 2024

Federal penalties imposed by CMS for regulatory violations, including civil money penalties (fines) and denials of payment for new Medicare/Medicaid admissions.

Source: CMS Penalties Database (Data as of Jan 2026)

Total fines amount $15K Rank #134 / 177Federal fines — State benchmarkedThis home is ranked 134th out of 177 homes in Tennessee for federal fines. Shows this facility's cumulative CMS federal fine dollars versus the Tennessee average among facilities with fines, and where it ranks among 177 skilled nursing facilities in the pool. Lower total dollars mean a better rank.Click the rank badge to see the full State ranking.Click here to see the full State ranking.
83% lower than Tennessee average

Tennessee average: $86K

Number of fines 2
15% more fines than Tennessee average

Tennessee average: 1.7

Payment Denials Info Serious action where Medicare and/or Medicaid temporarily stops payments for new residents until issues are fixed. 0
100% fewer payment denials than Tennessee average

Tennessee average: 0.5

Fines amount comparison
This facility $15K
Tennessee average $86K
Penalty History

Penalties are imposed by CMS for violations of federal nursing home regulations.

2 penalties in the past 3 years

Multiple penalties were reported in the last 3 years.

Civil Money Penalty Info Fines imposed for noncompliance, which can be assessed per day or per instance of violation. Sep 26, 2024
$7K
Civil Money Penalty Info Fines imposed for noncompliance, which can be assessed per day or per instance of violation. Sep 26, 2024
$7K

Last updated: Jan 2026

Quality of care over time

These measures show how residents usually do over time at this home, based on health outcomes and preventive care.

High-risk clinical events score Info A composite score based on pressure ulcers, falls with injury, weight loss, walking ability decline, and activities of daily living decline. 10.5
In line with Tennessee average

Tennessee average: 10.5

Functional decline score Info A composite score based on activities of daily living decline, walking ability decline, and incontinence. 24.4
25% worse than Tennessee average

Tennessee average: 19.5

Long-stay resident measures
Above average Info CMS star rating based on long-stay quality measure performance. 5 stars = significantly above average, 1 star = significantly below average.
Need for Help with Daily Activities Increased Info Percent of long-stay residents whose need for help with daily activities has increased 10.6%
34% better than Tennessee average

Tennessee average: 16.0%

Walking Ability Worsened Info Percent of long-stay residents whose ability to move independently worsened 35.5%
63% worse than Tennessee average

Tennessee average: 21.7%

Low Risk Residents with Bowel/Bladder Incontinence Info Percent of low risk long-stay residents who lose control of their bowels or bladder 27.0%
30% worse than Tennessee average

Tennessee average: 20.7%

Falls with Major Injury Info Percent of long-stay residents experiencing one or more falls with major injury 2.4%
35% better than Tennessee average

Tennessee average: 3.7%

High Risk Residents with Pressure Ulcers Info Percent of long-stay high risk residents with pressure ulcers 3.2%
41% better than Tennessee average

Tennessee average: 5.4%

Urinary Tract Infection Info Percent of long-stay residents with a urinary tract infection 1.0%
51% better than Tennessee average

Tennessee average: 2.1%

Lost Too Much Weight Info Percent of long-stay residents who lose too much weight 0.8%
87% better than Tennessee average

Tennessee average: 6.3%

Depressive Symptoms Info Percent of long-stay residents who have depressive symptoms 4.9%
55% better than Tennessee average

Tennessee average: 11.0%

Antipsychotic Use Info Percent of long-stay residents who received an antipsychotic medication 7.3%
56% better than Tennessee average

Tennessee average: 16.5%

Pneumococcal Vaccine Info Percent of long-stay residents assessed and appropriately given the pneumococcal vaccine 100.0%
11% better than Tennessee average

Tennessee average: 89.9%

Influenza Vaccine Info Percent of long-stay residents assessed and appropriately given the seasonal influenza vaccine 100.0%
6% better than Tennessee average

Tennessee average: 94.5%

Hospitalizations per 1,000 days Info Number of hospitalizations per 1,000 long-stay resident days. 0.91
42% better than Tennessee average

Tennessee average: 1.58

ED visits per 1,000 days Info Number of outpatient emergency department visits per 1,000 long-stay resident days. 3.20
104% worse than Tennessee average

Tennessee average: 1.57

Short-stay resident measures
Above average Info CMS star rating based on short-stay quality measure performance. 5 stars = much above average, 1 star = much below average.
Pneumococcal Vaccine Info Percent of short-stay residents assessed and appropriately given the pneumococcal vaccine 99.8%
25% better than Tennessee average

Tennessee average: 79.7%

Antipsychotic medication increase Info Percent of short-stay residents who newly received an antipsychotic medication 1.2%
32% better than Tennessee average

Tennessee average: 1.7%

Influenza Vaccine Info Percent of short-stay residents assessed and appropriately given the seasonal influenza vaccine 100.0%
25% better than Tennessee average

Tennessee average: 79.8%

Re-hospitalized after SNF stay Info Percentage of short-stay residents who were re-hospitalized after their nursing home admission. 17.2%
23% better than Tennessee average

Tennessee average: 22.2%

Emergency department visits Info Percentage of short-stay residents who had an outpatient emergency department visit. 18.2%
63% worse than Tennessee average

Tennessee average: 11.2%

Falls with major injury Info Percentage of SNF residents who experience falls with major injury during their stay. 0.0%
100% better than Tennessee average

Tennessee average: 0.8%

Ability to care for self at discharge Info Percentage of residents at or above expected ability to care for themselves at discharge. 60.6%
13% better than Tennessee average

Tennessee average: 53.7%

Successful return to home or community Info Rate of successful return to home or community from a skilled nursing facility. 50.3%
In line with Tennessee average

Tennessee average: 50.6%

Breakdown by payment type

Medicare

26% of new residents, usually for short-term rehab.

Typical stay 1 - 2 months

Private pay

64% of new residents, often for short stays.

Typical stay 1 - 2 months

Medicaid

10% of new residents, often for long-term daily care.

Typical stay 1 - 2 years

Facility Characteristics

Source: CMS Long-Term Care Facility Characteristics (Data as of Jan 2026)

Total residents 83
Medicare
8
9.6% of residents
Medicaid
52
62.7% of residents
Private pay or other
23
27.7% of residents
Programs & Services
Residents Group

Residents meet regularly to discuss policies, care quality, and activities

Nurse Aide Training

State-approved Nurse Aide Training and Competency Evaluation Program on-site

Active Resident Council

Organized group of residents that meets regularly to discuss facility policies, quality of life, and activities.

Finances and operations

Privately-owned community
Operated by a business corporation.
Home revenue
$15.4M
Profit
$1.1M
Privately-owned community Operated by a business corporation.
Home revenue
$15.4M Rank #62 / 176Revenue — State benchmarkedThis home is ranked 62nd out of 176 homes in Tennessee for revenue. Shows this facility's annual revenue compared to the Tennessee SNF average. Higher revenue generally means more resources for staffing and capital — read alongside Payroll %.Click the rank badge to see the full State ranking.Click here to see the full State ranking.
Profit
$1.1M
Payroll costs Info The portion of the home's budget spent on staff, including nurses, caregivers, and other employees who support care and operations. Rank #88 / 176Payroll — State benchmarkedThis home is ranked 88th out of 176 homes in Tennessee for payroll. Shows total annual staff payroll benchmarked to the Tennessee average. Higher payroll investment relative to peers often signals better staffing and less reliance on cheaper contract labor.Click the rank badge to see the full State ranking.Click here to see the full State ranking.
$5.7M
37.2% of revenue Rank #137 / 176Payroll % — State benchmarkedThis home is ranked 137th out of 176 homes in Tennessee for payroll %. Shows payroll as a percentage of revenue versus the Tennessee average. Well-run Tennessee SNFs typically land around 50–60% — the top third Statewide. Below 25% may signal understaffing or heavy agency use — read with Staffing ratings.Click the rank badge to see the full State ranking.Click here to see the full State ranking.
Other operating costs Info All remaining costs needed to run the home, such as food, utilities, building maintenance, supplies and administrative expenses.
$8.5M
Total costs $14.2M

Who this home usually serves

TYPE OF STAY

Primarily short stays

Residents typically stay for brief periods, with frequent admissions and discharges throughout the year.

Places of interest near Tri State Health and Rehabilitation Center

Address 0.0 miles from city center Info Estimated distance in miles from Harrogate's city center to Tri State Health and Rehabilitation Center's address, calculated via Google Maps.

Calculate Travel Distance to Tri State Health and Rehabilitation Center

Add your location

Address

Financial Assistance for
Nursing Home in Tennessee

Tri State Health and Rehabilitation Center is located in Harrogate, Tennessee.
Here are the financial assistance programs available to residents in Tennessee.

Get Financial aid guidance

CHOICES Program

TN Medicaid CHOICES

Age 65+ or disabled
General Tennessee resident, Medicaid-eligible, nursing home-level care need.
Income Limits (2025) ~$2,829/month 300% FBR, individual
Asset Limits $2,000 (individual), $3,000 (couple).
TN

Managed care model; high rural demand.

Benefits
Personal care (5-7 hours/day) Respite (240 hours/year) Adult day care ($65/day) Home modifications ($1,500 avg.)

Tennessee Options for Community Living

TN Options

Age 60+
General Tennessee resident, at risk of nursing home.
Income Limits ~$2,000/month individual, varies
Asset Limits $5,000 individual
TN

Limited funding; rural/urban balance.

Benefits
In-home care (3-5 hours/week) Respite (up to 10 days/year) Transportation (~5 trips/month)

Medicare Savings Program (MSP)

Tennessee Medicare Savings Program

Age 65+ or disabled
General TN resident, Medicare Part A/B.
Income Limits (2025) ~$2,510/month (QMB), ~$3,380/month (SLMB), ~$3,598/month (QI)—individual.
Asset Limits $9,430 (individual), $14,130 (couple).
TN

Three tiers; includes Extra Help for Part D; no waitlist.

Benefits
Covers Part B premiums ($174.70/month) Deductibles ($240/year) Copays (~20%)

Family Caregiver Support Program (FCSP)

Tennessee Family Caregiver Support Program

Age
General Caregivers of 60+ needing care or 55+ caregivers of others; TN resident; functional needs (2+ ADLs).
Income Limits (2025) No strict cap; prioritizes low-income ~$24,980/year
Asset Limits Not assessed; need-based.
TN

Includes grandparent caregivers; high rural demand.

Benefits
Respite (4-6 hours/week or 5 days/year) Adult day care ($60/day) Training Supplies (~$500/year)

VA Aid and Attendance (A&A) and Housebound Benefits

Tennessee VA Aid and Attendance/Housebound

Age 65+ or disabled veteran/spouse
General TN resident, wartime service, need for ADL help (A&A) or homebound.
Income Limits (2025) Net income < ~$1,984/month (veteran with dependent, A&A); pension offsets income.
Asset Limits ~$155,356 net worth limit
TN

High veteran population; supports rural/urban care needs.

Benefits
Cash (~$1,433-$2,642/month veteran, ~$951-$1,318 spouse) for care costs (e.g., in-home, assisted living)

Elderly Nutrition Program

Tennessee Elderly Nutrition Program

Age 60+
General TN resident; no income limit but prioritizes low-income.
Income Limits (2025) None; donations encouraged.
Asset Limits Not assessed.
TN

Serves ~50,000 annually; 200+ congregate sites plus Meals on Wheels.

Benefits
Congregate meals ($5-$7/meal value) at senior centers Home-delivered meals ($5-$7/meal)

Property Tax Relief Program

Tennessee Property Tax Relief Program

Age 65+
General TN resident, homeowner/renter (or widow/er 50+, disabled 18+).
Income Limits (2025) ~$45,000/year household, excludes half of Social Security
Asset Limits Not assessed; income-focused.
TN

Rebates up to $1,000; serves ~100,000 annually.

Benefits
Tax rebates (~$250-$1,000 based on income; e.g., $1,000 if income < $8,000)

Frequently Asked Questions about Tri State Health and Rehabilitation Center

Who is the owner of Tri State Health and Rehabilitation Center?

The legal owner and operator of Tri State Health and Rehabilitation Center is Raven Lake Healthcare Inc.

Is Tri State Health and Rehabilitation Center in a walkable area?

Tri State Health and Rehabilitation Center has a walk score of 47. Somewhat walkable. A few nearby services may be reachable on foot, but most trips require transportation.

What is the license number of Tri State Health and Rehabilitation Center?

According to TN state health department records, Tri State Health and Rehabilitation Center's license number is 00000038.

When does Tri State Health and Rehabilitation Center's license expire?

According to TN state health department records, Tri State Health and Rehabilitation Center's license expires on August 1, 2026.

Who is the administrator of Tri State Health and Rehabilitation Center?

Magen Ann Smith is the administrator of Tri State Health and Rehabilitation Center.

How many beds does Tri State Health and Rehabilitation Center have?

Tri State Health and Rehabilitation Center has 116 beds.

Are there photos of Tri State Health and Rehabilitation Center?

Yes — there are 20 photos of Tri State Health and Rehabilitation Center in the photo gallery on this page.

Guides for Better Senior Living

Care Cost Calculator: See Prices in Your Area

Nursing Home Data Explorer

Don’t Wait Too Long: 7 Red Flag Signs Your Parent Needs Assisted Living Now

The True Cost of Assisted Living in 2025 – And How Families Are Paying For It

Understanding Senior Living Costs: Pricing Models, Discounts & Financial Assistance

Explore Open Rooms
1 Contact details
2 What type of senior care service are you looking for?
3 What budget do you have in mind for senior care?
4 How soon do you need to find care?
5 Additional details

Thank you for your interest!

Our team will be in touch shortly to help with next steps.