Lapeer County Medical Care
Nursing Home · Lapeer, MI
CMS overall rating Info The Overall CMS Rating is scored from 1 to 5 stars and combines results from health inspections, staffing levels, and quality measures. Health inspections carry the most weight. Staffing and quality scores can increase or decrease the final rating based on performance compared to state and national standards.

Lapeer County Medical Care

Nursing Home · Lapeer, MI
CMS overall rating Info The Overall CMS Rating is scored from 1 to 5 stars and combines results from health inspections, staffing levels, and quality measures. Health inspections carry the most weight. Staffing and quality scores can increase or decrease the final rating based on performance compared to state and national standards.
Calculator: See prices in your area
Lapeer County Medical Care accepts Medicare, Medicaid, and private pay.

Overview of Lapeer County Medical Care

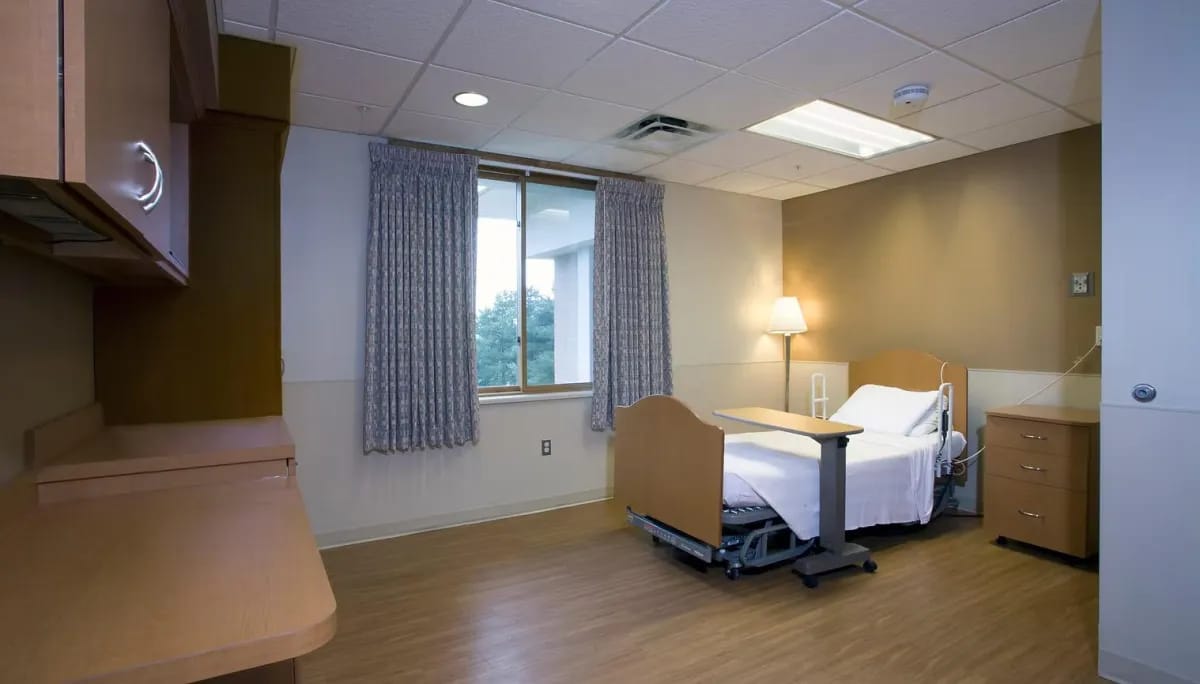
Lapeer County Medical Care is a nursing home in Lapeer, MI, offering long-term care, personal care, hospice, rehabilitation, and skilled nursing. The community’s comfortable, home-like setting ensures older adults have a worry-free stay. With round-the-clock nursing care, well-balanced meals, and comprehensive therapies, residents receive the utmost attention and care. Prioritizing residents’ holistic well-being, exceptional care tailored to their unique needs and habits is also provided.

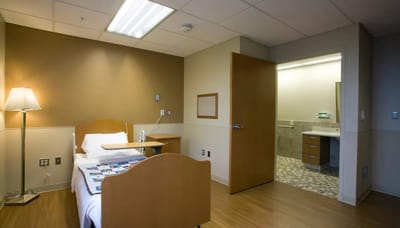
Stretching exercises, social gatherings, and various games ensure residents can live actively and gain meaningful experiences. Spacious common areas and cozy rooms also provide residents with more spaces for interaction and relaxation. Located near McLaren Lapeer Region, a pharmacy, a market, and parks in Lapeer, the community guarantees accessibility and convenience. This nursing home is a trusted choice for senior living in Michigan, especially with excellent services and well-maintained amenities.

(810) 664-8571

Quality ratings

Measured by Centers for Medicare & Medicaid Services (CMS)

Overall rating Info The Overall CMS Rating combines results from health inspections, staffing levels and quality measures. Health inspections carry the most weight. Staffing and quality scores can increase or decrease the final rating based on performance compared to state and national standards.
▼ 4.4% Below MI avg. ▼ 4.4% Below MI avg.Click the badge to see the full State ranking.Click here to see the full State ranking.
Health Inspection Info Based on the results of the facility's three most recent standard inspections and any complaint investigations. CMS reviews the number, scope, and severity of deficiencies, with more recent findings weighted more heavily.
▼ 29.3% Below MI avg. ▼ 29.3% Below MI avg.Click the badge to see the full State ranking.Click here to see the full State ranking.
Staffing Info Measures average nursing staff hours per resident per day, including Registered Nurses (RNs) and total nursing staff. Ratings are adjusted based on the level of care residents require and are compared to state and national benchmarks.
▲ 43.0% Above MI avg. ▲ 43.0% Above MI avg.Click the badge to see the full State ranking.Click here to see the full State ranking.
Quality Measures Info Based on clinical and physical health indicators reported to CMS, such as hospital readmissions, falls, pressure ulcers, and improvements in mobility. These measures reflect how well residents' health needs are being managed.
▼ 20.2% Below MI avg. ▼ 20.2% Below MI avg.Click the badge to see the full State ranking.Click here to see the full State ranking.

Staffing hours breakdown

Info Daily nursing hours per resident by staff type, reported to CMS. Higher is generally better — compare this facility to state and national averages to see where staffing stands.

Hours per resident per day — compared to Michigan state averages

Total nursing care / resident Info This home is ranked 23rd out of 133 homes in Michigan. Total adjusted nursing hours per resident per day, combining RN, LPN, and aide time. CMS adjusts this for case-mix so facilities can be fairly compared.
5h 1m per day
Rank #23 / 133Nurse hours — State benchmarkedThis home is ranked 23rd out of 133 homes in Michigan. Shows adjusted nurse hours per resident per day benchmarked to the Michigan average, with a ranking across 133 Michigan SNFs. More hours mean more direct care. The national average is about 3.5 hrs; below 3.0 is a red flag.Click the rank badge to see the full State ranking.Click here to see the full State ranking.
This facility Michigan avg (4h 18m per day)
vs Michigan avg
+17%
Staff type Hours / Day / Resident vs state avg
Weekend Total Nursing Info Combined nursing hours (RN + LPN + Nurse Aide) per resident per day on weekends. Staffing often drops on weekends — this figure reveals whether the facility maintains adequate coverage outside of weekday hours. 3h 39m per day

Types of Care at Lapeer County Medical Care

Nursing Home

Capacity and availability

This home usually has availability

Occupancy lower than 85% suggests more openings may be available.

Higher occupancy than the Michigan average: 75.8%
Occupancy rate 80.6% Rank #75 / 386Occupancy rate — State benchmarkedThis home is ranked 75th out of 386 homes in Michigan. Shows this facility's occupancy rate versus the Michigan average, with its Statewide rank out of 386. Higher occupancy signals strong local demand and financial stability.Click the rank badge to see the full State ranking.Click here to see the full State ranking.
Avg. Length of Stay 296 days
Occupancy rate
80.6% Rank #75 / 386Occupancy rate — State benchmarkedThis home is ranked 75th out of 386 homes in Michigan. Shows this facility's occupancy rate versus the Michigan average, with its Statewide rank out of 386. Higher occupancy signals strong local demand and financial stability.Click the rank badge to see the full State ranking.Click here to see the full State ranking.
Avg. Length of Stay
296 days
Walk Score
Walk Score: 8 / 100 Rank #620 / 702Walk Score — State benchmarkedThis home is ranked 620th out of 702 homes in Michigan. Shows how walkable this facility's neighborhood is compared to the average Walk Score across Michigan SNFs. Higher scores benefit residents, families, and staff.Click the rank badge to see the full State ranking.Click here to see the full State ranking.
Car-dependent. Most errands require a car, with limited nearby walkable options.

Contact Lapeer County Medical Care

Staffing Data

Reporting period: October 1 – December 31, 2025 (Q4 2025). Source: CMS Payroll-Based Journal report.

Total staff 276
Employees 236
Contractors 40
Staff to resident ratio 1.75:1
0% compared with Michigan average
Michigan average ratio: 1.70:1 Michigan average ratio: 1.70:1See full Michigan ranking
Avg staff/day 109
Average shift 7.7 hours
0% compared with Michigan average
Michigan average: 7.9 hours Michigan average shift: 7.9 hoursSee full Michigan ranking
Total staff hours (quarter) 76,968

Nursing staff breakdown

Q4 2025 · Oct 1 – Dec 31 More info This data comes from the CMS Payroll-Based Journal report covering October 1 – December 31, 2025.
Registered Nurse

Manages medical care and health needs.

RN Staff 35
Average shift length Info Average shift length. Calculated as total hours divided by days worked and average staff per day. 9 hours

No contractors work on this role.

Licensed Practical Nurse

Assists with medical care and medications.

LPN Staff 16
Average shift length Info Average shift length. Calculated as total hours divided by days worked and average staff per day. 9.2 hours

No contractors work on this role.

Certified Nursing Assistant

Helps with daily care and mobility.

CNA Staff 129
Average shift length Info Average shift length. Calculated as total hours divided by days worked and average staff per day. 7.5 hours

No contractors work on this role.

Contractor staffing

Q4 2025 · Oct 1 – Dec 31 More info This data comes from the CMS Payroll-Based Journal report covering October 1 – December 31, 2025.

Total hours from contractors

7.7%

5,888 contractor hours this quarter

Speech Language Pathologist: 11 Physical Therapy Aide: 10 Qualified Social Worker: 7 Physical Therapy Assistant: 6 Respiratory Therapy Technician: 3 Occupational Therapy Aide: 1 Occupational Therapy Assistant: 1 Medical Director: 1

Staff by category

Q4 2025 · Oct 1 – Dec 31 More info This data comes from the CMS Payroll-Based Journal report covering October 1 – December 31, 2025.
Certified Nursing Assistant 129 0 129 42,725 92 100% 7.5
Registered Nurse 35 0 35 9,755 92 100% 9
Licensed Practical Nurse 16 0 16 6,224 92 100% 9.2
Clinical Nurse Specialist 10 0 10 3,596 53 58% 8.3
Physical Therapist 20 0 20 2,689 72 78% 5.5
Other Dietary Services Staff 9 0 9 2,438 71 77% 6.7
Physical Therapy Aide 0 10 10 1,814 72 78% 7.4
Speech Language Pathologist 0 11 11 1,713 71 77% 6.6
Physical Therapy Assistant 0 6 6 1,332 68 74% 7.1
Nurse Aide in Training 8 0 8 964 63 68% 7.1
Mental Health Service Worker 3 0 3 797 51 55% 8.1
Dietitian 2 0 2 717 54 59% 7.9
Respiratory Therapy Technician 0 3 3 476 65 71% 7.3
Administrator 2 0 2 436 51 55% 8.5
Dental Services Staff 1 0 1 396 50 54% 7.9
Nurse Practitioner 1 0 1 344 45 49% 7.6
Occupational Therapy Aide 0 1 1 307 47 51% 6.5
Qualified Social Worker 0 7 7 184 44 48% 3.9
Occupational Therapy Assistant 0 1 1 61 11 12% 5.5
Medical Director 0 1 1 2 2 2% 1
129 Certified Nursing Assistant
% of Days 100%
35 Registered Nurse
% of Days 100%
16 Licensed Practical Nurse
% of Days 100%
10 Clinical Nurse Specialist
% of Days 58%
20 Physical Therapist
% of Days 78%
9 Other Dietary Services Staff
% of Days 77%
10 Physical Therapy Aide
% of Days 78%
11 Speech Language Pathologist
% of Days 77%
6 Physical Therapy Assistant
% of Days 74%
8 Nurse Aide in Training
% of Days 68%
3 Mental Health Service Worker
% of Days 55%
2 Dietitian
% of Days 59%
3 Respiratory Therapy Technician
% of Days 71%
2 Administrator
% of Days 55%
1 Dental Services Staff
% of Days 54%
1 Nurse Practitioner
% of Days 49%
1 Occupational Therapy Aide
% of Days 51%
7 Qualified Social Worker
% of Days 48%
1 Occupational Therapy Assistant
% of Days 12%
1 Medical Director
% of Days 2%

Penalties and fines

Includes penalties issued in 2023

Federal penalties imposed by CMS for regulatory violations, including civil money penalties (fines) and denials of payment for new Medicare/Medicaid admissions.

Source: CMS Penalties Database (Data as of Jan 2026)

Total fines amount $131K Rank #122 / 136Federal fines — State benchmarkedThis home is ranked 122nd out of 136 homes in Michigan. Shows this facility's cumulative CMS federal fine dollars versus the Michigan average among facilities with fines, and where it ranks among 136 skilled nursing facilities in the pool. Lower total dollars mean a better rank.Click the rank badge to see the full State ranking.Click here to see the full State ranking.
72% higher than Michigan average

Michigan average: $76K

Number of fines 2
In line with Michigan average

Michigan average: 2.0

Payment Denials Info Serious action where Medicare and/or Medicaid temporarily stops payments for new residents until issues are fixed. 2
137% more payment denials than Michigan average

Michigan average: 0.8

Fines amount comparison
This facility $131K
Michigan average $76K
Penalty History

Penalties are imposed by CMS for violations of federal nursing home regulations.

2 penalties in the past 3 years

Multiple penalties were reported in the last 3 years.

Civil Money Penalty Info Fines imposed for noncompliance, which can be assessed per day or per instance of violation. Dec 19, 2023
$68K
Payment Denial Info Serious action where Medicare and/or Medicaid temporarily stops payments for new residents until issues are fixed. Dec 19, 2023
3 days

Last updated: Jan 2026

Quality of care over time

These measures show how residents usually do over time at this home, based on health outcomes and preventive care.

High-risk clinical events score Info A composite score based on pressure ulcers, falls with injury, weight loss, walking ability decline, and activities of daily living decline. 10.0
19% worse than Michigan average

Michigan average: 8.4

Functional decline score Info A composite score based on activities of daily living decline, walking ability decline, and incontinence. 22.3
37% worse than Michigan average

Michigan average: 16.3

Long-stay resident measures
Need for Help with Daily Activities Increased Info Percent of long-stay residents whose need for help with daily activities has increased 18.6%
49% worse than Michigan average

Michigan average: 12.5%

Walking Ability Worsened Info Percent of long-stay residents whose ability to move independently worsened 19.0%
24% worse than Michigan average

Michigan average: 15.3%

Low Risk Residents with Bowel/Bladder Incontinence Info Percent of low risk long-stay residents who lose control of their bowels or bladder 29.3%
40% worse than Michigan average

Michigan average: 21.0%

Falls with Major Injury Info Percent of long-stay residents experiencing one or more falls with major injury 3.7%
17% worse than Michigan average

Michigan average: 3.2%

High Risk Residents with Pressure Ulcers Info Percent of long-stay high risk residents with pressure ulcers 4.2%
28% better than Michigan average

Michigan average: 5.7%

Urinary Tract Infection Info Percent of long-stay residents with a urinary tract infection 3.1%
81% worse than Michigan average

Michigan average: 1.7%

Lost Too Much Weight Info Percent of long-stay residents who lose too much weight 4.7%
18% better than Michigan average

Michigan average: 5.7%

Depressive Symptoms Info Percent of long-stay residents who have depressive symptoms 3.9%
In line with Michigan average

Michigan average: 3.9%

Antipsychotic Use Info Percent of long-stay residents who received an antipsychotic medication 12.3%
18% better than Michigan average

Michigan average: 15.0%

Pneumococcal Vaccine Info Percent of long-stay residents assessed and appropriately given the pneumococcal vaccine 99.7%
5% better than Michigan average

Michigan average: 94.9%

Influenza Vaccine Info Percent of long-stay residents assessed and appropriately given the seasonal influenza vaccine 100.0%
5% better than Michigan average

Michigan average: 95.0%

Short-stay resident measures
Pneumococcal Vaccine Info Percent of short-stay residents assessed and appropriately given the pneumococcal vaccine 94.9%
15% better than Michigan average

Michigan average: 82.5%

Antipsychotic medication increase Info Percent of short-stay residents who newly received an antipsychotic medication 0.0%
100% better than Michigan average

Michigan average: 1.4%

Influenza Vaccine Info Percent of short-stay residents assessed and appropriately given the seasonal influenza vaccine 97.6%
23% better than Michigan average

Michigan average: 79.5%

Breakdown by payment type

Medicare

21% of new residents, usually for short-term rehab.

Typical stay 2 - 3 months

Private pay

56% of new residents, often for short stays.

Typical stay 5 - 6 months

Medicaid

23% of new residents, often for long-term daily care.

Typical stay 7 years

Facility Characteristics

Source: CMS Long-Term Care Facility Characteristics (Data as of Jan 2026)

Total residents 158
Medicare
10
6.3% of residents
Medicaid
141
89.2% of residents
Private pay or other
7
4.4% of residents
Programs & Services
Residents Group

Residents meet regularly to discuss policies, care quality, and activities

Active Resident Council

Organized group of residents that meets regularly to discuss facility policies, quality of life, and activities.

Finances and operations

Governmental community
Operated by county authorities.
Home revenue
$30.8M
Surplus of revenue
$170.4K
Governmental community Operated by county authorities.
Home revenue
$30.8M Rank #19 / 134Revenue — State benchmarkedThis home is ranked 19th out of 134 homes in Michigan. Shows this facility's annual revenue compared to the Michigan SNF average. Higher revenue generally means more resources for staffing and capital — read alongside Payroll %.Click the rank badge to see the full State ranking.Click here to see the full State ranking.
Surplus of revenue
$170.4K
Payroll costs Info The portion of the home's budget spent on staff, including nurses, caregivers, and other employees who support care and operations. Rank #3 / 134Payroll — State benchmarkedThis home is ranked 3rd out of 134 homes in Michigan. Shows total annual staff payroll benchmarked to the Michigan average. Higher payroll investment relative to peers often signals better staffing and less reliance on cheaper contract labor.Click the rank badge to see the full State ranking.Click here to see the full State ranking.
$21.8M
70.8% of revenue Rank #6 / 134Payroll % — State benchmarkedThis home is ranked 6th out of 134 homes in Michigan. Shows payroll as a percentage of revenue versus the Michigan average. Well-run Michigan SNFs typically land around 49–59% — the top third Statewide. Below 25% may signal understaffing or heavy agency use — read with Staffing ratings.Click the rank badge to see the full State ranking.Click here to see the full State ranking.
Other operating costs Info All remaining costs needed to run the home, such as food, utilities, building maintenance, supplies and administrative expenses.
$8.8M
Total costs $30.7M

What does this home offer?

Building type icon
Building type icon

Building Type: 3-story

Personal care icon
Personal care icon

Personal Care Assistance

Rehabilitative support icon

Rehabilitative Support

On-site medical care and health services icon

On-site Medical Care and Health Services

Medication Management icon

Medication Management

Who this home usually serves

TYPE OF STAY

Mix of rehab and long-term care

This home supports both short-term rehab and long-term care, with residents staying for a wide range of durations.

Places of interest near Lapeer County Medical Care

Address 2.1 miles from city center Info Estimated distance in miles from Lapeer's city center to Lapeer County Medical Care's address, calculated via Google Maps.

Calculate Travel Distance to Lapeer County Medical Care

Add your location

Address

Financial Assistance for
Nursing Home in Michigan

Lapeer County Medical Care is located in Lapeer, Michigan.
Here are the financial assistance programs available to residents in Michigan.

Get Financial aid guidance

MI Choice Waiver

Michigan Medicaid MI Choice Waiver

Age 65+ or disabled
General Michigan resident, Medicaid- eligible, nursing home-level care need.
Income Limits (2025) ~$2,829/month 300% FBR, individual
Asset Limits $2,000 (individual), $3,000 (couple).
MI

Delivered through regional waiver agents; waitlists possible.

Benefits
Personal care (5-7 hours/day) Respite care (240 hours/year) Home modifications ($1,500 avg.) Adult day care ($65/day)

Home Help Program

Michigan Home Help

Age 65+ or disabled
General Michigan resident, Medicaid- eligible or low-income.
Income Limits ~$1,732/month individual, Medicaid threshold
Asset Limits $2,000 individual
MI

Can hire family caregivers; less intensive than waiver.

Benefits
Personal care (up to 60 hours/month) Homemaker services Respite (varies)

Program of All-Inclusive Care for the Elderly (PACE)

Michigan PACE

Age 55+
General Michigan resident, nursing home-level care need, safe with PACE support.
Income Limits (2025) ~$2,829/month (Medicaid-eligible); private pay option available.
Asset Limits $2,000 (individual), $3,000 (couple).
MI

16 PACE centers (e.g., Ingham, Wayne counties); expanding slowly.

Benefits
Personal care (5-7 hours/day) Medical care Meals Transportation Therapy Respite

Medicare Savings Program (MSP)

Michigan Medicare Savings Program

Age 65+ or disabled
General Michigan resident, Medicare Part A/B.
Income Limits (2025) ~$2,510/month (QMB), ~$3,380/month (SLMB), ~$3,598/month (QI)—individual.
Asset Limits $9,430 (individual), $14,130 (couple).
MI

Three tiers; no waitlist; includes Extra Help for Part D.

Benefits
Covers Part B premiums ($174.70/month) Deductibles ($240/year) Copays (~20%)

National Family Caregiver Support Program (NFCSP) Respite

Michigan NFCSP Respite Care

Age
General Caregivers of 60+ needing care or 55+ caregivers of others; Michigan resident; functional needs (2+ ADLs).
Income Limits (2025) Prioritizes ~$24,980/year (individual); no strict cap.
Asset Limits Not assessed; need-based.
MI

16 AAAs; prioritizes low-income, rural caregivers.

Benefits
Respite (4-6 hours/week or 5 days/year) Adult day care ($60/day) Caregiver training

VA Aid and Attendance (A&A) and Housebound Benefits

Michigan VA Aid and Attendance/Housebound

Age 65+ or disabled veteran/spouse
General Michigan resident, wartime service, need for ADL help (A&A) or homebound.
Income Limits (2025) Net income < ~$1,984/month (veteran with dependent, A&A); pension offsets income.
Asset Limits ~$155,356 net worth limit
MI

High veteran demand in urban/rural areas.

Benefits
Cash (~$1,433-$2,642/month veteran, ~$951-$1,318 spouse) for care costs

Compare Nursing Home around Lapeer

The information below is reported by the Michigan Department of Licensing and Regulatory Affairs (LARA).

3 facilities compared · CMS & MI Dept. of Health data

Filter by care type
Stonegate Health Campus
NH

Nursing Home Licensed facility providing 24/7 skilled nursing care for residents with complex, ongoing medical needs. Staffed by RNs, LPNs, and CNAs. Inspected and star-rated annually by CMS. Accepts Medicare (short-term rehab) and Medicaid (long-term care).

AL

Assisted Living A licensed, long-term care setting for seniors or individuals with disabilities who need help with daily activities — like bathing, dressing, and medication management — but not 24-hour skilled nursing. Offers housing, meals, and around-the-clock support while aiming to maximize resident independence.

IL

Independent Living Lifestyle-focused communities for older adults offering dining, activities, and transportation with minimal personal care. Best for active, independent seniors who want community without medical support.

MC

Memory Care Secured, specialized care for people living with Alzheimer's or dementia. Staff trained in cognitive impairment, with higher staff-to-resident ratios and an environment designed to reduce confusion and wandering risk.

Lapeer 39 82.4% +9% 3.98 -11% -7% $66.4k 47 9.4 3 73 33 Marcus Badia $15.7M $7.8M 49.6% 235661
The Villages of Lapeer
NH

Nursing Home Licensed facility providing 24/7 skilled nursing care for residents with complex, ongoing medical needs. Staffed by RNs, LPNs, and CNAs. Inspected and star-rated annually by CMS. Accepts Medicare (short-term rehab) and Medicaid (long-term care).

AL

Assisted Living A licensed, long-term care setting for seniors or individuals with disabilities who need help with daily activities — like bathing, dressing, and medication management — but not 24-hour skilled nursing. Offers housing, meals, and around-the-clock support while aiming to maximize resident independence.

IL

Independent Living Lifestyle-focused communities for older adults offering dining, activities, and transportation with minimal personal care. Best for active, independent seniors who want community without medical support.

MC

Memory Care Secured, specialized care for people living with Alzheimer's or dementia. Staff trained in cognitive impairment, with higher staff-to-resident ratios and an environment designed to reduce confusion and wandering risk.

Lapeer 87 70.4% -7% 3.90 -24% -9% $0 30 7.5 1 58 76 Jafar Nazeer $7.2M $4.9M 68.1% 235654
Lapeer County Medical Care
NH

Nursing Home Licensed facility providing 24/7 skilled nursing care for residents with complex, ongoing medical needs. Staffed by RNs, LPNs, and CNAs. Inspected and star-rated annually by CMS. Accepts Medicare (short-term rehab) and Medicaid (long-term care).

Lapeer 202 80.6% +6% 5.02 +24% +17% $130.9k 49 9.8 5 159 8 County Of Lapeer $30.8M $21.8M 70.8% 235058

Frequently Asked Questions about Lapeer County Medical Care

Is Lapeer County Medical Care in a walkable area?

Lapeer County Medical Care has a walk score of 8. Car-dependent. Most errands require a car, with limited nearby walkable options.

What is the address of Lapeer County Medical Care?

Lapeer County Medical Care is located at 1455 Suncrest Dr, Lapeer, MI 48446.

What is the phone number of Lapeer County Medical Care?

(810) 664-8571 will put you in contact with the team at Lapeer County Medical Care.

Is Lapeer County Medical Care Medicare or Medicaid certified?

Yes — Lapeer County Medical Care is a CMS-certified provider of Medicare and Medicaid.

Guides for Better Senior Living

Care Cost Calculator: See Prices in Your Area

Nursing Home Data Explorer

Don’t Wait Too Long: 7 Red Flag Signs Your Parent Needs Assisted Living Now

The True Cost of Assisted Living in 2025 – And How Families Are Paying For It

Understanding Senior Living Costs: Pricing Models, Discounts & Financial Assistance

Explore Open Rooms
1 Contact details
2 What type of senior care service are you looking for?
3 What budget do you have in mind for senior care?
4 How soon do you need to find care?
5 Additional details

Thank you for your interest!

Our team will be in touch shortly to help with next steps.