Explore Open Rooms

1 Contact details
2 What type of senior care service are you looking for?
3 What budget do you have in mind for senior care?
4 How soon do you need to find care?
5 Additional details

Thank you for your interest!

Our team will be in touch shortly to help with next steps.

Nursing Home in Fresno

CMS overall rating Info The Overall CMS Rating combines results from health inspections, staffing levels and quality measures. Health inspections carry the most weight. Staffing and quality scores can increase or decrease the final rating based on performance compared to state and national standards.

Fresno Nursing Center

3672 N First St, Fresno, CA 93726 View map
Overview of Fresno Nursing Center

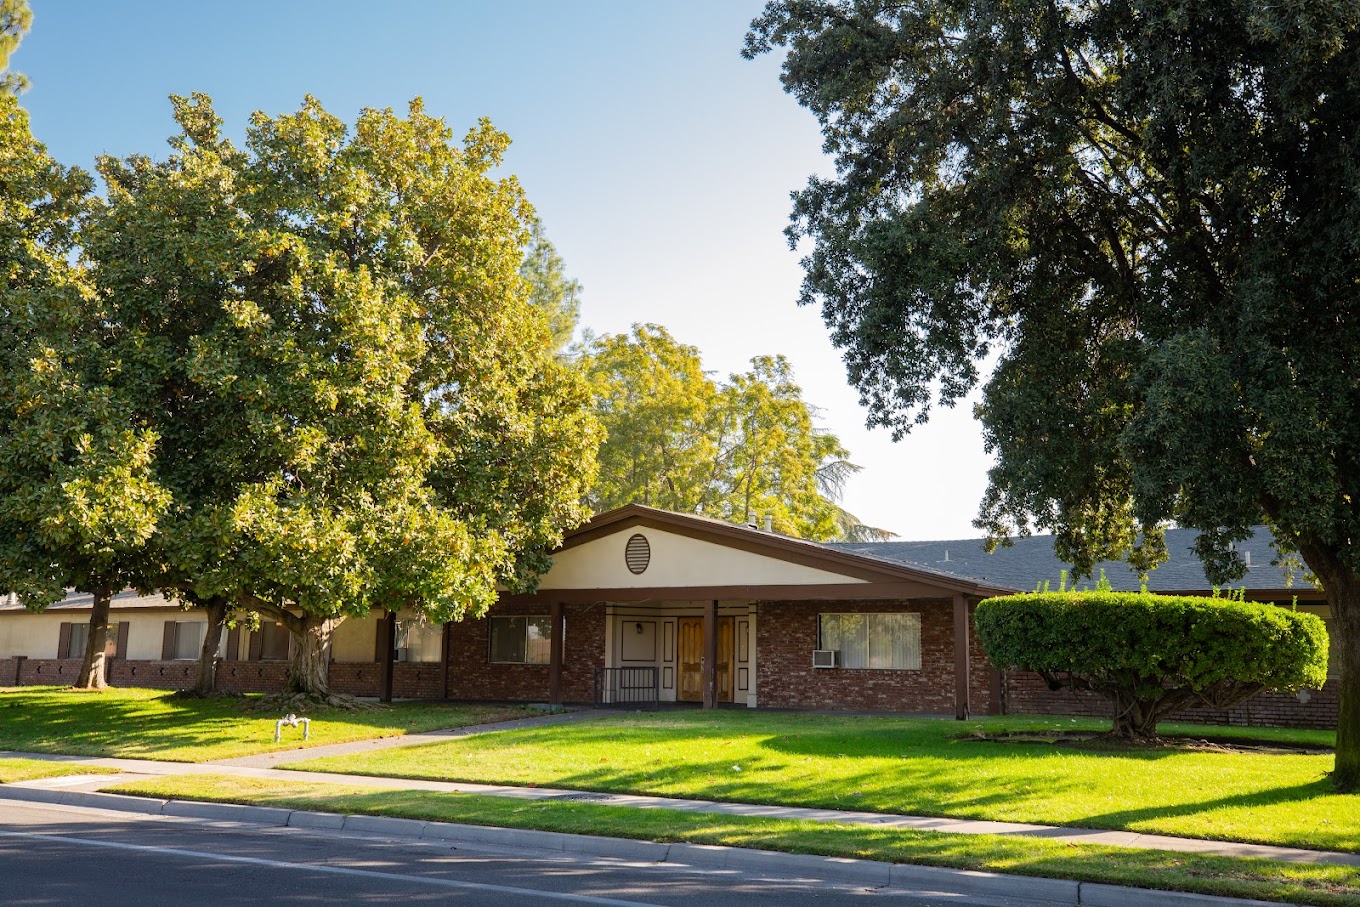
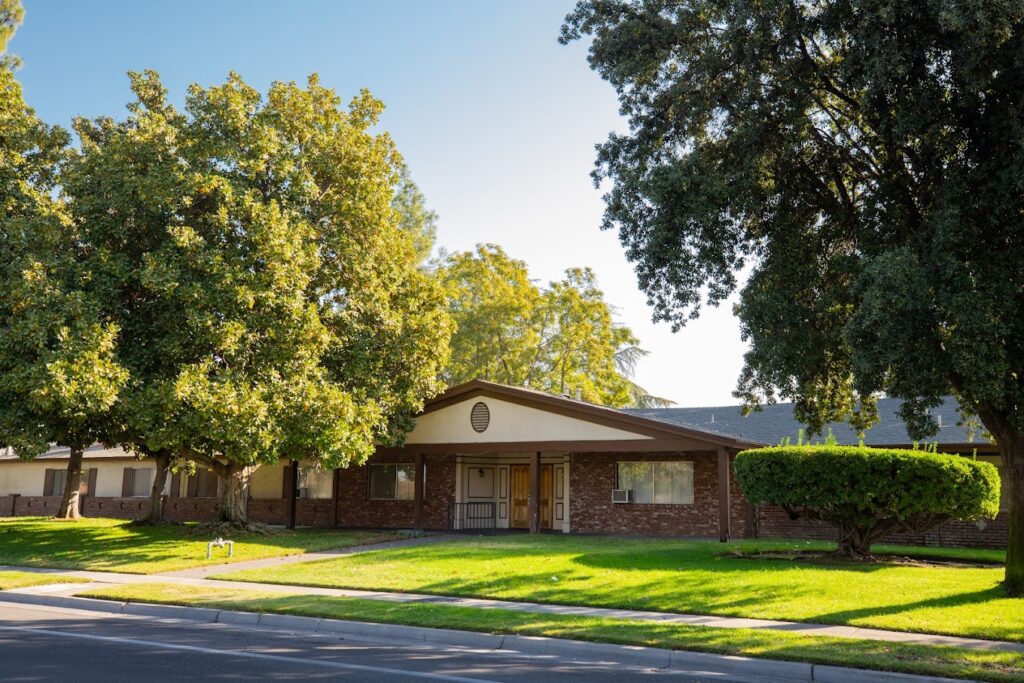
Nestled in Fresno, California, Fresno Nursing Center is dedicated to providing exceptional skilled nursing, short-term rehabilitation, and long-term care services in a compassionate and comfortable environment. With a mission to treat every patient with the utmost care and respect, the center’s team of professionals crafts tailored solutions to ensure each individual receives the best possible service. Recognizing the importance of a healing environment, Fresno Nursing Center surrounds its residents with soothing views and a family-like atmosphere. The center’s holistic approach to care includes customized therapy plans, nutritious meals, and a range of additional services such as pain management, social services, and hospice care.

Amidst the COVID-19 pandemic, Fresno Nursing Center has remained committed to keeping its residents, families, and community informed and safe. Through its comprehensive rehabilitation offerings, including physical, occupational, and speech therapy, the center helps individuals regain their independence and recover from a variety of conditions, including joint replacements, strokes, and cardiac issues. By addressing the unique needs of each patient, Fresno Nursing Center strives to foster a compassionate and supportive environment where healing and well-being can thrive.

(559) 227-5383

Quality ratings

Measured by Centers for Medicare & Medicaid Services (CMS)

Overall rating Info The Overall CMS Rating combines results from health inspections, staffing levels and quality measures. Health inspections carry the most weight. Staffing and quality scores can increase or decrease the final rating based on performance compared to state and national standards.
2/5
California average: 3.1/5
Health Inspection Info Based on the results of the facility's three most recent standard inspections and any complaint investigations. CMS reviews the number, scope, and severity of deficiencies, with more recent findings weighted more heavily.
2/5
California average: 2.8/5
Staffing Info Measures average nursing staff hours per resident per day, including Registered Nurses (RNs) and total nursing staff. Ratings are adjusted based on the level of care residents require and are compared to state and national benchmarks.
2/5
California average: 3.1/5
Quality Measures Info Based on clinical and physical health indicators reported to CMS, such as hospital readmissions, falls, pressure ulcers, and improvements in mobility. These measures reflect how well residents' health needs are being managed.
3/5
California average: 4.1/5

Nursing care per resident

Info This shows how many total hours of nursing staff time are available per resident each day. Higher numbers usually mean more staff support.
3h 58m per day

This home provides 6% less nursing time per resident than the California average.

California average: 4h 13m per day

Capacity and availability

Smaller home

May offer a more intimate, personalized care environment.

Total beds 65

This home is often near full

That suggests steady demand, but availability may be limited.

Higher demand than most homes in California
Occupancy rate 95.3%
Residents per day (avg) 61
Occupancy rate
95.3%
Residents per day (avg)
61

Who this home usually serves

TYPE OF STAY

Mostly short-term rehab stays

Most residents typically stay for a few weeks or months before returning home or moving on.

Might be optimal for
Short stays Recovery Medicare-covered care

Breakdown by payment type

Medicare

66% of new residents, usually for short-term rehab.

Typical stay 1 - 2 months

Private pay

25% of new residents, often for short stays.

Typical stay 28 days

Medicaid

9% of new residents, often for long-term daily care.

Typical stay 3 - 4 years

Finances and operations

Privately-owned community
Operated by a business corporation.
Home revenue
$8.3M
Operating loss
-$375.0K
Privately-owned community Operated by a business corporation.
Home revenue
$8,311,792.00
Operating loss
$-374,978.00
Payroll costs Info The portion of the home's budget spent on staff, including nurses, caregivers, and other employees who support care and operations.
$4.4M
52.9% of revenue
Other operating costs Info All remaining costs needed to run the home, such as food, utilities, building maintenance, supplies and administrative expenses.
$4.3M
Total costs $8.7M
Walk Score
Walk Score: 66 / 100
Moderately walkable. Some errands can be accomplished on foot, with a mix of nearby amenities.

Health Inspection History

Inspections
Total health inspections 11

California average 12.5


Last Health inspection on May 2025

Total health citations 50

California average 50.2

Citations per inspection
4.55

California average 4.65


Health citations are formal notices following inspections when they fail to comply with safety and care standards.

39 of 50 citations resulted from standard inspections; and 11 of 50 resulted from complaint investigations.

Breakdown of citation severity (last 3 years)
Critical Health citations More info 0
100% better than California average

California average: 0.4


Serious Health citations More info 4
300% worse than California average

California average: 1

0 critical citations More info California average: 0.4

4 serious citations More info California average: 1

46 moderate citations More info California average: 47.2

0 minor citations More info California average: 1.5
Citations history (last 3 years)
Administration moderate citation Info Issues related to how the facility is managed, including policies, procedures, and compliance with regulations. May 30, 2025
Corrected

Environmental moderate citation Info Issues related to building safety, cleanliness, maintenance, and overall living conditions. May 30, 2025
Corrected

Infection Control moderate citation Info Issues related to preventing and controlling infections, including hygiene practices and safety protocols. May 30, 2025
Corrected

Nutrition moderate citation Info Issues related to food quality, meal service, and resident's nutritional needs. May 30, 2025
Corrected

Compare Nursing Homes around Fresno The information below is reported by the California Department of Social Services and Department of Public Health.

5 facilities compared · CMS & CA Dept. of Health data · Updated Apr 2026

Filter by care type
North Pointe Care Center
NH

Nursing Home Licensed facility providing 24/7 skilled nursing care for residents with complex, ongoing medical needs. Staffed by RNs, LPNs, and CNAs. Inspected and star-rated annually by CMS. Accepts Medicare (short-term rehab) and Medicaid (long-term care).

Fresno
99
90.6%
+7%
3.61
+8%
-14%
0
21
4.2
0
158
80
North Point Wellness Gp Llc
$13.2M
$4.7M
35.9%
555179
Oakwood Gardens Care Center
AL

Assisted Living A licensed, long-term care setting for seniors or individuals with disabilities who need help with daily activities — like bathing, dressing, and medication management — but not 24-hour skilled nursing. Offers housing, meals, and around-the-clock support while aiming to maximize resident independence.

NH

Nursing Home Licensed facility providing 24/7 skilled nursing care for residents with complex, ongoing medical needs. Staffed by RNs, LPNs, and CNAs. Inspected and star-rated annually by CMS. Accepts Medicare (short-term rehab) and Medicaid (long-term care).

Fresno
-
88.3%
-
3.89
-
-
0
0
0.0
0
95
59
Grossman, Stephen
$20.1M
$6.7M
33.2%
55204
Fresno Nursing Center
NH

Nursing Home Licensed facility providing 24/7 skilled nursing care for residents with complex, ongoing medical needs. Staffed by RNs, LPNs, and CNAs. Inspected and star-rated annually by CMS. Accepts Medicare (short-term rehab) and Medicaid (long-term care).

Fresno (McLane)
65
95.3%
+13%
3.96
-42%
-6%
2
50
4.6
4
61
66
Fresno Nursing And Rehab Center Llc
$8.2M
$4.4M
53.8%
56266
Pacific Gardens Nursing and Rehabilitation
-
AL

Assisted Living A licensed, long-term care setting for seniors or individuals with disabilities who need help with daily activities — like bathing, dressing, and medication management — but not 24-hour skilled nursing. Offers housing, meals, and around-the-clock support while aiming to maximize resident independence.

NH

Nursing Home Licensed facility providing 24/7 skilled nursing care for residents with complex, ongoing medical needs. Staffed by RNs, LPNs, and CNAs. Inspected and star-rated annually by CMS. Accepts Medicare (short-term rehab) and Medicaid (long-term care).

Fresno
-
-
-
-
-
-
-
-
-
0
0
0.0
0
-
43
-
-
-
-
-
Sierra Vista Healthcare Center
-
AL

Assisted Living A licensed, long-term care setting for seniors or individuals with disabilities who need help with daily activities — like bathing, dressing, and medication management — but not 24-hour skilled nursing. Offers housing, meals, and around-the-clock support while aiming to maximize resident independence.

NH

Nursing Home Licensed facility providing 24/7 skilled nursing care for residents with complex, ongoing medical needs. Staffed by RNs, LPNs, and CNAs. Inspected and star-rated annually by CMS. Accepts Medicare (short-term rehab) and Medicaid (long-term care).

Fresno
-
-
-
-
-
-
-
-
-
0
0
0.0
0
-
55
-
-
-
-
-

Places of interest near Fresno Nursing Center

Address 3.3 miles from city center — 0.21 miles to nearest hospital (Fresenius Medical Care at Clovis Community Medical Center)

Address 3672 N First St, Fresno, CA 93726

Calculate Travel Distance to Fresno Nursing Center

Add your location

Address

Staffing Data (Q2 2025)

This data corresponds to Q2 2025 and is based on CMS Payroll-Based Journal.

Total staff 159
Employees 102
Contractors 57
Staff to resident ratio 2.56:1
2564416% better than California average

California average ratio: 0.00:1

Avg staff/day 44
Average shift 7.2 hours
6% worse than California average

California average: 7.7 hours

Total staff hours (quarter) 28,895
Nursing staff breakdown
Registered Nurse

Manages medical care and health needs.

Total count 8
Average shift length Info Average shift length. Calculated as total hours divided by days worked and average staff per day. 8.6 hours

No contractors work on this role.

Licensed Practical Nurse

Assists with medical care and medications.

Total count 38
Average shift length Info Average shift length. Calculated as total hours divided by days worked and average staff per day. 7.6 hours

This role is partially covered by contractors.

Certified Nursing Assistant

Helps with daily care and mobility.

Total count 71
Average shift length Info Average shift length. Calculated as total hours divided by days worked and average staff per day. 7.5 hours

This role is partially covered by contractors.

Contractor staffing

Total hours from contractors

3.2%

913 contractor hours this quarter

Certified Nursing Assistant: 30 Licensed Practical Nurse: 24 Feeding Assistant: 1 Medical Director: 1 Occupational Therapy Assistant: 1
Staff by category
Certified Nursing Assistant41307114,24991100%7.5
Licensed Practical Nurse1424384,42391100%7.6
Registered Nurse8081,7498796%8.6
RN Director of Nursing5051,4986571%8.1
Dental Services Staff3031,3126875%7.8
Speech Language Pathologist6061,1547582%5.6
Physical Therapy Assistant4049607785%6.5
Respiratory Therapy Technician7078277380%5.2
Physical Therapy Aide3037157987%5.9
Dietitian2024225662%7.5
Clinical Nurse Specialist2023204044%8
Other Dietary Services Staff1012485864%4.3
Qualified Activities Professional1012322831%8.3
Qualified Social Worker2022173538%6.2
Administrator1012082629%8
Nurse Practitioner1011602022%8
Occupational Therapy Aide1011042629%4
Medical Director011522629%2
Occupational Therapy Assistant0112433%8
Feeding Assistant011221213%1.8
71 Certified Nursing Assistant
% of Days 100%
38 Licensed Practical Nurse
% of Days 100%
8 Registered Nurse
% of Days 96%
5 RN Director of Nursing
% of Days 71%
3 Dental Services Staff
% of Days 75%
6 Speech Language Pathologist
% of Days 82%
4 Physical Therapy Assistant
% of Days 85%
7 Respiratory Therapy Technician
% of Days 80%
3 Physical Therapy Aide
% of Days 87%
2 Dietitian
% of Days 62%
2 Clinical Nurse Specialist
% of Days 44%
1 Other Dietary Services Staff
% of Days 64%
1 Qualified Activities Professional
% of Days 31%
2 Qualified Social Worker
% of Days 38%
1 Administrator
% of Days 29%
1 Nurse Practitioner
% of Days 22%
1 Occupational Therapy Aide
% of Days 29%
1 Medical Director
% of Days 29%
1 Occupational Therapy Assistant
% of Days 3%
1 Feeding Assistant
% of Days 13%

Facility Characteristics

Source: CMS Long-Term Care Facility Characteristics (Data as of Jan 2026)

Total census
62 residents
Residents by payment source
Medicare
14 residents (22.6%)
Medicaid
46 residents (74.2%)
Private pay or other
2 residents (3.2%)
Programs & Services
Residents' Group

Residents meet regularly to discuss policies, care quality, and activities

Family Member Group

Family members meet regularly to discuss policies, care quality, and activities

Nurse Aide Training

State-approved Nurse Aide Training and Competency Evaluation Program on-site

Active Family Council

Organized group of family members that meets regularly to discuss facility policies, resident care, and activities.

Active Resident Council

Organized group of residents that meets regularly to discuss facility policies, quality of life, and activities.

Quality of care over time

These measures show how residents usually do over time at this home, based on health outcomes and preventive care.

High-risk clinical events score Info A composite score based on pressure ulcers, falls with injury, weight loss, walking ability decline, and activities of daily living decline. 4.9
27% better than California average

California average: 6.6

Functional decline score Info A composite score based on activities of daily living decline, walking ability decline, and incontinence. 8.0
30% better than California average

California average: 11.3

Long-stay resident measures
Need for Help with Daily Activities Increased Info Percent of long-stay residents whose need for help with daily activities has increased 8.7%
22% better than California average

California average: 11.1%

Walking Ability Worsened Info Percent of long-stay residents whose ability to move independently worsened 8.7%
27% better than California average

California average: 12.0%

Low Risk Residents with Bowel/Bladder Incontinence Info Percent of low risk long-stay residents who lose control of their bowels or bladder 6.5%
43% better than California average

California average: 11.3%

Falls with Major Injury Info Percent of long-stay residents experiencing one or more falls with major injury 3.7%
124% worse than California average

California average: 1.7%

High Risk Residents with Pressure Ulcers Info Percent of long-stay high risk residents with pressure ulcers 1.6%
68% better than California average

California average: 5.0%

Urinary Tract Infection Info Percent of long-stay residents with a urinary tract infection 1.4%
14% worse than California average

California average: 1.2%

Lost Too Much Weight Info Percent of long-stay residents who lose too much weight 1.6%
63% better than California average

California average: 4.2%

Depressive Symptoms Info Percent of long-stay residents who have depressive symptoms 1.1%
84% better than California average

California average: 6.7%

Antipsychotic Use Info Percent of long-stay residents who received an antipsychotic medication 12.3%
22% worse than California average

California average: 10.1%

Pneumococcal Vaccine Info Percent of long-stay residents assessed and appropriately given the pneumococcal vaccine 96.7%
In line with California average

California average: 98.5%

Influenza Vaccine Info Percent of long-stay residents assessed and appropriately given the seasonal influenza vaccine 95.2%
In line with California average

California average: 98.2%

Short-stay resident measures
Pneumococcal Vaccine Info Percent of short-stay residents assessed and appropriately given the pneumococcal vaccine 76.1%
19% worse than California average

California average: 94.0%

Antipsychotic medication increase Info Percent of short-stay residents who newly received an antipsychotic medication 0.8%
48% better than California average

California average: 1.5%

Influenza Vaccine Info Percent of short-stay residents assessed and appropriately given the seasonal influenza vaccine 85.5%
8% worse than California average

California average: 93.2%

Penalties and fines

Federal penalties imposed by CMS for regulatory violations, including civil money penalties (fines) and denials of payment for new Medicare/Medicaid admissions.

Source: CMS Penalties Database (Data as of Jan 2026)

Total fines amount $43K
22% lower than California average

California average: $55K

Number of fines 1
58% fewer fines than California average

California average: 2.4

Payment Denials Info Serious action where Medicare and/or Medicaid temporarily stops payments for new residents until issues are fixed. 1
102% more payment denials than California average

California average: 0.5

Fines amount comparison
This facility $43K
California average $55K
Penalty History

Penalties are imposed by CMS for violations of federal nursing home regulations.

Civil Money Penalty Info Fines imposed for noncompliance, which can be assessed per day or per instance of violation. Nov 15, 2023
$43K
Payment Denial Info Serious action where Medicare and/or Medicaid temporarily stops payments for new residents until issues are fixed. Nov 15, 2023
13 days

Last updated: Jan 2026

Guides for Better Senior Living

Care Cost Calculator: See Prices in Your Area

Nursing Home Data Explorer

Don’t Wait Too Long: 7 Red Flag Signs Your Parent Needs Assisted Living Now

The True Cost of Assisted Living in 2025 – And How Families Are Paying For It

Understanding Senior Living Costs: Pricing Models, Discounts & Financial Assistance

Financial Aid for California Seniors

Get financial aid guidance

Multipurpose Senior Services Program

MSSP (Medi-Cal Waiver)

Age 65+, California resident, Medi-Cal eligible, nursing home risk.

~$2,829/month (300% FBR, individual).

$2,000 (individual), $3,000 (couple).

County-managed; waitlists possible.

In-Home Supportive Services (IHSS)

California IHSS

Age 65+, California resident, Medicaid-eligible or low-income.

~$1,732/month (individual, Medi-Cal threshold).

$2,000 (individual).

Can hire family as caregivers.

Multipurpose Senior Services Program (MSSP)

CA MSSP

Age 65+, California resident, Medi-Cal-eligible, nursing home-eligible but community-capable.

~$2,829/month (300% FBR, individual).

$2,000 (individual).

Available in 38 counties; waitlists common.

Property Tax Postponement Program (PTP)

CA PTP

Age 62+, California resident, own and live in home, 40% equity.

~$51,500/year (household, adjusted annually).

Equity-based; no strict asset cap.

Deferred taxes accrue interest (5% as of 2024); repaid upon sale/death.

Assisted Living Waiver (ALW)

CA ALW

Age 65+ or disabled, California resident, Medi-Cal-eligible, nursing home-eligible.

~$2,829/month (300% FBR, individual).

$2,000 (individual).

Available in 15 counties (e.g., LA, Sacramento); waitlists common.

California CARES Program

CA CARES

Caregivers of California residents 60+ needing help with 3+ daily activities; no caregiver age limit.

No strict limit; cost-sharing above ~$2,500/month threshold.

Not applicable; need-based.

High demand in urban areas; complements IHSS respite.

Low-Income Home Energy Assistance Program (LIHEAP)

CA LIHEAP

Age 60+ priority, California resident, low-income, utility/heating need.

~$2,510/month (200% of poverty level, individual).

Not applicable; income-focused.

High demand in inland/coastal extremes; weatherization capped at $5,000/home.

Tour Icon
Planning a tour? Check our touring checklist.
Chat Icon
Thinking of living here? We can help you speak to a current resident