


Hospitalizations per 1,000 days
 Number of hospitalizations per 1,000 long-stay resident days.
1.99
Number of hospitalizations per 1,000 long-stay resident days.
1.99
California average: 2.25
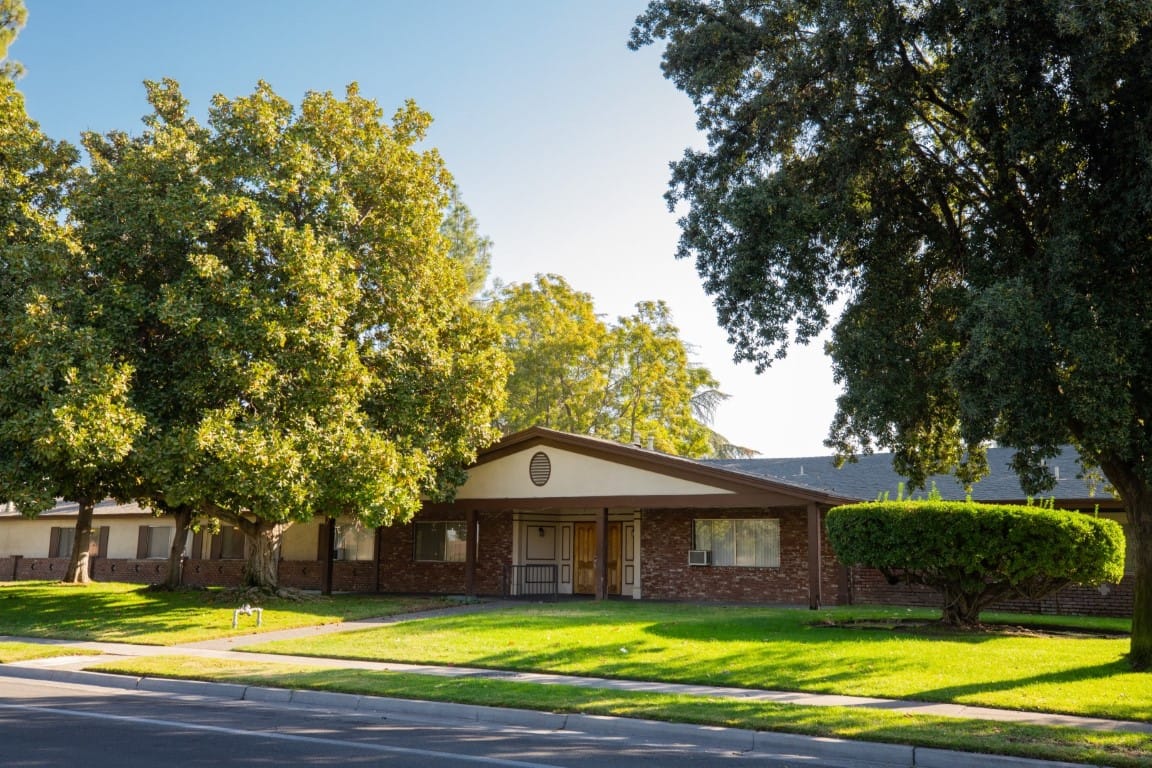
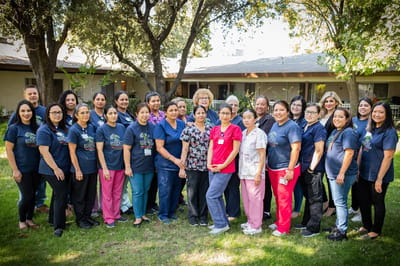
Enjoy comprehensive care from Keystone Post Acute, an esteemed community in Fresno, CA, that offers skilled nursing and rehabilitation. Residents receive top-notch care with a respectful and specially trained team attending to their needs 24/7, ensuring their comfort and safety. Promoting a cozy and nurturing environment, residents keep peace of mind in the community’s purposely built and spacious accommodations.
There’s no need to worry about daily living activities and household responsibilities, with the community handling them. Family members are also encouraged to actively coordinate with the community to stay updated about their loved ones’ care plans. Mealtimes are prepared according to each resident’s dietary needs and preferences, ensuring the finest dining experience. Here, residents experience a worry-free retirement with the community’s state-of-the-art amenities and dedicated services.
| Staff type | Hours / Day / Resident | vs state avg |
|---|---|---|
|
Registered Nurse (RN)
| 18m per day | ▼ 54% State avg: 39m per day · National avg: 41m per day |
|
LPN / LVN
| 1h 14m per day | ■ Avg State avg: 1h 13m per day · National avg: 52m per day |
|
Nurse Aide
| 2h 24m per day | ▼ 9% State avg: 2h 38m per day · National avg: 2h 20m per day |
|
Weekend Total Nursing
| 3h 35m per day | ▼ 12% State avg: 4h 5m per day · National avg: 3h 26m per day |
|
Physical Therapist
| 12m per day | ▲ 140% State avg: 5m per day · National avg: 4m per day |
|
Weekend RN
| 14m per day | ▼ 53% State avg: 30m per day · National avg: 28m per day |
These measures show how residents usually do over time at this home, based on health outcomes and preventive care.
California average: 2.25
California average: 1.59
California average: 23.2%
California average: 11.2%
California average: 0.8%
California average: 53.7%
California average: 50.6%
Quality measures are calculated from Minimum Data Set (MDS) assessments. For most measures, lower percentages indicate better care quality.
No pets allowed
Housing Options: Semi-Private Rooms
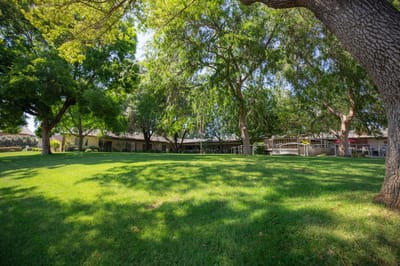
Building Type: Single-story

Health Programs
Recreational Activities
Housekeeping Services
![]() 3.3 miles from city center
3.3 miles from city center
![]() Estimated distance in miles from Fresno's city center to Keystone Post Acute's address, calculated via Google Maps.
Estimated distance in miles from Fresno's city center to Keystone Post Acute's address, calculated via Google Maps.
Add your location
Info below is compiled from CMS reports & the CA Dept. of Social Services (CDSS), senior community websites & trusted data sources such as Walk Score & BBB.
Communities are listed from highest to lowest based on our ranking methodology.
| The Terraces at San Joaquin Gardens a CCRC | NH AL IL MC SNF | Fresno | 652
Facility
652
CA AVG
104
Rank
#9 / 1644 |
57.2%
Facility
57.2%
CA AVG
73.9
Rank
#1230 / 1492 | -23% | 5.21
Facility
5.21
CA AVG
4.22
Rank
#24 / 293 | +27% | +23% | $0
Facility
$0
CA AVG
$56.5k
Rank
#1 / 298 | 88
Facility
88
CA AVG
81
Rank
#513 / 1400 | 32
Facility
32
CA AVG
50.2
Rank
#107 / 293 | 4.6
Facility
4.6
CA AVG
4.6
Rank
#182 / 293 | 1 | 373 | A+ |
57
Facility
57
CA AVG
57
Rank
#1155 / 2087 | Humangood Fresno | $33.9MFiscal year ending 12/2023
Facility
$33.9MFiscal year ending 12/2023
CA AVG
$17.0M
Rank
#25 / 295 | $13.6MFiscal year ending 12/2023
Facility
$13.6MFiscal year ending 12/2023
CA AVG
$7.0M
Rank
#33 / 295 | 40.2%Fiscal year ending 12/2023
Facility
40.2%Fiscal year ending 12/2023
CA AVG
45.2%
Rank
#240 / 295 | 55846 | ||||
| North Pointe Care Center | NH MC RC SNF | Fresno (East Bullard Avenue) | 99
Facility
99
CA AVG
104
Rank
#724 / 1644 |
92.9%
Facility
92.9%
CA AVG
73.9
Rank
#267 / 1492 | +26% | 3.61
Facility
3.61
CA AVG
4.22
Rank
#222 / 293 | +19% | -14% | $0
Facility
$0
CA AVG
$56.5k
Rank
#1 / 298 | - | 21
Facility
21
CA AVG
50.2
Rank
#38 / 293 | 4.2
Facility
4.2
CA AVG
4.6
Rank
#158 / 293 | - | 92 | - |
80
Facility
80
CA AVG
57
Rank
#416 / 2087 | North Point Wellness Gp LLC | $11.0M*Fiscal year ending 10/2022These figures are from this home's most recent complete cost report — an older period than most facilities report. Compare with that in mind.
Facility
$11.0M*Fiscal year ending 10/2022These figures are from this home's most recent complete cost report — an older period than most facilities report. Compare with that in mind.
CA AVG
$17.0M
Rank
#218 / 295 | $6.5M*Fiscal year ending 10/2022These figures are from this home's most recent complete cost report — an older period than most facilities report. Compare with that in mind.
Facility
$6.5M*Fiscal year ending 10/2022These figures are from this home's most recent complete cost report — an older period than most facilities report. Compare with that in mind.
CA AVG
$7.0M
Rank
#205 / 295 | 58.7%*Fiscal year ending 10/2022These figures are from this home's most recent complete cost report — an older period than most facilities report. Compare with that in mind.
Facility
58.7%*Fiscal year ending 10/2022These figures are from this home's most recent complete cost report — an older period than most facilities report. Compare with that in mind.
CA AVG
45.2%
Rank
#82 / 295 | 555179 | ||||
| Evergreen Life Care Homes | NH HOS MC RC SNF | Fresno (Roosevelt) | 49
Facility
49
CA AVG
104
Rank
#1129 / 1644 |
94.3%
Facility
94.3%
CA AVG
73.9
Rank
#229 / 1492 | +28% | 4.36
Facility
4.36
CA AVG
4.22
Rank
#88 / 293 | -27% | +3% | $0
Facility
$0
CA AVG
$56.5k
Rank
#1 / 298 | - | 33
Facility
33
CA AVG
50.2
Rank
#115 / 293 | 3.0
Facility
3.0
CA AVG
4.6
Rank
#55 / 293 | 2 | 46 | A+ |
37
Facility
37
CA AVG
57
Rank
#1600 / 2087 | Evergreen Care Center Holdings LLC | $8.6MFiscal year ending 12/2023
Facility
$8.6MFiscal year ending 12/2023
CA AVG
$17.0M
Rank
#279 / 295 | $2.8MFiscal year ending 12/2023
Facility
$2.8MFiscal year ending 12/2023
CA AVG
$7.0M
Rank
#294 / 295 | 32.6%Fiscal year ending 12/2023
Facility
32.6%Fiscal year ending 12/2023
CA AVG
45.2%
Rank
#219 / 295 | 555920 | ||||
| Horizon Health & Subacute Center | NH SNF | Fresno (East Herndon Avenue) | 180
Facility
180
CA AVG
104
Rank
#210 / 1644 |
85.2%
Facility
85.2%
CA AVG
73.9
Rank
#453 / 1492 | +15% | 4.73
Facility
4.73
CA AVG
4.22
Rank
#56 / 293 | -29% | +12% | $22.9k
Facility
$22.9k
CA AVG
$56.5k
Rank
#226 / 298 | 74
Facility
74
CA AVG
81
Rank
#998 / 1400 | 43
Facility
43
CA AVG
50.2
Rank
#157 / 293 | 3.1
Facility
3.1
CA AVG
4.6
Rank
#66 / 293 | 2 | 153 | - |
58
Facility
58
CA AVG
57
Rank
#1126 / 2087 | Chad Galley | $17.2M*Fiscal year ending 03/2022These figures are from this home's most recent complete cost report — an older period than most facilities report. Compare with that in mind.
Facility
$17.2M*Fiscal year ending 03/2022These figures are from this home's most recent complete cost report — an older period than most facilities report. Compare with that in mind.
CA AVG
$17.0M
Rank
#137 / 295 | $10.3M*Fiscal year ending 03/2022These figures are from this home's most recent complete cost report — an older period than most facilities report. Compare with that in mind.
Facility
$10.3M*Fiscal year ending 03/2022These figures are from this home's most recent complete cost report — an older period than most facilities report. Compare with that in mind.
CA AVG
$7.0M
Rank
#73 / 295 | 60%*Fiscal year ending 03/2022These figures are from this home's most recent complete cost report — an older period than most facilities report. Compare with that in mind.
Facility
60%*Fiscal year ending 03/2022These figures are from this home's most recent complete cost report — an older period than most facilities report. Compare with that in mind.
CA AVG
45.2%
Rank
#32 / 295 | 55199 |
Keystone Post Acute is located in Fresno, California.
Here are the financial assistance programs available to residents in California.
Keystone Post Acute is in the McLane neighborhood.
Keystone Post Acute has a walk score of 66. Moderately walkable. Some errands can be accomplished on foot, with a mix of nearby amenities.
No, Keystone Post Acute has a no-pet policy.
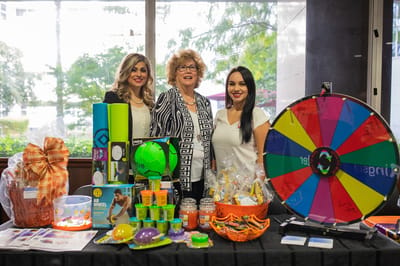
Yes — there are 4 photos of Keystone Post Acute in the photo gallery on this page.
Keystone Post Acute is located at 3672 N First St, Fresno, CA 93726.
(559) 227-5383 will put you in contact with the team at Keystone Post Acute.
Keystone Post Acute is not currently listed as a CMS-certified provider of Medicare or Medicaid.
Care Cost Calculator: See Prices in Your Area
Nursing Home Data Explorer
Don’t Wait Too Long: 7 Red Flag Signs Your Parent Needs Assisted Living Now
The True Cost of Assisted Living in 2025 – And How Families Are Paying For It
Understanding Senior Living Costs: Pricing Models, Discounts & Financial Assistance


