North Pointe Care Center
Nursing Home, Memory Care & Respite Care · Fresno, CA
CMS overall rating Info CMS (the Centers for Medicare & Medicaid Services) is the federal agency that rates nursing home quality. Its Overall Rating runs from 1 to 5 stars, combining health inspections, staffing, and quality measures, with inspections weighted most heavily.

North Pointe Care Center

Nursing Home, Memory Care & Respite Care · Fresno, CA
CMS overall rating Info CMS (the Centers for Medicare & Medicaid Services) is the federal agency that rates nursing home quality. Its Overall Rating runs from 1 to 5 stars, combining health inspections, staffing, and quality measures, with inspections weighted most heavily.
Calculator: See prices in your area
North Pointe Care Center accepts Medicare, Medicaid, and private pay.

Overview of North Pointe Care Center

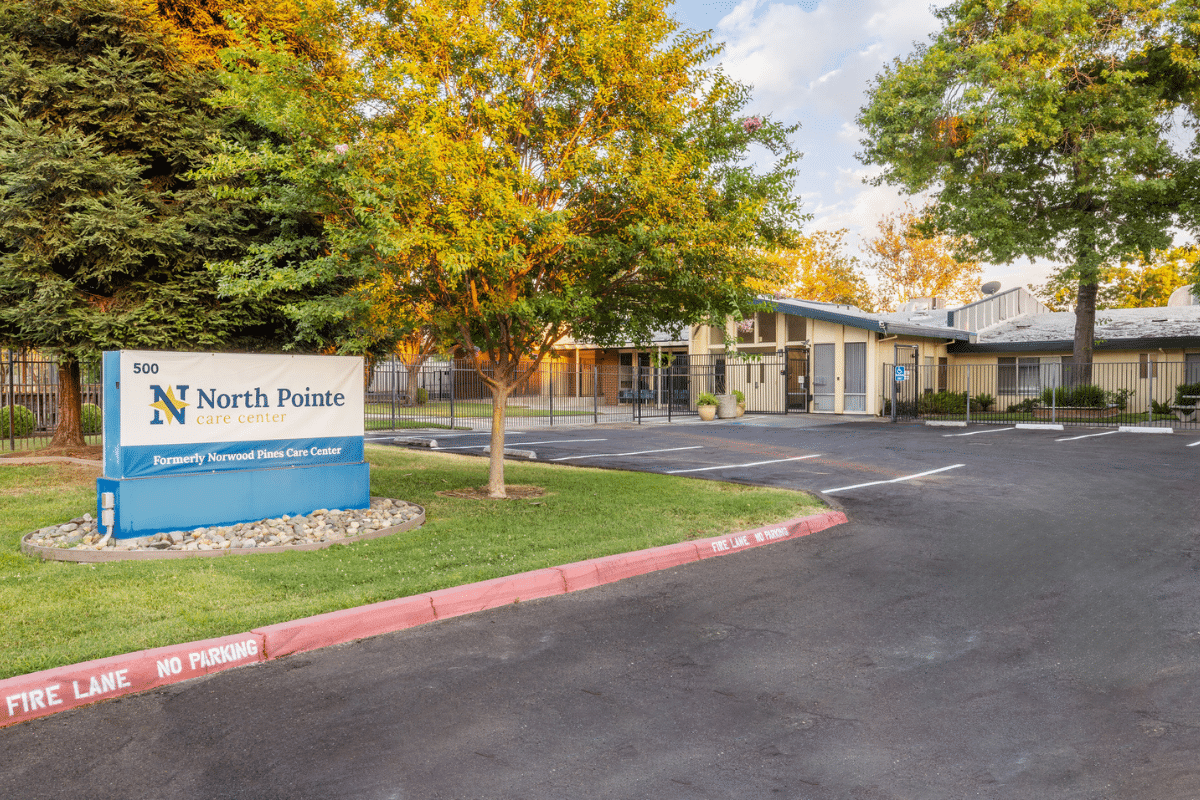
North Pointe Care Center, a 99-bed skilled nursing facility at 668 East Bullard Avenue in East Fresno, is privately operated by North Point Wellness Group LLC and certified for both Medicare and Medicaid. The community’s census and payer mix reveal a facility organized around short-term post-acute rehabilitation: 79% of its 253 admissions arrive under Medicare for typical 16-day stays, with smaller populations of private-pay short-term residents and Medicaid long-term patients.

The facility’s inspection and quality profile presents a mixed picture. Its health inspection rating, 78.8% above California average, stands as a compelling regulatory strength, backed by a clean three-year penalty record.

Its 4-star quality measures rating reflects notably strong outcomes for long-stay residents: hospitalization rates 48% lower than state average, urinary tract infection rates 44% lower, and fall-related injuries at roughly half the state rate. But short-stay discharge outcomes tell a different story. Residents leaving after brief rehabilitation stays show re-hospitalization rates 28% worse than the state average (29.8% vs. 23.2%), and emergency department visit rates 39% worse (15.6% vs. 11.2%), a signal of potential care gaps or inadequate post-discharge support for the rehab population.

Staffing metrics compound this concern. All six nursing staffing categories run below state average, with a staff-to-resident ratio of 1.28:1, 29% below the California norm, and LPN hours at roughly half the state average (50 minutes vs. 1 hour 13 minutes). Occupancy is high at 88.8%, well above state average, with strong financial demand masking an operating loss of $807,400.

The facility is well-positioned for Medicare short-stay rehabilitation in a walkable, accessible location, though the staffing profile and elevated short-stay discharge acuity warrant direct evaluation of care continuity planning.

Quality ratings

Measured by Centers for Medicare & Medicaid Services (CMS)

Overall rating Info The Overall CMS Rating combines results from health inspections, staffing levels and quality measures. Health inspections carry the most weight. Staffing and quality scores can increase or decrease the final rating based on performance compared to state and national standards.
▲ 58.8% Above CA avg. ▲ 58.8% Above CA avg.CA average: 3.1Click the badge to see the full State ranking.Click here to see the full State ranking.
Health Inspection Info Based on the results of the facility's three most recent standard inspections and any complaint investigations. CMS reviews the number, scope, and severity of deficiencies, with more recent findings weighted more heavily.
▲ 78.8% Above CA avg. ▲ 78.8% Above CA avg.CA average: 2.8Click the badge to see the full State ranking.Click here to see the full State ranking.
Staffing Info Measures average nursing staff hours per resident per day, including Registered Nurses (RNs) and total nursing staff. Ratings are adjusted based on the level of care residents require and are compared to state and national benchmarks.
▼ 68.1% Below CA avg. ▼ 68.1% Below CA avg.CA average: 3.1Click the badge to see the full State ranking.Click here to see the full State ranking.
Quality Measures Info Based on clinical and physical health indicators reported to CMS, such as hospital readmissions, falls, pressure ulcers, and improvements in mobility. These measures reflect how well residents' health needs are being managed.
▲ 22.4% Above CA avg. ▲ 22.4% Above CA avg.CA average: 4.1Click the badge to see the full State ranking.Click here to see the full State ranking.

Staffing hours breakdown

Info Daily nursing hours per resident by staff type, reported to CMS. Higher is generally better — compare this facility to state and national averages to see where staffing stands.

Hours per resident per day — compared to California state averages

Total nursing care / resident Info This home is ranked 269th out of 354 homes in California for nurse hours. Total adjusted nursing hours per resident per day, combining RN, LPN, and aide time. CMS adjusts this for case-mix so facilities can be fairly compared.
3h 37m per day
Rank #269 / 354Nurse hours — State benchmarkedThis home is ranked 269th out of 354 homes in California. Shows adjusted nurse hours per resident per day benchmarked to the California average, with a ranking across 354 California facilities. More hours mean more direct care. The national average is about 3.5 hrs; below 3.0 is a red flag.Rankings are based only on facilities in California that report data for that category. Facilities without available data are excluded from the ranking.Click the rank badge to see the full State ranking.Click here to see the full State ranking.
This facility California avg (4h 13m per day)
vs California avg
-14%

6 of 6 metrics below state avg

Staff typeHours / Day / Residentvs state avg
Registered Nurse (RN) Info RNs hold the highest nursing license and can assess residents, interpret test results, and direct care plans. More RN hours per day often signals stronger clinical oversight and faster response to health changes. 36m per day ▼ 8% State avg: 39m per day · National avg: 41m per day
LPN / LVN Info Licensed Practical Nurses (LPNs) or Licensed Vocational Nurses (LVNs) deliver routine hands-on care — medication administration, wound dressing, and monitoring vital signs. They work under RN supervision and make up a large share of daily bedside care. 50m per day ▼ 32% State avg: 1h 13m per day · National avg: 52m per day
Nurse Aide Info Certified Nurse Aides (CNAs) provide the most direct day-to-day assistance: bathing, dressing, feeding, and mobility. Nurse aide hours are typically the largest staffing category and directly affect residents' quality of life. 2h 30m per day ▼ 6% State avg: 2h 39m per day · National avg: 2h 21m per day
Weekend Total Nursing Info Combined nursing hours (RN + LPN + Nurse Aide) per resident per day on weekends. Staffing often drops on weekends — this figure reveals whether the facility maintains adequate coverage outside of weekday hours. 3h 36m per day ▼ 12% State avg: 4h 5m per day · National avg: 3h 26m per day
Physical Therapist Info Hours per resident per day provided by licensed Physical Therapists (PTs) or PT Assistants. PT services help residents recover mobility after injury or illness and are especially important for post-acute (short-stay) rehabilitation. 4m per day ▼ 20% State avg: 5m per day · National avg: 4m per day
Weekend RN Info Registered nurse hours specifically on weekends. Facilities sometimes reduce RN presence on Saturdays and Sundays — a low weekend RN figure compared to weekday hours can indicate reduced clinical oversight when most administrative staff are absent. 29m per day ▼ 3% State avg: 30m per day · National avg: 29m per day

Capacity and availability

This home usually has limited availability

Higher occupancy than the California average: 84.7%
Occupancy rate
88.8% Rank #358 / 1537Occupancy rate — State benchmarkedThis home is ranked 358th out of 1537 homes in California. Shows this facility's occupancy rate versus the California average, with its Statewide rank out of 1537. Higher occupancy signals strong local demand and financial stability.Rankings are based only on facilities in California that report data for that category. Facilities without available data are excluded from the ranking.Click the rank badge to see the full State ranking.Click here to see the full State ranking.
Avg. Length of Stay
102 days
Bed community size
99-bed community Rank #725 / 1657Bed count — State benchmarkedThis home is ranked 725th out of 1657 homes in California. Shows this facility's certified or reported bed count compared to other California facilities. Larger communities may offer more amenities, programs, and on-site services for residents and families.Rankings are based only on facilities in California that report data for that category. Facilities without available data are excluded from the ranking.Click the rank badge to see the full State ranking.Click here to see the full State ranking.
A larger shared setting that may offer more common spaces and organized community services.
Walk Score
Walk Score: 80 / 100 Rank #417 / 2092Walk Score — State benchmarkedThis home is ranked 417th out of 2092 homes in California. Shows how walkable this facility's neighborhood is compared to the average Walk Score across California facilities. Higher scores benefit residents, families, and staff.Rankings are based only on facilities in California that report data for that category. Facilities without available data are excluded from the ranking.Click the rank badge to see the full State ranking.Click here to see the full State ranking.
Very walkable. Most errands can be accomplished on foot, and many essentials are within a short walk.

About this community

Awards

4-Star Quality Measures Medicare Rating

Therapy & Rehabilitation

2 services
Rehabilitation Services
Short-Term Rehab

Additional Services

1 service
Short-Term Rehabilitation

Amenities & Lifestyle

Activities

Contact North Pointe Care Center

Staffing Data

Reporting period: July 1 – September 30, 2025 (Q3 2025). Source: CMS Payroll-Based Journal report.

Total staff 123
Employees 123
Contractors 0
Staff to resident ratio 1.28 : 1
29% fewer staff per resident than California average
California average ratio: 1.81 : 1 California average ratio: 1.81 : 1See full California ranking
Avg staff/day 57
Average shift 7.5 hours
0% compared with California average
California average: 7.7 hours California average shift: 7.7 hoursSee full California ranking
Total staff hours (quarter) 39,107

Nursing staff breakdown

Q3 2025 · Jul 1 – Sep 30 More info This data comes from the CMS Payroll-Based Journal report covering July 1 – September 30, 2025.
Registered Nurse

Manages medical care and health needs.

RN Staff Info All 13 RN Staff are full-time employees. No contractors work on this role. 13
Average shift length Info Average shift length. Calculated as total hours divided by days worked and average staff per day. 8 hours
Licensed Practical Nurse

Assists with medical care and medications.

LPN Staff Info All 15 LPN Staff are full-time employees. No contractors work on this role. 15
Average shift length Info Average shift length. Calculated as total hours divided by days worked and average staff per day. 7.7 hours
Certified Nursing Assistant

Helps with daily care and mobility.

CNA Staff Info All 72 CNA Staff are full-time employees. No contractors work on this role. 72
Average shift length Info Average shift length. Calculated as total hours divided by days worked and average staff per day. 7.3 hours

Contractor staffing

Q3 2025 · Jul 1 – Sep 30 More info This data comes from the CMS Payroll-Based Journal report covering July 1 – September 30, 2025.
Total hours from contractors 0% — all staff are direct employees this quarter

Staff by category

Q3 2025 · Jul 1 – Sep 30 More info This data comes from the CMS Payroll-Based Journal report covering July 1 – September 30, 2025.
Certified Nursing Assistant7207221,28292100%7.3
Licensed Practical Nurse150155,71692100%7.7
Registered Nurse130134,28292100%8
RN Director of Nursing3031,3266773%8
Physical Therapy Aide4041,2846672%7.1
Speech Language Pathologist4041,2288188%6.5
Other Dietary Services Staff20270892100%7.3
Respiratory Therapy Technician1015126470%8
Administrator1015046368%8
Clinical Nurse Specialist1014695964%7.9
Dietitian1014646065%7.7
Mental Health Service Worker1014095964%6.9
Nurse Practitioner1013764751%8
Dental Services Staff1013535155%6.9
Qualified Social Worker2021874043%4.4
Physical Therapy Assistant101922%4.7
72 Certified Nursing Assistant
% of Days 100%
15 Licensed Practical Nurse
% of Days 100%
13 Registered Nurse
% of Days 100%
3 RN Director of Nursing
% of Days 73%
4 Physical Therapy Aide
% of Days 72%
4 Speech Language Pathologist
% of Days 88%
2 Other Dietary Services Staff
% of Days 100%
1 Respiratory Therapy Technician
% of Days 70%
1 Administrator
% of Days 68%
1 Clinical Nurse Specialist
% of Days 64%
1 Dietitian
% of Days 65%
1 Mental Health Service Worker
% of Days 64%
1 Nurse Practitioner
% of Days 51%
1 Dental Services Staff
% of Days 55%
2 Qualified Social Worker
% of Days 43%
1 Physical Therapy Assistant
% of Days 2%

Penalties and fines

Federal penalties imposed by CMS for regulatory violations, including civil money penalties (fines) and denials of payment for new Medicare/Medicaid admissions.

Source: CMS Penalties Database

No penalties in the past 3 years

No civil money penalties or payment denials were reported in the last 3 years.

Quality of care over time

These measures show how residents usually do over time at this home, based on health outcomes and preventive care.

High-risk clinical events score Info A composite score based on pressure ulcers, falls with injury, weight loss, walking ability decline, and activities of daily living decline. 4.4
34% better than California average

California average: 6.6

Functional decline score Info A composite score based on activities of daily living decline, walking ability decline, and incontinence. 7.4
35% better than California average

California average: 11.3

Long-stay resident measures
Significantly above average California avg: 4.2 Info CMS star rating based on long-stay quality measure performance. 5 stars = significantly above average, 1 star = significantly below average.
Need for Help with Daily Activities Increased Info Percent of long-stay residents whose need for help with daily activities has increased 4.4%
60% better than California average

California average: 11.1%

Walking Ability Worsened Info Percent of long-stay residents whose ability to move independently worsened 9.0%
25% better than California average

California average: 12.0%

Low Risk Residents with Bowel/Bladder Incontinence Info Percent of low risk long-stay residents who lose control of their bowels or bladder 8.8%
22% better than California average

California average: 11.3%

Falls with Major Injury Info Percent of long-stay residents experiencing one or more falls with major injury 1.1%
37% better than California average

California average: 1.7%

High Risk Residents with Pressure Ulcers Info Percent of long-stay high risk residents with pressure ulcers 3.5%
29% better than California average

California average: 5.0%

Urinary Tract Infection Info Percent of long-stay residents with a urinary tract infection 0.7%
44% better than California average

California average: 1.2%

Lost Too Much Weight Info Percent of long-stay residents who lose too much weight 4.0%
In line with California average

California average: 4.2%

Depressive Symptoms Info Percent of long-stay residents who have depressive symptoms 1.5%
78% better than California average

California average: 6.7%

Antipsychotic Use Info Percent of long-stay residents who received an antipsychotic medication 10.0%
In line with California average

California average: 10.1%

Pneumococcal Vaccine Info Percent of long-stay residents assessed and appropriately given the pneumococcal vaccine 100.0%
In line with California average

California average: 98.5%

Influenza Vaccine Info Percent of long-stay residents assessed and appropriately given the seasonal influenza vaccine 100.0%
In line with California average

California average: 98.2%

Hospitalizations per 1,000 days Info Number of hospitalizations per 1,000 long-stay resident days. 1.18
48% better than California average

California average: 2.25

ED visits per 1,000 days Info Number of outpatient emergency department visits per 1,000 long-stay resident days. 1.28
19% better than California average

California average: 1.59

Short-stay resident measures
Average California avg: 3.5 Info CMS star rating based on short-stay quality measure performance. 5 stars = much above average, 1 star = much below average.
Pneumococcal Vaccine Info Percent of short-stay residents assessed and appropriately given the pneumococcal vaccine 99.1%
5% better than California average

California average: 94.0%

Antipsychotic medication increase Info Percent of short-stay residents who newly received an antipsychotic medication 0.0%
100% better than California average

California average: 1.5%

Influenza Vaccine Info Percent of short-stay residents assessed and appropriately given the seasonal influenza vaccine 98.5%
6% better than California average

California average: 93.2%

Re-hospitalized after SNF stay Info Percentage of short-stay residents who were re-hospitalized after their nursing home admission. 29.8%
28% worse than California average

California average: 23.2%

Emergency department visits Info Percentage of short-stay residents who had an outpatient emergency department visit. 15.6%
39% worse than California average

California average: 11.2%

Falls with major injury Info Percentage of SNF residents who experience falls with major injury during their stay. 0.0%
100% better than California average

California average: 0.8%

Ability to care for self at discharge Info Percentage of residents at or above expected ability to care for themselves at discharge. 67.0%
25% better than California average

California average: 53.7%

Successful return to home or community Info Rate of successful return to home or community from a skilled nursing facility. 50.8%
In line with California average

California average: 50.6%

Breakdown by payment type

Medicare

79% of new residents, usually for short-term rehab.

Typical stay 16 days

Private pay

13% of new residents, often for short stays.

Typical stay 5 - 6 months

Medicaid

8% of new residents, often for long-term daily care.

Typical stay 2 years

Facility Characteristics

Source: CMS Long-Term Care Facility Characteristics (Data as of Jan 2026)

Total residents 96
Medicare
13
13.5% of residents
Medicaid
5
5.2% of residents
Private pay or other
78
81.3% of residents
Programs & Services
Residents Group

Residents meet regularly to discuss policies, care quality, and activities

Active Resident Council

Organized group of residents that meets regularly to discuss facility policies, quality of life, and activities.

Finances and operations

Based on CMS SNF Cost Report for fiscal year ending in 10/2023.

For-profit
Operated by a business corporation.
Net patient revenue Info Net patient revenue — what the home actually collects for resident care, after contractual allowances, bad debt and discounts are subtracted from its gross charges (CMS cost report, Worksheet G-3). It covers resident care only; money the home earns from other sources is shown separately as "Other income."
$8.5M
Net patient income Info Net patient income: net patient revenue minus the home's total operating expenses. A positive figure means it earns more from resident care than it spends to deliver it; a negative figure means the opposite. It excludes non-operating "other income."
-$938.6K
For-profit Operated by a business corporation.
Net patient revenue Info Net patient revenue — what the home actually collects for resident care, after contractual allowances, bad debt and discounts are subtracted from its gross charges (CMS cost report, Worksheet G-3). It covers resident care only; money the home earns from other sources is shown separately as "Other income."
$8.5M Rank #239 / 355Revenue — State benchmarkedThis home is ranked 239th out of 355 homes in California. Shows this facility's annual revenue compared to the California average. Higher revenue generally means more resources for staffing and capital — read alongside Payroll %.Rankings are based only on facilities in California that report data for that category. Facilities without available data are excluded from the ranking.Click the rank badge to see the full State ranking.Click here to see the full State ranking.
Net patient income Info Net patient income: net patient revenue minus the home's total operating expenses. A positive figure means it earns more from resident care than it spends to deliver it; a negative figure means the opposite. It excludes non-operating "other income."
-$938.6K
Other income Info Money the home earns outside of resident care — such as investments, grants, rentals and other non-operating sources (CMS cost report, Worksheet G-3). It is tracked separately from net patient revenue: it is not part of that figure, and it is not included in net patient income.
$131.2K
Payroll costs Info Staff salaries plus wage-related costs — benefits such as payroll taxes, health insurance and retirement — from the home's own accounting records (CMS cost report, Worksheet A). Contract or agency labor is counted separately, under other operating costs. Rank #261 / 355Payroll — State benchmarkedThis home is ranked 261st out of 355 homes in California. Shows total annual staff payroll benchmarked to the California average. Higher payroll investment relative to peers often signals better staffing and less reliance on cheaper contract labor.Rankings are based only on facilities in California that report data for that category. Facilities without available data are excluded from the ranking.Click the rank badge to see the full State ranking.Click here to see the full State ranking.
$5.5M 64.7% of net patient revenue Info Payroll as a share of revenue: staff salaries and wage-related benefits divided by net patient revenue. A higher figure means more of each revenue dollar goes to staff pay. Rank #227 / 355Payroll % — State benchmarkedThis home is ranked 227th out of 355 homes in California. Shows payroll as a percentage of revenue versus the California average. Well-run California facilities typically land around 55–67% — the top third Statewide. Below 25% may signal understaffing or heavy agency use — read with Staffing ratings.Rankings are based only on facilities in California that report data for that category. Facilities without available data are excluded from the ranking.Click the rank badge to see the full State ranking.Click here to see the full State ranking.
Other operating costs Info Everything it costs to run the home apart from payroll — food, utilities, supplies, maintenance, contract labor and administration. Calculated as total operating expense minus payroll (staff salaries and wage-related benefits).
$4.0M
Total costs Info The home's total operating expense for the year — all the costs of running it, salaries included (CMS cost report, Worksheet G-3).
$9.5M

What does this home offer?

Who this home usually serves

TYPE OF STAY

Mostly short-term rehab stays

Most residents typically stay for a few weeks or months before returning home or moving on.

Most new residents arrive under Medicare (79% of admissions), and a typical Medicare stay runs around 16 days.

Admissions
253 total

Coverage residents most often arrive under.

Medicare 79%
Private pay 13%
Medicaid 8%
Discharges
243 total

Coverage residents most often leave under.

Medicare 37%
Private pay 47%
Medicaid 16%

Places of interest near North Pointe Care Center

Address 6.0 miles from city center Info Estimated distance in miles from Fresno's city center to North Pointe Care Center's address, calculated via Google Maps. — 0.36 miles to nearest hospital (Fresno Surgical Hospital)

Calculate Travel Distance to North Pointe Care Center

Add your location

Address

Compare Nursing Homes around Fresno

The information below is reported by the California Department of Social Services and Department of Public Health.

5 facilities compared · CMS & CA Dept. of Health data

North Pointe Care Center
NH
MC
RC
Fresno (East Bullard Avenue)
99
Facility 99
CA AVG 103
Rank #725 / 1657
88.8%
Facility 88.8%
CA AVG 84.7%
Rank #358 / 1537
+5%
3.61
Facility 3.61
CA AVG 4.22
Rank #269 / 354
+19%-14%
$0
Facility $0
CA AVG $56.5k
Rank #1 / 362
-
21
Facility 21
CA AVG 50.2
Rank #47 / 361
4.2
Facility 4.2
CA AVG 4.6
Rank #188 / 361
-92-
80
Facility 80
CA AVG 57
Rank #417 / 2092
North Point Wellness Gp LLC
$8.5M
Facility $8.5M
CA AVG $17.0M
Rank #239 / 355
$5.5M
Facility $5.5M
CA AVG $7.0M
Rank #261 / 355
64.7%
Facility 64.7%
CA AVG 45.2%
Rank #227 / 355
555179
The Terraces at San Joaquin Gardens a CCRC
NH
AL
IL
MC
Fresno
652
Facility 652
CA AVG 103
Rank #9 / 1657
57.2%
Facility 57.2%
CA AVG 84.7%
Rank #1265 / 1537
-32%
5.21
Facility 5.21
CA AVG 4.22
Rank #31 / 354
+27%+23%
$0
Facility $0
CA AVG $56.5k
Rank #1 / 362
88
Facility 88
CA AVG 81
Rank #513 / 1401
32
Facility 32
CA AVG 50.2
Rank #128 / 361
4.6
Facility 4.6
CA AVG 4.6
Rank #216 / 361
1373A+
57
Facility 57
CA AVG 57
Rank #1157 / 2092
Humangood Fresno
$33.9M
Facility $33.9M
CA AVG $17.0M
Rank #28 / 355
$13.6M
Facility $13.6M
CA AVG $7.0M
Rank #32 / 355
40.2%
Facility 40.2%
CA AVG 45.2%
Rank #284 / 355
55846
Evergreen Life Care Homes
NH
HC
MC
RC
Fresno (Roosevelt)
49
Facility 49
CA AVG 103
Rank #1138 / 1657
90.9%
Facility 90.9%
CA AVG 84.7%
Rank #295 / 1537
+7%
4.36
Facility 4.36
CA AVG 4.22
Rank #105 / 354
-27%+3%
$0
Facility $0
CA AVG $56.5k
Rank #1 / 362
-
33
Facility 33
CA AVG 50.2
Rank #136 / 361
3.0
Facility 3.0
CA AVG 4.6
Rank #65 / 361
246A+
37
Facility 37
CA AVG 57
Rank #1605 / 2092
Evergreen Care Center Holdings LLC
$8.6M
Facility $8.6M
CA AVG $17.0M
Rank #326 / 355
$2.8M
Facility $2.8M
CA AVG $7.0M
Rank #346 / 355
32.6%
Facility 32.6%
CA AVG 45.2%
Rank #252 / 355
555920
Horizon Health & Subacute Center
NH
Fresno (East Herndon Avenue)
180
Facility 180
CA AVG 103
Rank #210 / 1657
70.2%
Facility 70.2%
CA AVG 84.7%
Rank #949 / 1537
-17%
4.73
Facility 4.73
CA AVG 4.22
Rank #69 / 354
-29%+12%
$22.9k
Facility $22.9k
CA AVG $56.5k
Rank #268 / 362
74
Facility 74
CA AVG 81
Rank #998 / 1401
43
Facility 43
CA AVG 50.2
Rank #191 / 361
3.1
Facility 3.1
CA AVG 4.6
Rank #77 / 361
2153-
58
Facility 58
CA AVG 57
Rank #1128 / 2092
Chad Galley
$4.8M
Facility $4.8M
CA AVG $17.0M
Rank #345 / 355
$3.1M
Facility $3.1M
CA AVG $7.0M
Rank #330 / 355
65.1%
Facility 65.1%
CA AVG 45.2%
Rank #16 / 355
55199
Fresno Nursing Center
NH
Fresno (Mclane)
65
Facility 65
CA AVG 103
Rank #1044 / 1657
95.3%
Facility 95.3%
CA AVG 84.7%
Rank #188 / 1537
+13%
3.96
Facility 3.96
CA AVG 4.22
Rank #184 / 354
-39%-6%
$42.8k
Facility $42.8k
CA AVG $56.5k
Rank #302 / 362
-
50
Facility 50
CA AVG 50.2
Rank #226 / 361
4.6
Facility 4.6
CA AVG 4.6
Rank #216 / 361
461-
66
Facility 66
CA AVG 57
Rank #855 / 2092
Fresno Nursing And Rehab Center LLC
$8.7M
Facility $8.7M
CA AVG $17.0M
Rank #303 / 355
$5.1M
Facility $5.1M
CA AVG $7.0M
Rank #269 / 355
58.1%
Facility 58.1%
CA AVG 45.2%
Rank #29 / 355
56266

Financial Assistance for
Nursing Home in California

North Pointe Care Center is located in Fresno, California.
Here are the financial assistance programs available to residents in California.

Get Financial aid guidance

Multipurpose Senior Services Program

MSSP (Medi-Cal Waiver)

Age 65+
General California resident, Medi-Cal eligible, nursing home risk.
Income Limits (2025) ~$2,829/month 300% FBR, individual
Asset Limits $2,000 (individual), $3,000 (couple).
CA

County-managed; waitlists possible.

Benefits
In-home support (4-6 hours/day) Respite care (14 days/year) Meals (~$6/meal) Transportation (8 trips/month) Care management

In-Home Supportive Services (IHSS)

California IHSS

Age 65+
General California resident, Medicaid-eligible or low-income.
Income Limits ~$1,732/month individual, Medi-Cal threshold
Asset Limits $2,000 individual
CA

Can hire family as caregivers.

Benefits
Personal care (up to 283 hours/month) Homemaker services Respite (varies)

Multipurpose Senior Services Program (MSSP)

CA MSSP

Age 65+
General California resident, Medi-Cal-eligible, nursing home-eligible but community-capable.
Income Limits ~$2,829/month 300% FBR, individual
Asset Limits $2,000 individual
CA

Available in 38 counties; waitlists common.

Benefits
Case management Respite care (up to 10 days/year) Minor home mods (avg. $500) Adult day care (~$50/day)

Property Tax Postponement Program (PTP)

CA PTP

Age 62+
General California resident, own and live in home, 40% equity.
Income Limits (2025) ~$51,500/year household, adjusted annually
Asset Limits Equity-based; no strict asset cap.
CA

Deferred taxes accrue interest (5% as of 2024); repaid upon sale/death.

Benefits
Property tax deferral (avg. $1,000-$3,000/year, varies by county)

Assisted Living Waiver (ALW)

CA ALW

Age 65+ or disabled
General California resident, Medi-Cal-eligible, nursing home-eligible.
Income Limits ~$2,829/month 300% FBR, individual
Asset Limits $2,000 individual
CA

Available in 15 counties (e.g., LA, Sacramento); waitlists common.

Benefits
Personal care in ALFs (5-7 hours/day) Medication management Social services

California CARES Program

CA CARES

Age
General Caregivers of California residents 60+ needing help with 3+ daily activities; no caregiver age limit.
Income Limits No strict limit; cost-sharing above ~$2,500/month threshold.
Asset Limits Not applicable; need-based.
CA

High demand in urban areas; complements IHSS respite.

Benefits
Respite care (up to 10 days/year) Counseling (4-6 sessions/year) Training (2-3 workshops/year) Supplies (~$200/year)

Frequently Asked Questions about North Pointe Care Center

What neighborhood is North Pointe Care Center in?

North Pointe Care Center is in the East Bullard Avenue neighborhood.

Is North Pointe Care Center in a walkable area?

North Pointe Care Center has a walk score of 80. Very walkable. Most errands can be accomplished on foot, and many essentials are within a short walk.

What is the occupancy rate at North Pointe Care Center?

North Pointe Care Center's occupancy is 88.8%.

Does North Pointe Care Center operate as a for-profit or non-profit?

North Pointe Care Center is registered as a for-profit.

Are there photos of North Pointe Care Center?

Yes — there are 2 photos of North Pointe Care Center in the photo gallery on this page.

What is the address of North Pointe Care Center?

North Pointe Care Center is located at 668 E Bullard Ave, Fresno, CA 93710.

What is the phone number of North Pointe Care Center?

(916) 922-7177 will put you in contact with the team at North Pointe Care Center.

Guides for Better Senior Living

Care Cost Calculator: See Prices in Your Area

Nursing Home Data Explorer

Don’t Wait Too Long: 7 Red Flag Signs Your Parent Needs Assisted Living Now

The True Cost of Assisted Living in 2025 – And How Families Are Paying For It

Understanding Senior Living Costs: Pricing Models, Discounts & Financial Assistance