Primarily short stays
Residents typically stay for brief periods, with frequent admissions and discharges throughout the year.
Most new residents arrive under private pay (61% of admissions), and a typical private pay stay runs around 2 - 3 months.
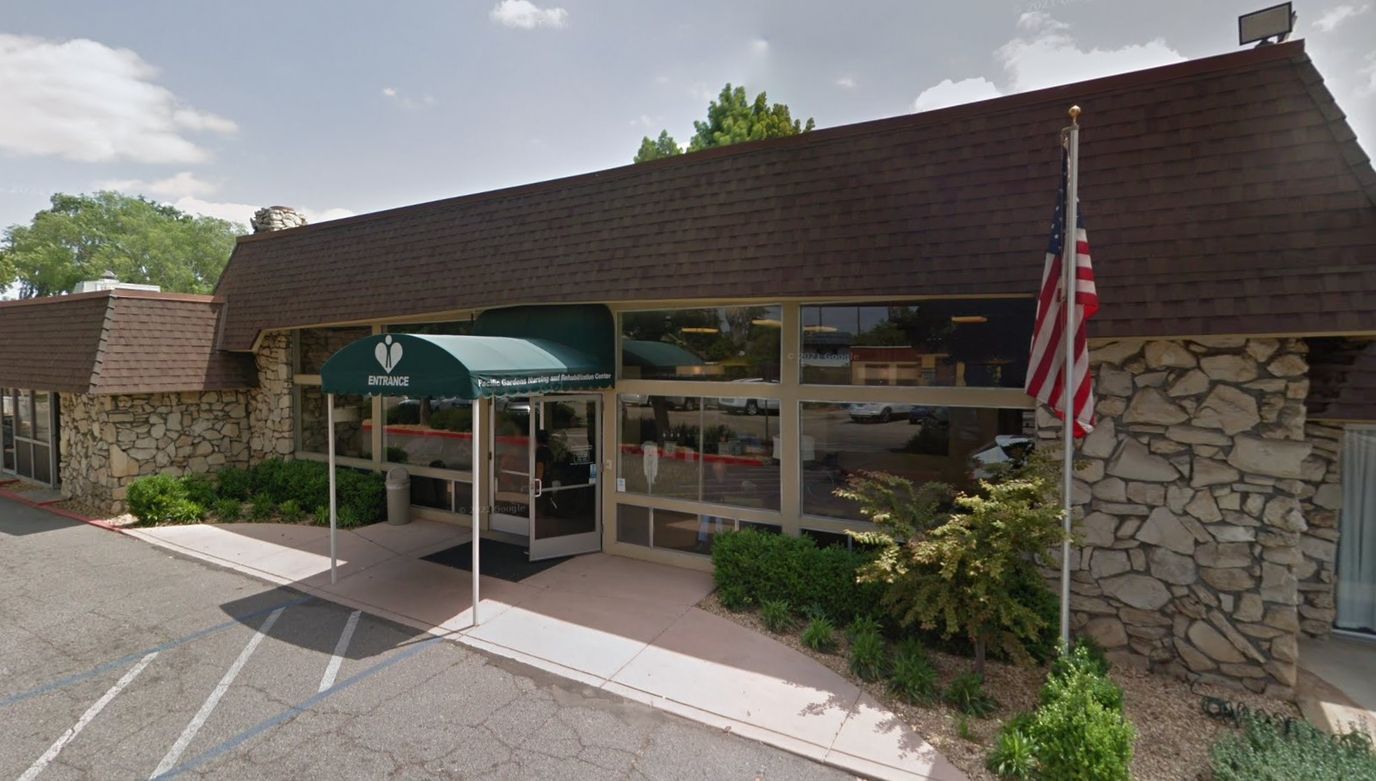
Pacific Gardens Nursing and Rehabilitation is a nursing home in Fresno, California, providing hospice care and skilled nursing. Skilled nursing means licensed nursing care is available on site around the clock, while hospice care focuses on comfort for a person nearing the end of life. Respite care supports short stays, and short-term rehabilitation is available for temporary recovery needs, which may suit a family arranging a brief caregiving stay or a resident recovering through rehabilitation services.
The community has 188 beds, with private and semi-private rooms. A private room gives one resident a room of their own, while a semi-private room places two residents in the same room. Medicare, Medicaid, and private pay are accepted, with Medicare applying to short-term skilled care after a qualifying hospital stay, Medicaid potentially helping cover care for an eligible person whose resources do not cover a long stay, and private pay meaning the family pays directly.
Ensign Services owns the facility. Landscaped grounds provide an outdoor area on the property where residents can spend time outside.
Standout metric: RN, weekends is +20% above California average
3 of 6 metrics below California average
Source: CMS Provider Information, average daily residents
Source: CMS Penalties Database · Data as of Aug 2026
No penalties in the past 3 years
No civil money penalties or payment denials on record since Aug 2023.
31% of new residents, usually for short-term rehab.
61% of new residents, often for short stays.
8% of new residents, often for long-term daily care.
Based on CMS SNF Cost Report for fiscal year ending in 12/2024.
Residents typically stay for brief periods, with frequent admissions and discharges throughout the year.
Most new residents arrive under private pay (61% of admissions), and a typical private pay stay runs around 2 - 3 months.
Coverage residents most often arrive under.
Coverage residents most often leave under.
3.9 miles from city center
Estimated distance in miles from Fresno's city center to Pacific Gardens Nursing and Rehabilitation's address, calculated via Google Maps.
Add your location
Info below is compiled from CMS reports & the CA Dept. of Social Services (CDSS), senior community websites & trusted data sources such as Walk Score & BBB.
Communities are listed from highest-ranked to lowest-ranked based on our methodology.
The facility name. Click to view the full profile page on Assisted Living Magazine, including photos, services, and contact info.
|
CMS (Centers for Medicare & Medicaid Services, the federal agency that regulates nursing homes) Overall 5-star rating — a composite of Health Inspection, Staffing, and Quality Measures scores. 5 stars = top 10% nationally. 1 star = bottom 10%. The single most important number to start with when comparing facilities.
|
Care Types in This Table
AL (Assisted Living):
Housing with help for daily activities like bathing, dressing, and medication, without 24-hour skilled nursing.
NH (Nursing Home):
24/7 skilled nursing care for residents with complex, ongoing medical needs.
SNF (Skilled Nursing Facility):
Round-the-clock nursing care, often for recovery after surgery, injury, or illness.
MC (Memory Care):
Secured, specialized care for people living with Alzheimer's or dementia.
RC (Respite Care):
Short-term temporary care that gives family caregivers a break.
IL (Independent Living):
Community living with dining, activities, and transportation for active seniors who need little personal care.
HOS (Hospice Care):
Comfort-focused care for those with a terminal illness, prioritizing quality of life over treatment.
|
Neighborhood or city area where the facility is located. Proximity to family, hospitals, and green space matters for both quality of life and ease of visitation. Consider drive time and transit access when evaluating location.
|
Licensed bed capacity. Larger facilities (300+ beds) often have more specialized programs but can feel institutional. Smaller homes (under 150 beds) tend to deliver more personalized care. Compare with Avg Res/Day to understand how full the facility typically runs.
|
Percentage of licensed beds filled on an average day. Color indicates financial health: green (90%+) = operationally strong, typically profitable. Amber (80–89%) = stable but leaving revenue on the table. Orange (70–79%) = financial strain likely, may struggle with fixed costs. Red (<70%) = significant distress, closure or ownership change risk increases sharply.
|
This facility's occupancy rate compared to the statewide average for similar facilities. A positive number means above-average demand. Facilities running 5%+ above the state average are typically the most sought-after in their market — a strong proxy for reputation.
|
CMS-adjusted total nurse hours per resident per day (RN + LPN + CNA combined). The national average is approximately 3.5 hrs. Higher is better — more direct care time per resident. Below 3.0 is a red flag. CMS weights RN hours more heavily because RNs handle complex clinical decisions that CNAs cannot.
|
CMS Health Inspection star rating (1–5 stars), based on the 3 most recent annual state surveys plus any complaint investigations. This is the hardest rating to manipulate — it reflects real surveyor findings on-site. 5 stars = fewest deficiencies found. 1 star = most. It carries the heaviest weight in the Overall CMS rating.
|
CMS Staffing star rating (1–5 stars), based on daily nurse staffing hours submitted to CMS via verified payroll data. Compares RN, LPN, and CNA coverage relative to resident acuity level. 5 stars = well above expected staffing. Weekend staffing is evaluated separately, as that's where many facilities quietly reduce coverage.
|
CMS Quality Measures star rating (1–5 stars), based on 15 clinical outcome metrics including fall rates, pressure ulcers, antipsychotic drug use, and hospital readmissions. Captures actual resident health outcomes, not just compliance. High QM combined with low Health Inspection scores can indicate a facility with strong care but weak documentation practices.
|
Registered Nurse hours per resident/day compared to the statewide average. RNs are the highest-skilled nursing staff — they assess residents, manage medications, and respond to emergencies. A value of +50% means RN coverage is 50% above the state norm. Negative values are a concern for residents with complex or acute medical needs.
|
Total nursing staff hours (RN + LPN + CNA combined) per resident/day vs. the statewide average. A broader measure than RN vs State — it captures the entire care team. A facility can have high total staffing but low RN hours, meaning more aides and fewer nurses. Read both columns together for the full picture.
|
Total dollar amount of federal monetary fines (civil money penalties) issued by CMS in the past 3 years. Fines are only levied for serious violations — typically actual harm to residents, repeated uncorrected deficiencies, or systemic non-compliance. Even a single fine is noteworthy. Multiple fines strongly suggest a pattern, not isolated incidents.
|
Total health deficiency citations from the most recent standard inspection cycle. Minor citations (scope A–C) are common and often administrative in nature. Higher counts aren't always disqualifying, but should be read alongside Severe Citations to understand actual harm levels. Under 10 is strong for a large facility; 30+ warrants a closer look.
|
Average deficiency citations per CMS inspection (survey) in the reporting window — total citations divided by the number of inspections. Lower is better; compare alongside total Citations and Severe Citations for context.
|
Citations at CMS scope/severity level G or higher — G–I means actual harm occurred; J–L means residents were placed in immediate jeopardy. (D–F is potential for harm only). Examples include unaddressed falls, medication errors causing injury, neglect, or abuse.
|
Average number of residents in the building on any given day, derived from annual census data. Reflects true operating scale — a 400-bed facility running 200 residents/day operates very differently from one at 390. Higher resident counts generally mean more funded staffing hours.
|
Better Business Bureau rating (A+ to F). Reflects complaint history, business transparency, and how family disputes were resolved. A+ means no significant unresolved complaints. A blank (—) means the facility isn't BBB-accredited, which is common for healthcare providers and not necessarily a negative signal.
|
Walk Score® (0–100). Measures walkability of the surrounding area. 90–100 = Walker's Paradise. 70–89 = Very Walkable. 50–69 = Somewhat Walkable. Below 50 = Car-Dependent. Higher scores benefit family visitors, resident outings, and staff commuting.
|
The licensed owner or operator of record filed with CMS — the individual or organization legally accountable for the facility. Searching the operator name across other facilities can reveal chain or multi-site ownership, which matters: chain-operated homes tend to have more variable quality outcomes than independently run facilities.
|
What the home actually collects for resident care, after contractual allowances, bad debt and discounts — not gross billings. Taken from the latest complete annual cost report, so it is comparable across homes reporting the same period. Revenue alone doesn't indicate care quality, but it funds staffing and capital reinvestment. Pair with Payroll %. Figures are from each facility's most recent complete fiscal year — hover a value for the exact year; a * marks homes that report an older period than most facilities.
|
Staff salaries plus wage-related benefits from the latest complete annual cost report. Contract and agency labour is counted separately, under other operating costs, so a home leaning on agency staff can show a low figure here. Payroll is the cost most directly tied to care quality — compare with Payroll % for full context. Figures are from each facility's most recent complete fiscal year — hover a value for the exact year; a * marks homes that report an older period than most facilities.
|
Payroll as a share of NET PATIENT REVENUE (not gross revenue). Both figures come from the same cost-report year. A higher figure means more of each revenue dollar goes to staff pay. Read with the Staffing star rating to judge whether spend translates into coverage — and note that homes whose patient revenue covers only part of their operation can read implausibly high. The California average is: 61.4% Figures are from each facility's most recent complete fiscal year — hover a value for the exact year; a * marks homes that report an older period than most facilities.
|
CMS Certification Number: the unique federal identifier for this skilled nursing provider.
|
|---|---|---|---|---|---|---|---|---|---|---|---|---|---|---|---|---|---|---|---|---|---|---|---|---|
| North Pointe Care Center | NH MC RC SNF | Fresno | 99
Facility
99
CA AVG
161
Rank
#176 / 341 |
91.6%
Facility
91.6%
CA AVG
82.2%
Rank
#97 / 299 | +11% | 3.54
Facility
3.54
CA AVG
4.33
Rank
#258 / 290 | +19% | -18% | $0
Facility
$0
CA AVG
$60.5k
Rank
#1 / 295 | 20
Facility
20
CA AVG
49.9
Rank
#34 / 293 | 5.0
Facility
5.0
CA AVG
4.7
Rank
#193 / 293 | - | 91 | - |
80
Facility
80
CA AVG
60
Rank
#72 / 344 | North Point Wellness Gp LLC | $13.8MFiscal year ending 04/2025
Facility
$13.8MFiscal year ending 04/2025
CA AVG
$17.3M
Rank
#167 / 288 | $8.0MFiscal year ending 04/2025
Facility
$8.0MFiscal year ending 04/2025
CA AVG
$9.8M
Rank
#167 / 288 | 57.9%Fiscal year ending 04/2025
Facility
57.9%Fiscal year ending 04/2025
CA AVG
61.4%
Rank
#92 / 288 | 555179 | ||||
| The Terraces at San Joaquin Gardens a CCRC | NH AL IL MC SNF | Fresno | 652
Facility
652
CA AVG
161
Rank
#10 / 341 |
57.2%
Facility
57.2%
CA AVG
82.2%
Rank
#267 / 299 | -30% | 5.34
Facility
5.34
CA AVG
4.33
Rank
#21 / 290 | +27% | +23% | $0
Facility
$0
CA AVG
$60.5k
Rank
#1 / 295 | 31
Facility
31
CA AVG
49.9
Rank
#102 / 293 | 5.2
Facility
5.2
CA AVG
4.7
Rank
#205 / 293 | 1 | 373 | A+ |
57
Facility
57
CA AVG
60
Rank
#211 / 344 | Humangood & Humangood Norcal & Humangood Fresno | $37.7MFiscal year ending 12/2024
Facility
$37.7MFiscal year ending 12/2024
CA AVG
$17.3M
Rank
#10 / 288 | $14.4MFiscal year ending 12/2024
Facility
$14.4MFiscal year ending 12/2024
CA AVG
$9.8M
Rank
#41 / 288 | 38.3%Fiscal year ending 12/2024
Facility
38.3%Fiscal year ending 12/2024
CA AVG
61.4%
Rank
#278 / 288 | 055846 | ||||
| Evergreen Life Care Homes | NH HOS MC RC SNF | Fresno (Roosevelt) | 49
Facility
49
CA AVG
161
Rank
#302 / 341 |
93.3%
Facility
93.3%
CA AVG
82.2%
Rank
#65 / 299 | +14% | 3.73
Facility
3.73
CA AVG
4.33
Rank
#268 / 290 | -27% | -14% | $0
Facility
$0
CA AVG
$60.5k
Rank
#1 / 295 | 35
Facility
35
CA AVG
49.9
Rank
#118 / 293 | 2.7
Facility
2.7
CA AVG
4.7
Rank
#31 / 293 | 2 | 46 | A+ |
37
Facility
37
CA AVG
60
Rank
#280 / 344 | Evergreen Care Center Holdings LLC | $7.2MFiscal year ending 12/2024
Facility
$7.2MFiscal year ending 12/2024
CA AVG
$17.3M
Rank
#272 / 288 | $3.5MFiscal year ending 12/2024
Facility
$3.5MFiscal year ending 12/2024
CA AVG
$9.8M
Rank
#280 / 288 | 48.7%Fiscal year ending 12/2024
Facility
48.7%Fiscal year ending 12/2024
CA AVG
61.4%
Rank
#214 / 288 | 555920 | ||||
| Horizon Health & Subacute Center | NH SNF | Fresno | 180
Facility
180
CA AVG
161
Rank
#81 / 341 |
85.2%
Facility
85.2%
CA AVG
82.2%
Rank
#172 / 299 | +4% | 4.59
Facility
4.59
CA AVG
4.33
Rank
#93 / 290 | -29% | +6% | $22.9k
Facility
$22.9k
CA AVG
$60.5k
Rank
#222 / 295 | 45
Facility
45
CA AVG
49.9
Rank
#171 / 293 | 3.2
Facility
3.2
CA AVG
4.7
Rank
#62 / 293 | 2 | 153 | - |
58
Facility
58
CA AVG
60
Rank
#208 / 344 | Chad Galley | $24.6MFiscal year ending 12/2024
Facility
$24.6MFiscal year ending 12/2024
CA AVG
$17.3M
Rank
#59 / 288 | $16.0MFiscal year ending 12/2024
Facility
$16.0MFiscal year ending 12/2024
CA AVG
$9.8M
Rank
#26 / 288 | 65.1%Fiscal year ending 12/2024
Facility
65.1%Fiscal year ending 12/2024
CA AVG
61.4%
Rank
#46 / 288 | 055199 |
Rank badges are statewide and care-type specific: each nursing home is ranked against every other CA nursing home we track that reports that metric, not just the 4 on this page. See how we rank facilities
Pacific Gardens Nursing and Rehabilitation is located in Fresno, California.
Here are the financial assistance programs available to residents in California.
Pacific Gardens Nursing and Rehabilitation has a walk score of 43. Car-dependent. A few nearby services may be reachable on foot, but most trips require transportation.
Pacific Gardens Nursing and Rehabilitation's occupancy is 89.2%.
No, Pacific Gardens Nursing and Rehabilitation has a no-pet policy.
The team at Pacific Gardens Nursing and Rehabilitation can be reached at contact-pacificgardens@ensignservices.net.
Pacific Gardens Nursing and Rehabilitation is registered as a for-profit.
Pacific Gardens Nursing and Rehabilitation received a 3-star overall rating from the CMS (Centers for Medicare and Medicaid Services). This score combines results from staffing levels, quality measures, and health inspections.
Yes — there is 1 photo of Pacific Gardens Nursing and Rehabilitation in the photo gallery on this page.
Care Cost Calculator: See Prices in Your Area
Nursing Home Data Explorer
Don’t Wait Too Long: 7 Red Flag Signs Your Parent Needs Assisted Living Now
The True Cost of Assisted Living in 2025 – And How Families Are Paying For It
Understanding Senior Living Costs: Pricing Models, Discounts & Financial Assistance