Ridgecrest Health and Rehabilitation
Nursing Home, Memory Care & Respite Care · Jonesboro, AR
CMS overall rating Info CMS (the Centers for Medicare & Medicaid Services) is the federal agency that rates nursing home quality. Its Overall Rating runs from 1 to 5 stars, combining health inspections, staffing, and quality measures, with inspections weighted most heavily.

Ridgecrest Health and Rehabilitation

Nursing Home, Memory Care & Respite Care · Jonesboro, AR
CMS overall rating Info CMS (the Centers for Medicare & Medicaid Services) is the federal agency that rates nursing home quality. Its Overall Rating runs from 1 to 5 stars, combining health inspections, staffing, and quality measures, with inspections weighted most heavily.
Calculator: See prices in your area
Ridgecrest Health and Rehabilitation accepts Medicare, Medicaid, and private pay.

Overview of Ridgecrest Health and Rehabilitation

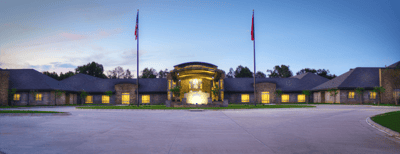
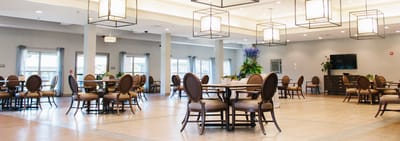
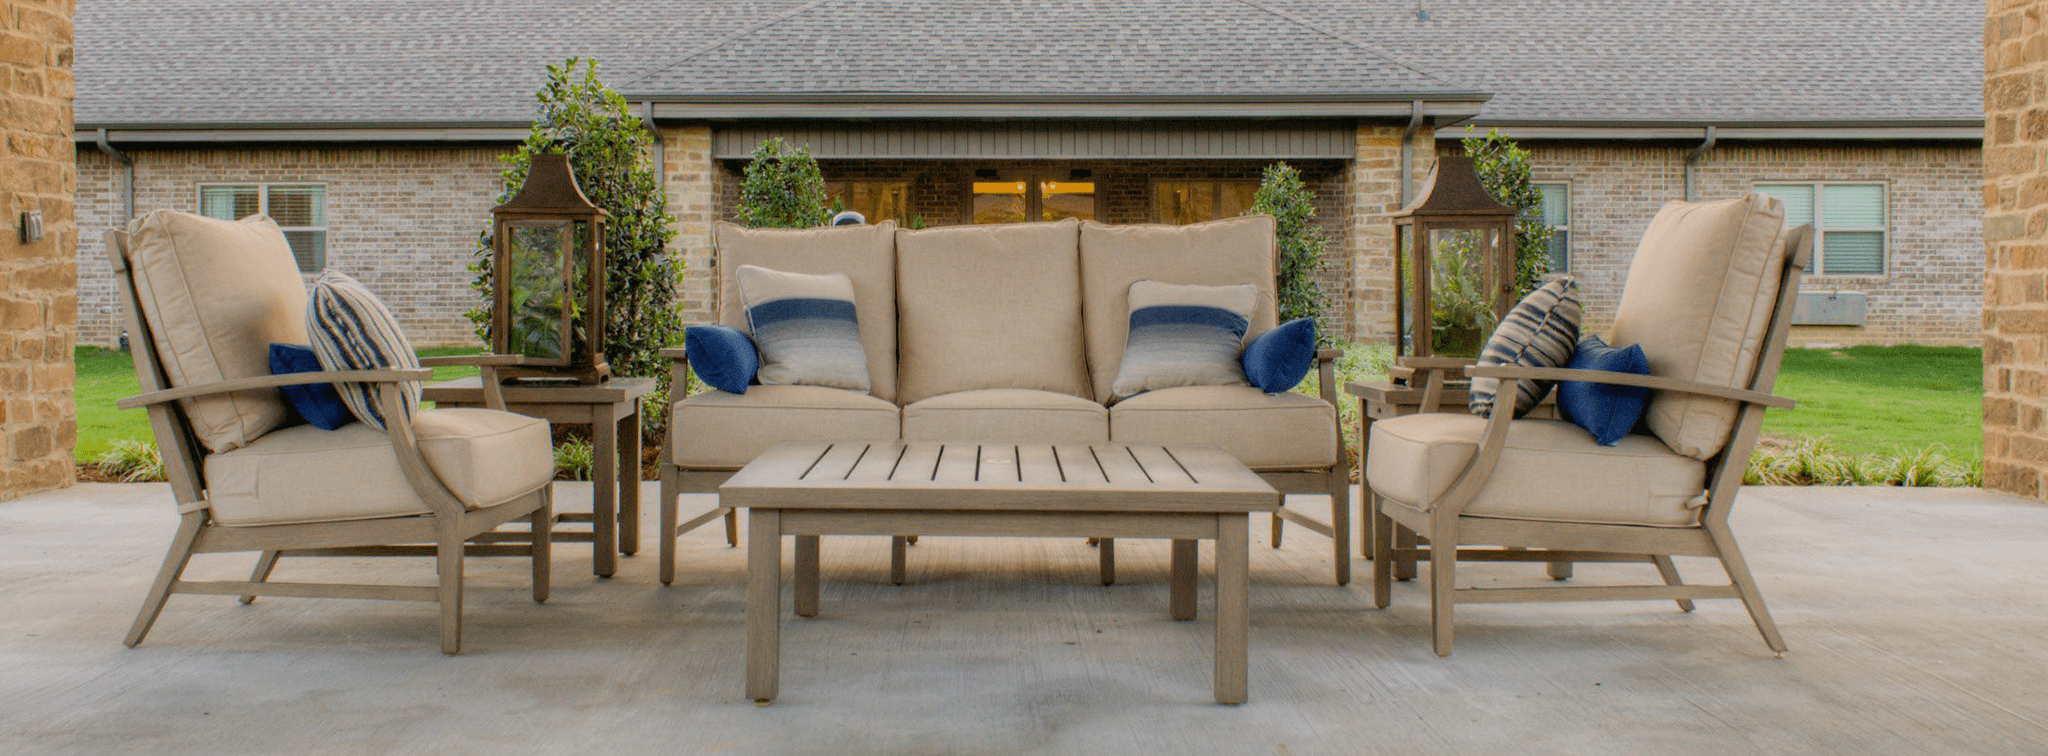
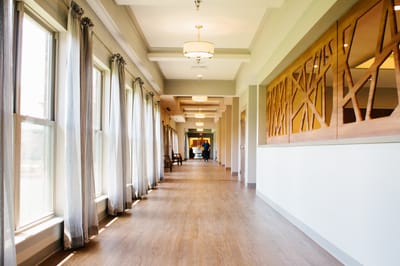
Located in the heart of Jonesboro, Arkansas, Ridgecrest Health and Rehabilitation is a premier assisted living community offering specialized short-term transitional services and long-term care options. Whether individuals seek accelerated recovery or require ongoing care, Ridgecrest Health and Rehabilitation is committed to providing the highest quality healthcare services to the residents of Jonesboro and its surrounding communities.

Their goal is centered on enhancing the quality of life of residents, fostering a warm, comfortable, and rewarding experience that extends care to seniors, their families, associates, and everyone involved in making Ridgecrest Health and Rehabilitation a leading healthcare provider in the region. At Ridgecrest Health and Rehabilitation, where their health, comfort, and dignity are of utmost importance.

(870) 932-3271

Quality ratings

Measured by Centers for Medicare & Medicaid Services (CMS)

Overall rating Info The Overall CMS Rating combines results from health inspections, staffing levels and quality measures. Health inspections carry the most weight. Staffing and quality scores can increase or decrease the final rating based on performance compared to state and national standards.
▼ 36.3% Below AR avg. ▼ 36.3% Below AR avg.AR average: 3.1Click the badge to see the full State ranking.Click here to see the full State ranking.
Health Inspection Info Based on the results of the facility's three most recent standard inspections and any complaint investigations. CMS reviews the number, scope, and severity of deficiencies, with more recent findings weighted more heavily.
▼ 30.8% Below AR avg. ▼ 30.8% Below AR avg.AR average: 2.9Click the badge to see the full State ranking.Click here to see the full State ranking.
Staffing Info Measures average nursing staff hours per resident per day, including Registered Nurses (RNs) and total nursing staff. Ratings are adjusted based on the level of care residents require and are compared to state and national benchmarks.
▼ 5.8% Below AR avg. ▼ 5.8% Below AR avg.AR average: 3.2Click the badge to see the full State ranking.Click here to see the full State ranking.
Quality Measures Info Based on clinical and physical health indicators reported to CMS, such as hospital readmissions, falls, pressure ulcers, and improvements in mobility. These measures reflect how well residents' health needs are being managed.
▲ 9.3% Above AR avg. ▲ 9.3% Above AR avg.AR average: 3.7Click the badge to see the full State ranking.Click here to see the full State ranking.

Staffing hours breakdown

Info Daily nursing hours per resident by staff type, reported to CMS. Higher is generally better — compare this facility to state and national averages to see where staffing stands.

Hours per resident per day — compared to Arkansas state averages

Total nursing care / resident Info Total adjusted nursing hours per resident per day, combining RN, LPN, and aide time. CMS adjusts this for case-mix so facilities can be fairly compared.
4h 27m per day
This facility Arkansas avg (4h 40m per day)
vs Arkansas avg
-5%

3 of 6 metrics below state avg

Standout metric Nurse Aide is +15% above state avg
Staff typeHours / Day / Residentvs state avg
Registered Nurse (RN) Info RNs hold the highest nursing license and can assess residents, interpret test results, and direct care plans. More RN hours per day often signals stronger clinical oversight and faster response to health changes. 25m per day ▲ 6% State avg: 24m per day · National avg: 41m per day
LPN / LVN Info Licensed Practical Nurses (LPNs) or Licensed Vocational Nurses (LVNs) deliver routine hands-on care — medication administration, wound dressing, and monitoring vital signs. They work under RN supervision and make up a large share of daily bedside care. 42m per day ▼ 27% State avg: 57m per day · National avg: 52m per day
Nurse Aide Info Certified Nurse Aides (CNAs) provide the most direct day-to-day assistance: bathing, dressing, feeding, and mobility. Nurse aide hours are typically the largest staffing category and directly affect residents' quality of life. 3h 9m per day ▲ 15% State avg: 2h 44m per day · National avg: 2h 21m per day
Weekend Total Nursing Info Combined nursing hours (RN + LPN + Nurse Aide) per resident per day on weekends. Staffing often drops on weekends — this figure reveals whether the facility maintains adequate coverage outside of weekday hours. 3h 26m per day ■ Avg State avg: 3h 29m per day · National avg: 3h 26m per day
Physical Therapist Info Hours per resident per day provided by licensed Physical Therapists (PTs) or PT Assistants. PT services help residents recover mobility after injury or illness and are especially important for post-acute (short-stay) rehabilitation. 1m per day ▼ 56% State avg: 2m per day · National avg: 4m per day
Weekend RN Info Registered nurse hours specifically on weekends. Facilities sometimes reduce RN presence on Saturdays and Sundays — a low weekend RN figure compared to weekday hours can indicate reduced clinical oversight when most administrative staff are absent. 16m per day ▼ 3% State avg: 16m per day · National avg: 29m per day

Capacity and availability

Avg. Length of Stay
95 days
Bed community size
152-bed community Rank #9 / 330Bed count — State benchmarkedThis home is ranked 9th out of 330 homes in Arkansas. Shows this facility's certified or reported bed count compared to other Arkansas facilities. Larger communities may offer more amenities, programs, and on-site services for residents and families.Rankings are based only on facilities in Arkansas that report data for that category. Facilities without available data are excluded from the ranking.Click the rank badge to see the full State ranking.Click here to see the full State ranking.
A large-scale community that may provide a wide range of amenities, services, and structured programs.
Walk Score
Walk Score: 10 / 100 Rank #342 / 419Walk Score — State benchmarkedThis home is ranked 342nd out of 419 homes in Arkansas. Shows how walkable this facility's neighborhood is compared to the average Walk Score across Arkansas facilities. Higher scores benefit residents, families, and staff.Rankings are based only on facilities in Arkansas that report data for that category. Facilities without available data are excluded from the ranking.Click the rank badge to see the full State ranking.Click here to see the full State ranking.
Car-dependent. Most errands require a car, with limited nearby walkable options.

About this community

License Details

Facility TypeSkilled Nursing Facility With Dual Certified Beds (medicaid/medicare)
CountyCraighead
Business TypeCorporation
Certification TypeMedicaid / Medicare

Ownership & Operating Entity

Ridgecrest Health and Rehabilitation is legally operated by JBNC, Inc., and administered by Marlisa Thompson.

Type Of Units

Medicaid and Medicare
135 units
Private Pay
17 units
Total beds
152 units

Therapy & Rehabilitation

2 services
Rehabilitation Services
Respite Care

Staffing & Medical

1 service
24-Hour Staffing

Contact Information

Fax870-932-9410

Amenities & Lifestyle

Communal Dining Space
Dedicated Activity Area
Enclosed Outdoor Courtyard
Specialized Outdoor Therapy Equipment
Full-Service Salon
Physical Therapy
Occupational Therapy
Speech Therapy
ActivitiesYes
Specific ProgramsShort-Term Rehab, Additional Services, Engaging Social Activities

Dining & Nutrition

Food DescriptionSavor a variety of delicious dishes crafted by our certified dietary manager and cooks. From Southern classics like fried okra and biscuits with gravy to lighter fare like pasta, chicken, and fresh greens, there’s something for every taste.

Contact Ridgecrest Health and Rehabilitation

Inspection History

In Arkansas, the Department of Human Services, Office of Long Term Care is authorized to conduct unannounced inspections and issue official quality of care reports for all senior living providers.

Since 2022 · 4 years of data 53 deficiencies

Inspection Scorecard Info This scorecard compares key inspection, citation, and complaint metrics at this facility against the Arkansas state average. Metrics rated ≥15% worse than average are highlighted in red; those ≥15% better are highlighted in green.

Since 2022 vs. Arkansas state average
Overall vs. AR average 2 Worse Metrics worse than Arkansas average:
• Total deficiencies (152% above)
• Deficiencies per year (151% above)
0 Better No metrics in this bucket.
Latest Inspection October 29, 2024 Routine

Deficiencies Info Deficiencies are formal regulatory issues recorded during state inspections.

This FacilityAR Averagevs. AR Avg
Total deficiencies Info Formal regulatory issues recorded by inspectors across all inspection types. 5321 This facility has 152% more total deficiencies than a typical Arkansas nursing home (53 vs. AR avg 21).↑ 152% worse
Deficiencies per year Info Average deficiencies per year since 2022. 13.35.3 This facility has 151% more deficiencies per year than a typical Arkansas nursing home (13.3 vs. AR avg 5.3).↑ 151% worse

Inspection Reports Summary Info An editor-reviewed summary of the themes and findings across this facility's recent inspection reports.

  • October 29, 2024 inspection found two medication administration deficiencies affecting one resident, both related to timing and nurse accountability, with minimal harm and no complaints substantiated.
  • September 15, 2023 complaint investigation substantiated inadequate staffing, poor cleanliness, and failure to provide activities of daily living care, including nail care, affecting all 111 residents.
  • December 29, 2023 complaint investigation substantiated unsafe incontinent care causing a resident to fall and sustain a femur fracture, delayed x-ray review, and inadequate pain management.

Health Inspection History

Inspections since 2022
Total health inspections 9

Arkansas average 4.2


Last Health inspection on Oct 2024

Total health citations
50

Arkansas average 21.8

Citations per inspection
5.56

Arkansas average 5.32


Health citations are formal notices following inspections when they fail to comply with safety and care standards.

33 of 50 citations resulted from standard inspections; 10 of 50 resulted from complaint investigations; and 7 of 50 came from combined inspections (standard and complaint).

Breakdown of citation severity (last 4 years)
Critical health citations
0
100% better than Arkansas average

Arkansas average: 0.4


Serious health citations
0
100% better than Arkansas average

Arkansas average: 0.2

0 critical citations Arkansas average: 0.4

0 serious citations Arkansas average: 0.2

50 moderate citations Arkansas average: 20.9

0 minor citations Arkansas average: 0.4
Citations history (last 4 years)
Quality of Care moderate citation Oct 29, 2024
Corrected

Quality of Care moderate citation Oct 29, 2024
Corrected

Administration moderate citation Aug 02, 2024
Corrected

Infection Control moderate citation Aug 02, 2024
Corrected

Staffing Data

Reporting period: October 1 – December 31, 2025 (Q4 2025). Source: CMS Payroll-Based Journal report.

Total staff 179
Employees 140
Contractors 39
Staff to resident ratio 1.70 : 1
7% more staff per resident than Arkansas average
Arkansas average ratio: 1.59 : 1 Arkansas average ratio: 1.59 : 1See full Arkansas ranking
Avg staff/day 62
Average shift 8.3 hours
0% compared with Arkansas average
Arkansas average: 8 hours Arkansas average shift: 8 hoursSee full Arkansas ranking
Total staff hours (quarter) 47,446

Nursing staff breakdown

Q4 2025 · Oct 1 – Dec 31 More info This data comes from the CMS Payroll-Based Journal report covering October 1 – December 31, 2025.
Registered Nurse

Manages medical care and health needs.

RN Staff Info All 4 RN Staff are full-time employees. No contractors work on this role. 4
Average shift length Info Average shift length. Calculated as total hours divided by days worked and average staff per day. 10.3 hours
Licensed Practical Nurse

Assists with medical care and medications.

LPN Staff Info All 22 LPN Staff are full-time employees. No contractors work on this role. 22
Average shift length Info Average shift length. Calculated as total hours divided by days worked and average staff per day. 9.5 hours
Certified Nursing Assistant

Helps with daily care and mobility.

CNA Staff Info All 85 CNA Staff are full-time employees. No contractors work on this role. 85
Average shift length Info Average shift length. Calculated as total hours divided by days worked and average staff per day. 8.8 hours

Contractor staffing

Q4 2025 · Oct 1 – Dec 31 More info This data comes from the CMS Payroll-Based Journal report covering October 1 – December 31, 2025.

Total hours from contractors

6.9%

3,251 contractor hours this quarter

Respiratory Therapy Technician: 9 Speech Language Pathologist: 8 Physical Therapy Aide: 7 Physical Therapy Assistant: 5 Clinical Nurse Specialist: 5 Qualified Social Worker: 3 Occupational Therapy Aide: 2

Staff by category

Q4 2025 · Oct 1 – Dec 31 More info This data comes from the CMS Payroll-Based Journal report covering October 1 – December 31, 2025.
Certified Nursing Assistant8508527,99692100%8.8
Licensed Practical Nurse220225,98992100%9.5
Medication Aide/Technician7072,64392100%9.7
Clinical Nurse Specialist105152,1298592%7.3
Registered Nurse4041,4767885%10.3
Speech Language Pathologist0881,1387076%5.8
Physical Therapy Aide0771,0256773%5.3
Dental Services Staff2029576571%8
RN Director of Nursing4047656874%8
Dietitian1016086874%8.9
Other Dietary Services Staff1015436874%8
Administrator1015286672%8
Nurse Practitioner2025126470%8
Qualified Social Worker0333626571%4
Mental Health Service Worker1013494953%7.1
Physical Therapy Assistant0551535964%2.2
Respiratory Therapy Technician0991445964%1.7
Occupational Therapy Aide0221312426%4.7
85 Certified Nursing Assistant
% of Days 100%
22 Licensed Practical Nurse
% of Days 100%
7 Medication Aide/Technician
% of Days 100%
15 Clinical Nurse Specialist
% of Days 92%
4 Registered Nurse
% of Days 85%
8 Speech Language Pathologist
% of Days 76%
7 Physical Therapy Aide
% of Days 73%
2 Dental Services Staff
% of Days 71%
4 RN Director of Nursing
% of Days 74%
1 Dietitian
% of Days 74%
1 Other Dietary Services Staff
% of Days 74%
1 Administrator
% of Days 72%
2 Nurse Practitioner
% of Days 70%
3 Qualified Social Worker
% of Days 71%
1 Mental Health Service Worker
% of Days 53%
5 Physical Therapy Assistant
% of Days 64%
9 Respiratory Therapy Technician
% of Days 64%
2 Occupational Therapy Aide
% of Days 26%

Penalties and fines

Federal penalties imposed by CMS for regulatory violations, including civil money penalties (fines) and denials of payment for new Medicare/Medicaid admissions.

Source: CMS Penalties Database

No penalties in the past 3 years

No civil money penalties or payment denials were reported in the last 3 years.

Quality of care over time

These measures show how residents usually do over time at this home, based on health outcomes and preventive care.

High-risk clinical events score Info A composite score based on pressure ulcers, falls with injury, weight loss, walking ability decline, and activities of daily living decline. 5.8
25% better than Arkansas average

Arkansas average: 7.7

Functional decline score Info A composite score based on activities of daily living decline, walking ability decline, and incontinence. 9.5
28% better than Arkansas average

Arkansas average: 13.3

Long-stay resident measures
Significantly above average Info CMS star rating based on long-stay quality measure performance. 5 stars = significantly above average, 1 star = significantly below average.
Need for Help with Daily Activities Increased Info Percent of long-stay residents whose need for help with daily activities has increased 7.3%
37% better than Arkansas average

Arkansas average: 11.5%

Walking Ability Worsened Info Percent of long-stay residents whose ability to move independently worsened 9.8%
27% better than Arkansas average

Arkansas average: 13.4%

Low Risk Residents with Bowel/Bladder Incontinence Info Percent of low risk long-stay residents who lose control of their bowels or bladder 11.5%
24% better than Arkansas average

Arkansas average: 15.1%

Falls with Major Injury Info Percent of long-stay residents experiencing one or more falls with major injury 0.8%
79% better than Arkansas average

Arkansas average: 3.9%

High Risk Residents with Pressure Ulcers Info Percent of long-stay high risk residents with pressure ulcers 5.5%
16% worse than Arkansas average

Arkansas average: 4.7%

Urinary Tract Infection Info Percent of long-stay residents with a urinary tract infection 0.3%
77% better than Arkansas average

Arkansas average: 1.3%

Lost Too Much Weight Info Percent of long-stay residents who lose too much weight 5.5%
10% worse than Arkansas average

Arkansas average: 5.0%

Depressive Symptoms Info Percent of long-stay residents who have depressive symptoms 0.6%
61% better than Arkansas average

Arkansas average: 1.5%

Antipsychotic Use Info Percent of long-stay residents who received an antipsychotic medication 5.9%
44% better than Arkansas average

Arkansas average: 10.5%

Pneumococcal Vaccine Info Percent of long-stay residents assessed and appropriately given the pneumococcal vaccine 69.6%
26% worse than Arkansas average

Arkansas average: 94.4%

Influenza Vaccine Info Percent of long-stay residents assessed and appropriately given the seasonal influenza vaccine 89.8%
7% worse than Arkansas average

Arkansas average: 96.2%

Hospitalizations per 1,000 days Info Number of hospitalizations per 1,000 long-stay resident days. 1.53
22% better than Arkansas average

Arkansas average: 1.97

ED visits per 1,000 days Info Number of outpatient emergency department visits per 1,000 long-stay resident days. 1.14
48% better than Arkansas average

Arkansas average: 2.18

Short-stay resident measures
Average Info CMS star rating based on short-stay quality measure performance. 5 stars = much above average, 1 star = much below average.
Pneumococcal Vaccine Info Percent of short-stay residents assessed and appropriately given the pneumococcal vaccine 44.0%
46% worse than Arkansas average

Arkansas average: 80.9%

Antipsychotic medication increase Info Percent of short-stay residents who newly received an antipsychotic medication 0.9%
44% better than Arkansas average

Arkansas average: 1.5%

Influenza Vaccine Info Percent of short-stay residents assessed and appropriately given the seasonal influenza vaccine 38.1%
51% worse than Arkansas average

Arkansas average: 77.7%

Re-hospitalized after SNF stay Info Percentage of short-stay residents who were re-hospitalized after their nursing home admission. 25.5%
In line with Arkansas average

Arkansas average: 25.2%

Emergency department visits Info Percentage of short-stay residents who had an outpatient emergency department visit. 10.2%
26% better than Arkansas average

Arkansas average: 13.8%

Falls with major injury Info Percentage of SNF residents who experience falls with major injury during their stay. 1.2%
53% worse than Arkansas average

Arkansas average: 0.8%

Ability to care for self at discharge Info Percentage of residents at or above expected ability to care for themselves at discharge. 69.1%
29% better than Arkansas average

Arkansas average: 53.7%

Successful return to home or community Info Rate of successful return to home or community from a skilled nursing facility. 52.4%
In line with Arkansas average

Arkansas average: 50.6%

Breakdown by payment type

Medicare

35% of new residents, usually for short-term rehab.

Typical stay 1 - 2 months

Private pay

61% of new residents, often for short stays.

Typical stay 1 - 2 months

Medicaid

5% of new residents, often for long-term daily care.

Typical stay 3 years

Facility Characteristics

Source: CMS Long-Term Care Facility Characteristics (Data as of Jan 2026)

Total residents 105
Medicare
15
14.3% of residents
Medicaid
62
59% of residents
Private pay or other
28
26.7% of residents
Programs & Services
Residents Group

Residents meet regularly to discuss policies, care quality, and activities

Nurse Aide Training

State-approved Nurse Aide Training and Competency Evaluation Program on-site

Active Resident Council

Organized group of residents that meets regularly to discuss facility policies, quality of life, and activities.

Finances and operations

Based on CMS SNF Cost Report for fiscal year ending in 12/2023.

Voluntary non-profit community
Operated by a church.
Net patient revenue Info Net patient revenue — what the home actually collects for resident care, after contractual allowances, bad debt and discounts are subtracted from its gross charges (CMS cost report, Worksheet G-3). It covers resident care only; money the home earns from other sources is shown separately as "Other income."
$15.0M
Net patient income Info Net patient income: net patient revenue minus the home's total operating expenses. A positive figure means it earns more from resident care than it spends to deliver it; a negative figure means the opposite. It excludes non-operating "other income."
$2.0M
Voluntary non-profit community Operated by a church.
Net patient revenue Info Net patient revenue — what the home actually collects for resident care, after contractual allowances, bad debt and discounts are subtracted from its gross charges (CMS cost report, Worksheet G-3). It covers resident care only; money the home earns from other sources is shown separately as "Other income."
$15.0M
Net patient income Info Net patient income: net patient revenue minus the home's total operating expenses. A positive figure means it earns more from resident care than it spends to deliver it; a negative figure means the opposite. It excludes non-operating "other income."
$2.0M
Other income Info Money the home earns outside of resident care — such as investments, grants, rentals and other non-operating sources (CMS cost report, Worksheet G-3). It is tracked separately from net patient revenue: it is not part of that figure, and it is not included in net patient income.
$20.5K
Payroll costs Info Staff salaries plus wage-related costs — benefits such as payroll taxes, health insurance and retirement — from the home's own accounting records (CMS cost report, Worksheet A). Contract or agency labor is counted separately, under other operating costs.
$5.5M 36.4% of net patient revenue Info Payroll as a share of revenue: staff salaries and wage-related benefits divided by net patient revenue. A higher figure means more of each revenue dollar goes to staff pay.
Other operating costs Info Everything it costs to run the home apart from payroll — food, utilities, supplies, maintenance, contract labor and administration. Calculated as total operating expense minus payroll (staff salaries and wage-related benefits).
$7.5M
Total costs Info The home's total operating expense for the year — all the costs of running it, salaries included (CMS cost report, Worksheet G-3).
$13.0M

Who this home usually serves

TYPE OF STAY

Primarily short stays

Residents typically stay for brief periods, with frequent admissions and discharges throughout the year.

Most new residents arrive under private pay (61% of admissions), and a typical private pay stay runs around 1 - 2 months.

Admissions
466 total

Coverage residents most often arrive under.

Medicare 35%
Private pay 61%
Medicaid 5%
Discharges
454 total

Coverage residents most often leave under.

Medicare 37%
Private pay 60%
Medicaid 3%

Places of interest near Ridgecrest Health and Rehabilitation

Address 6.3 miles from city center Info Estimated distance in miles from Jonesboro's city center to Ridgecrest Health and Rehabilitation's address, calculated via Google Maps.

Calculate Travel Distance to Ridgecrest Health and Rehabilitation

Add your location

Address

Compare Nursing Homes around Jonesboro

The information below is reported by the Arkansas Department of Human Services, Office of Long Term Care.

5 facilities compared · CMS & AR Dept. of Health data

The Springs of Jonesboro Health & Rehabilitation
NH
HC
MC
PC
Jonesboro
136
Facility 136
AR AVG 84
Rank #40 / 330
77.2% +8%4.31 +61%-8%$0142.8-115-
15
Facility 15
AR AVG 34
Rank #314 / 419
Isaac Gutman$12.1M$4.6M37.9%45134
Ridgecrest Health and Rehabilitation
NH
MC
RC
Jonesboro
152
Facility 152
AR AVG 84
Rank #9 / 330
--4.45 -60%-5%$0505.6-16-
10
Facility 10
AR AVG 34
Rank #342 / 419
Steven Larson$15.0M$5.5M36.4%45327
Lakeside Nursing Center
NH
HC
MC
PC
RC
Lake City
85
Facility 85
AR AVG 84
Rank #171 / 330
82.4% +16%4.81 -54%+3%$22.9k102.0279A+
31
Facility 31
AR AVG 34
Rank #229 / 419
Lisa Yahnke$8.2M$3.6M44.2%45315
Monette Manor
NH
Monette
86
Facility 86
AR AVG 84
Rank #168 / 330
--- -47%-$24.3k1111.0-79-
0
Facility 0
AR AVG 34
Rank #405 / 419
----45477
Craighead Nursing Center -
NH
MC
Jonesboro
121
Facility 121
AR AVG 84
Rank #57 / 330
--------$0----A+
1
Facility 1
AR AVG 34
Rank #397 / 419
County Government---45481

Financial Assistance for
Nursing Home in Arkansas

Ridgecrest Health and Rehabilitation is located in Jonesboro, Arkansas.
Here are the financial assistance programs available to residents in Arkansas.

Get Financial aid guidance

ARChoices

Arkansas Medicaid ARChoices

Age 65+ or 21+ with disability
General Arkansas resident, Medicaid- eligible, nursing home-level care need.
Income Limits (2025) ~$2,829/month 300% FBR, individual
Asset Limits $2,000 (individual), $3,000 (couple).
AR

Rural focus; possible waitlists.

Benefits
Personal care (5-7 hours/day) Meals ($7/meal) Respite care (240 hours/year) Adult day services ($60/day)

Choices in Living Resource Center

Arkansas Choices in Living

Age 60+
General Arkansas resident.
Income Limits No strict limit; prioritizes low-income.
Asset Limits Not applicable.
AR

Limited direct funding; mostly referral-based.

Benefits
Care coordination Limited respite (up to 5 days/year) Transportation assistance (~5 trips/month)

Living Choices Assisted Living Waiver

Arkansas Medicaid Living Choices Assisted Living Waiver

Age 65+
General Arkansas resident, requires nursing home-level care, lives in a Level II assisted living facility.
Income Limits (2025) ~$2,829/month 300% FBR, individual
Asset Limits $2,000 (individual), $3,000 (couple); spousal rules apply.
AR

Limited provider network; excludes Level I facilities (no nursing services).

Benefits
Personal care (~5 hours/day) Medication management Nursing Activities Transportation

Program of All-Inclusive Care for the Elderly (PACE)

Arkansas Medicaid PACE

Age 55+
General Arkansas resident, nursing home-level care, safe with PACE support.
Income Limits (2025) ~$2,829/month 300% FBR
Asset Limits $2,000 (individual), $3,000 (couple).
AR

Limited geographic availability.

Benefits
Primary/preventive care Personal care (5-7 hours/day) Meals Transportation Therapy

Arkansas State Plan Personal Care

Arkansas Medicaid Personal Care Program

Age
General Any age, Arkansas resident, needs ADL/IADL help, Medicaid-eligible.
Income Limits (2025) ~$1,004/month individual
Asset Limits $9,660 (individual), $14,470 (couple).
AR

No nursing home-level care requirement.

Benefits
Personal care (~4-6 hours/day) Homemaker services (e.g., meal prep)

Frequently Asked Questions about Ridgecrest Health and Rehabilitation

Who is the owner of Ridgecrest Health and Rehabilitation?

The legal owner and operator of Ridgecrest Health and Rehabilitation is JBNC, Inc..

Is Ridgecrest Health and Rehabilitation in a walkable area?

Ridgecrest Health and Rehabilitation has a walk score of 10. Car-dependent. Most errands require a car, with limited nearby walkable options.

What is the occupancy rate at Ridgecrest Health and Rehabilitation?

Ridgecrest Health and Rehabilitation's occupancy is 87.6%.

Who is the administrator of Ridgecrest Health and Rehabilitation?

Marlisa Thompson is the administrator of Ridgecrest Health and Rehabilitation.

How many beds does Ridgecrest Health and Rehabilitation have?

Ridgecrest Health and Rehabilitation has 152 beds.

Are there photos of Ridgecrest Health and Rehabilitation?

Yes — there are 22 photos of Ridgecrest Health and Rehabilitation in the photo gallery on this page.

What is the address of Ridgecrest Health and Rehabilitation?

Ridgecrest Health and Rehabilitation is located at 5504 E Johnson Ave, Jonesboro, AR 72401.

Guides for Better Senior Living

Care Cost Calculator: See Prices in Your Area

Nursing Home Data Explorer

Don’t Wait Too Long: 7 Red Flag Signs Your Parent Needs Assisted Living Now

The True Cost of Assisted Living in 2025 – And How Families Are Paying For It

Understanding Senior Living Costs: Pricing Models, Discounts & Financial Assistance