


Total staff
137
Employees
134
Contractors
3
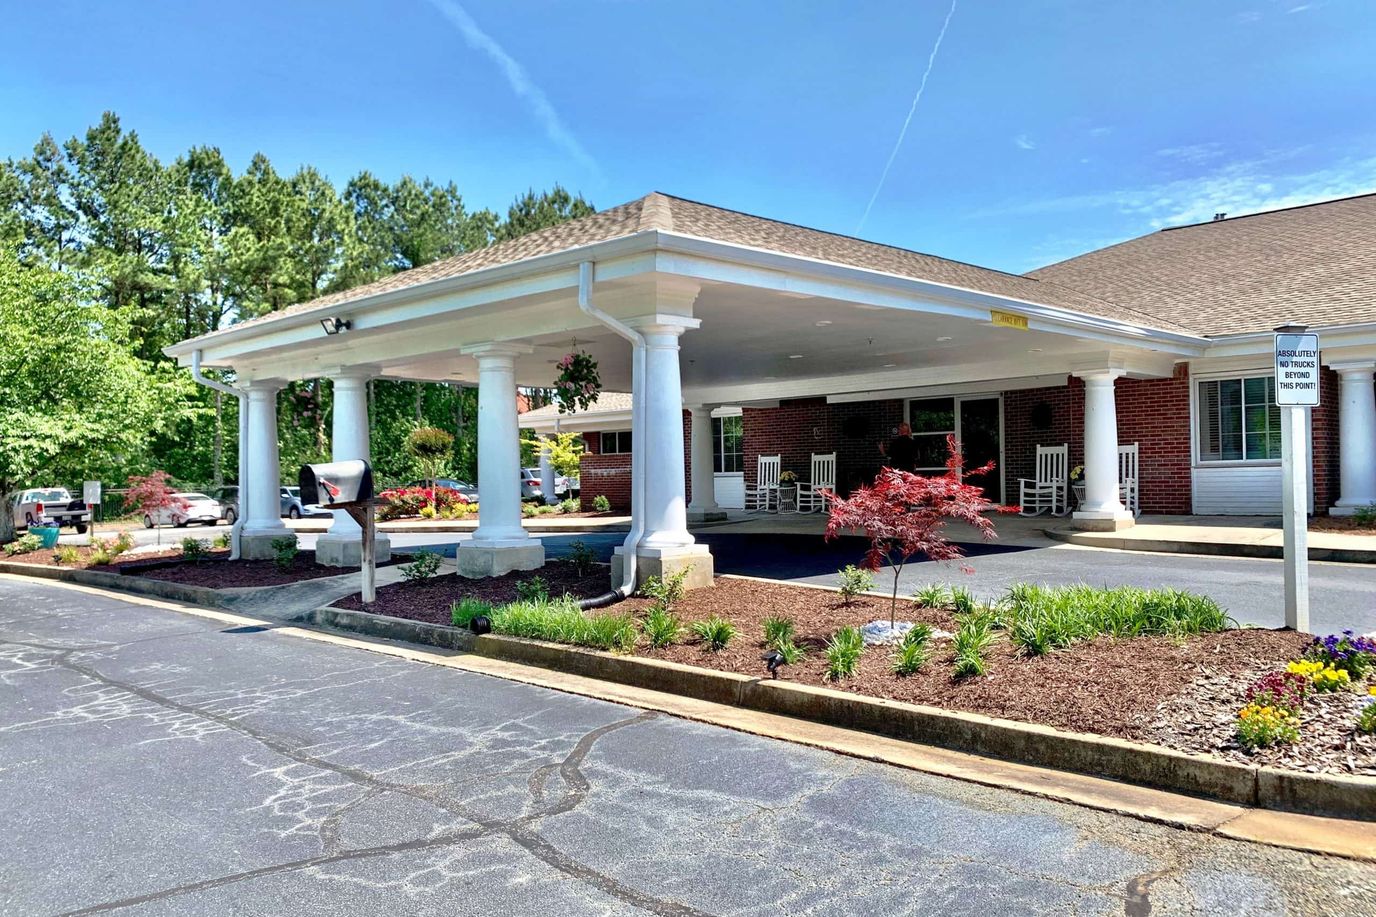
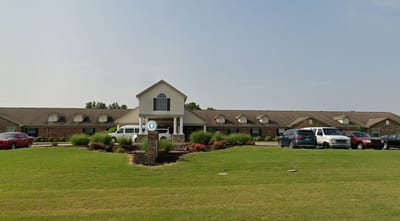
At 136 beds, The Springs of Jonesboro Health & Rehabilitation is a sizable operation for Jonesboro, Arkansas, and its care list reflects that scale. Nursing home care sits alongside hospice, memory care, palliative care, and skilled nursing, all under one roof at 1705 Latourette Dr.
Getting there means driving. The Walk Score comes in at 15, deep in car-dependent range.
Registered nurses put in about 26 minutes per resident a day. LPNs add another 52 minutes. Nurse aides, who handle the bulk of direct hands-on care, contribute roughly two hours and 39 minutes. Add it up and residents get about four hours and 19 minutes of total nursing time daily. That’s a real number, not a marketing phrase, and it’s the kind of figure that actually tells you something about day-to-day staffing.
Occupancy runs at 77.2%, with around 115 residents currently living there, and the average stay lasts 93 days. That average hides two very different populations, though. The facility itself describes its resident mix as split between short-term rehab and longer-term care, and the payment data backs that up: private pay admissions, the largest single group, typically stay just one to two months, while Medicaid admissions run closer to seven months on average. Medicare, Medicaid, and private pay are all accepted here, so families have options regardless of how they’re covering costs.
Residents also have a standing Active Resident Council, a group that meets to discuss policy, care quality, and daily life at the facility. Between the size, the staffing breakdown, and the resident mix, The Springs of Jonesboro looks like a facility built to handle both ends of the nursing home spectrum: people passing through for rehab, and people settling in for long-term care.
| Staff type | Hours / Day / Resident | vs state avg |
|---|---|---|
|
Registered Nurse (RN)
| 26m per day | ▲ 8% State avg: 24m per day · National avg: 41m per day |
|
LPN / LVN
| 52m per day | ▼ 8% State avg: 57m per day · National avg: 52m per day |
|
Nurse Aide
| 2h 39m per day | ▼ 3% State avg: 2h 44m per day · National avg: 2h 21m per day |
|
Weekend Total Nursing
| 3h 10m per day | ▼ 9% State avg: 3h 29m per day · National avg: 3h 26m per day |
|
Physical Therapist
| 3m per day | ▲ 39% State avg: 2m per day · National avg: 4m per day |
|
Weekend RN
| 24m per day | ▲ 53% State avg: 16m per day · National avg: 29m per day |
Reporting period: October 1 – December 31, 2025 (Q4 2025). Source: CMS Payroll-Based Journal report.
Manages medical care and health needs.
Assists with medical care and medications.
Helps with daily care and mobility.
Total hours from contractors
111 contractor hours this quarter
| Certified Nursing Assistant | 79 | 0 | 79 | 27,526 | 92 | 100% | 9.1 |
| Licensed Practical Nurse | 20 | 0 | 20 | 7,399 | 92 | 100% | 9.2 |
| Registered Nurse | 12 | 0 | 12 | 3,842 | 92 | 100% | 8.8 |
| RN Director of Nursing | 4 | 0 | 4 | 1,868 | 72 | 78% | 8.6 |
| Physical Therapy Assistant | 3 | 0 | 3 | 685 | 69 | 75% | 5.8 |
| Dietitian | 1 | 0 | 1 | 636 | 75 | 82% | 8.5 |
| Physical Therapy Aide | 3 | 0 | 3 | 624 | 79 | 86% | 5 |
| Speech Language Pathologist | 4 | 0 | 4 | 523 | 68 | 74% | 6.8 |
| Medication Aide/Technician | 1 | 0 | 1 | 519 | 57 | 62% | 9.1 |
| Administrator | 1 | 0 | 1 | 512 | 64 | 70% | 8 |
| Nurse Practitioner | 1 | 0 | 1 | 512 | 64 | 70% | 8 |
| Respiratory Therapy Technician | 1 | 0 | 1 | 492 | 69 | 75% | 7.1 |
| Mental Health Service Worker | 1 | 0 | 1 | 486 | 64 | 70% | 7.6 |
| Qualified Social Worker | 2 | 0 | 2 | 259 | 69 | 75% | 3.4 |
| Clinical Nurse Specialist | 1 | 0 | 1 | 232 | 33 | 36% | 7 |
| Medical Director | 0 | 1 | 1 | 46 | 17 | 18% | 2.7 |
| Occupational Therapy Assistant | 0 | 1 | 1 | 35 | 6 | 7% | 5.8 |
| Occupational Therapy Aide | 0 | 1 | 1 | 30 | 13 | 14% | 2.3 |
Federal penalties imposed by CMS for regulatory violations, including civil money penalties (fines) and denials of payment for new Medicare/Medicaid admissions.
Source: CMS Penalties Database
No penalties in the past 3 years
No civil money penalties or payment denials were reported in the last 3 years.
These measures show how residents usually do over time at this home, based on health outcomes and preventive care.
Arkansas average: 7.7
Arkansas average: 13.3
Arkansas average: 11.5%
Arkansas average: 13.4%
Arkansas average: 15.1%
Arkansas average: 3.9%
Arkansas average: 4.7%
Arkansas average: 1.3%
Arkansas average: 5.0%
Arkansas average: 1.5%
Arkansas average: 10.5%
Arkansas average: 94.4%
Arkansas average: 96.2%
Arkansas average: 1.97
Arkansas average: 2.18
Arkansas average: 80.9%
Arkansas average: 1.5%
Arkansas average: 77.7%
Arkansas average: 25.2%
Arkansas average: 13.8%
Arkansas average: 0.8%
Arkansas average: 53.7%
Arkansas average: 50.6%
Quality measures are calculated from Minimum Data Set (MDS) assessments. For most measures, lower percentages indicate better care quality.
27% of new residents, usually for short-term rehab.
42% of new residents, often for short stays.
31% of new residents, often for long-term daily care.
Source: CMS Long-Term Care Facility Characteristics (Data as of Jan 2026)
Residents meet regularly to discuss policies, care quality, and activities
Organized group of residents that meets regularly to discuss facility policies, quality of life, and activities.
Data sourced from CMS Long-Term Care Facility Characteristics quarterly report. Payer mix reflects the current resident census by primary payment source.
Historical financial and operational data for The Springs of Jonesboro Health & Rehabilitation from 2012–2024, based on CMS SNF Cost Reports.
Key figures below are for fiscal year ending in 06/2024.
Based on CMS SNF Cost Report for fiscal year ending in 06/2024.
This home supports both short-term rehab and long-term care, with residents staying for a wide range of durations.
New residents most often arrive under private pay (42% of admissions), and a typical private pay stay runs around 1 - 2 months.
Coverage residents most often arrive under.
Coverage residents most often leave under.
![]() 2.6 miles from city center
2.6 miles from city center
![]() Estimated distance in miles from Jonesboro's city center to The Springs of Jonesboro Health & Rehabilitation's address, calculated via Google Maps.
Estimated distance in miles from Jonesboro's city center to The Springs of Jonesboro Health & Rehabilitation's address, calculated via Google Maps.
Add your location
The information below is reported by the Arkansas Department of Human Services, Office of Long Term Care.
| The Springs of Jonesboro Health & Rehabilitation | NH HOS MC PC SNF | Jonesboro | 136
Facility
136
AR AVG
84
Rank
#41 / 331 |
84.9%
Facility
84.9%
AR AVG
65.9
Rank
#28 / 167 | +29% | 4.31
Facility
4.31
AR AVG
4.67
Rank
#130 / 191 | +61% | -8% | $0
Facility
$0
AR AVG
$27.3k
Rank
#1 / 196 | 14
Facility
14
AR AVG
21.8
Rank
#40 / 195 | 2.8
Facility
2.8
AR AVG
5.3
Rank
#8 / 195 | - | 115 | - |
15
Facility
15
AR AVG
34
Rank
#311 / 416 | Isaac Gutman | $12.1MFiscal year ending 06/2024
Facility
$12.1MFiscal year ending 06/2024
AR AVG
$9.4M
Rank
#54 / 189 | $4.6MFiscal year ending 06/2024
Facility
$4.6MFiscal year ending 06/2024
AR AVG
$3.4M
Rank
#62 / 189 | 37.9%Fiscal year ending 06/2024
Facility
37.9%Fiscal year ending 06/2024
AR AVG
37.9%
Rank
#139 / 189 | 45134 | ||||
| Craighead Nursing Center | - | NH MC SNF | Jonesboro | 121
Facility
121
AR AVG
84
Rank
#58 / 331 | - | - | -
Facility
-
AR AVG
4.67
Rank
#30 / 191 | - | - | - | - | - | $0
Facility
$0
AR AVG
$27.3k
Rank
#1 / 196 | - | - | - | - | A+ |
1
Facility
1
AR AVG
34
Rank
#394 / 416 | County Government | - | - | - | 45481 |
| Ridgecrest Health and Rehabilitation | NH MC RC SNF | Jonesboro | 152
Facility
152
AR AVG
84
Rank
#9 / 331 | - | - | 4.45
Facility
4.45
AR AVG
4.67
Rank
#104 / 191 | -60% | -5% | $0
Facility
$0
AR AVG
$27.3k
Rank
#1 / 196 | 50
Facility
50
AR AVG
21.8
Rank
#192 / 195 | 5.6
Facility
5.6
AR AVG
5.3
Rank
#121 / 195 | - | 16 | - |
10
Facility
10
AR AVG
34
Rank
#339 / 416 | Steven Larson | $15.0MFiscal year ending 12/2023
Facility
$15.0MFiscal year ending 12/2023
AR AVG
$9.4M
Rank
#3 / 189 | $5.5MFiscal year ending 12/2023
Facility
$5.5MFiscal year ending 12/2023
AR AVG
$3.4M
Rank
#26 / 189 | 36.4%Fiscal year ending 12/2023
Facility
36.4%Fiscal year ending 12/2023
AR AVG
37.9%
Rank
#184 / 189 | 45327 | ||||
| Lakeside Nursing Center | NH HOS MC PC RC SNF | Lake City | 85
Facility
85
AR AVG
84
Rank
#172 / 331 |
82.4%
Facility
82.4%
AR AVG
65.9
Rank
#38 / 167 | +25% | 4.81
Facility
4.81
AR AVG
4.67
Rank
#61 / 191 | -54% | +3% | $22.9k
Facility
$22.9k
AR AVG
$27.3k
Rank
#173 / 196 | 10
Facility
10
AR AVG
21.8
Rank
#12 / 195 | 2.0
Facility
2.0
AR AVG
5.3
Rank
#4 / 195 | 2 | 70 | A+ |
31
Facility
31
AR AVG
34
Rank
#228 / 416 | Lisa Yahnke | $8.2MFiscal year ending 12/2023
Facility
$8.2MFiscal year ending 12/2023
AR AVG
$9.4M
Rank
#85 / 189 | $3.6MFiscal year ending 12/2023
Facility
$3.6MFiscal year ending 12/2023
AR AVG
$3.4M
Rank
#108 / 189 | 44.2%Fiscal year ending 12/2023
Facility
44.2%Fiscal year ending 12/2023
AR AVG
37.9%
Rank
#139 / 189 | 45315 | ||||
| Monette Manor | NH SNF | Monette | 86
Facility
86
AR AVG
84
Rank
#169 / 331 |
91.4%
Facility
91.4%
AR AVG
65.9
Rank
#8 / 167 | +39% | - | -47% | - | $24.3k
Facility
$24.3k
AR AVG
$27.3k
Rank
#175 / 196 | 11
Facility
11
AR AVG
21.8
Rank
#21 / 195 | 11.0
Facility
11.0
AR AVG
5.3
Rank
#192 / 195 | - | 79 | - |
0
Facility
0
AR AVG
34
Rank
#402 / 416 | - | - | - | - | 45477 |
The Springs of Jonesboro Health & Rehabilitation is located in Jonesboro, Arkansas.
Here are the financial assistance programs available to residents in Arkansas.
The Springs of Jonesboro Health & Rehabilitation has a walk score of 15. Car-dependent. Most errands require a car, with limited nearby walkable options.
The Springs of Jonesboro Health & Rehabilitation's occupancy is 77.2%.
No, The Springs of Jonesboro Health & Rehabilitation has a no-pet policy.
The Springs of Jonesboro Health & Rehabilitation is registered as a for-profit.
Yes — there are 4 photos of The Springs of Jonesboro Health & Rehabilitation in the photo gallery on this page.
The Springs of Jonesboro Health & Rehabilitation is located at 1705 Latourette Dr, Jonesboro, AR 72404.
(870) 935-7770 will put you in contact with the team at The Springs of Jonesboro Health & Rehabilitation.
Care Cost Calculator: See Prices in Your Area
Nursing Home Data Explorer
Don’t Wait Too Long: 7 Red Flag Signs Your Parent Needs Assisted Living Now
The True Cost of Assisted Living in 2025 – And How Families Are Paying For It
Understanding Senior Living Costs: Pricing Models, Discounts & Financial Assistance


