

Total health inspections
3
Florida average 4.3
Last Health inspection on Aug 2025

We arrange tours, appointments, and even moving support so you don’t have to
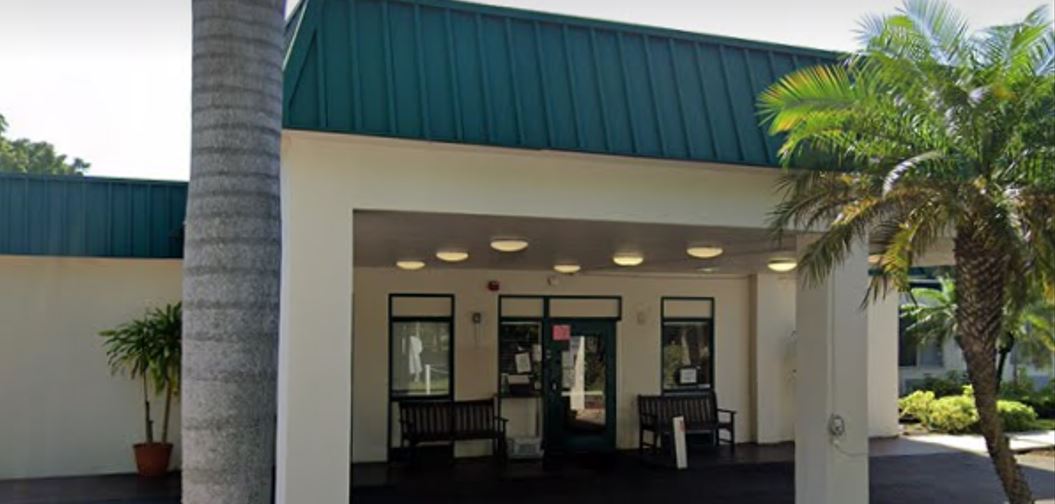

Nestled in Tampa, Florida, Woodbridge Rehabilitation and Health Center is a vibrant community offering sub-acute care, rehabilitation services, and 24-hour skilled nursing care. It prides itself in producing measurable progress with its residents given its staff’s ability to provide quality care which is achieved through outcome-oriented rehabilitative techniques and a multidisciplinary team of experts. This skilled nursing facility is dedicated to supporting residents in maximizing their potential through an improved quality of life.
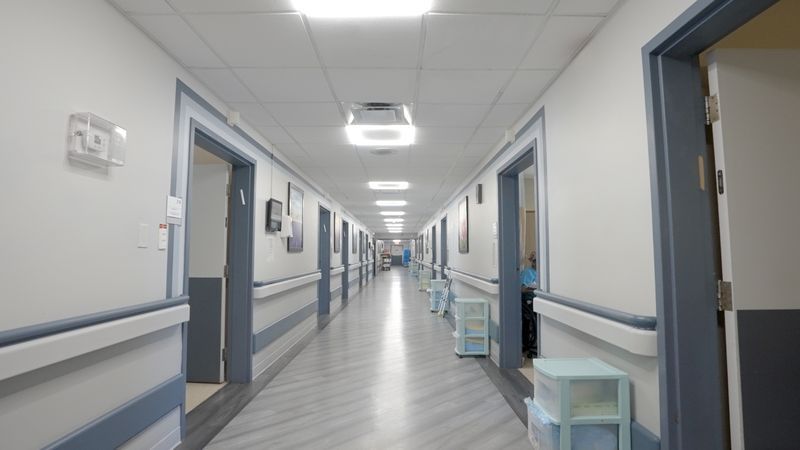
Woodbridge Rehabilitation and Health Center is an amenity-rich care center extending various activities and services. Nutritious meals and snacks, daily programs, and community outings are some of the things residents can enjoy while staying at this wonderful home.
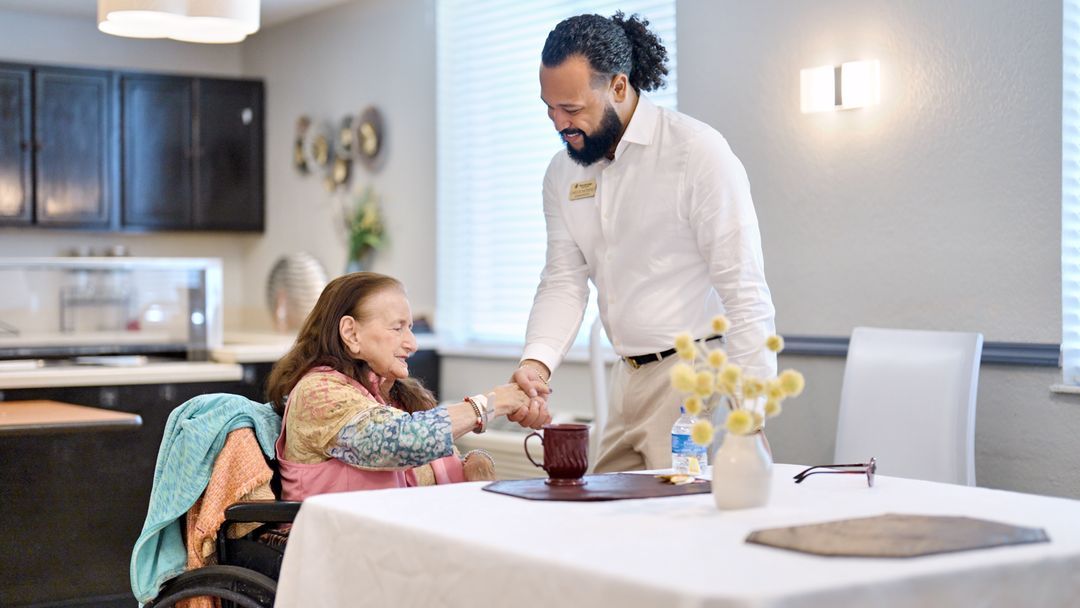
Carlos Moreno is the Administrator at Woodbridge Rehabilitation & Health Center. He holds a bachelor's degree in healthcare management and specializes in medical records, business operations, and human resources. Carlos is dedicated to enhancing the residents' experience through compassionate leadership and effective problem-solving, making a meaningful difference in the lives of the elderly and their families.
 Official CMS rating based on health inspections, staffing and quality measures.
Official CMS rating based on deficiencies found during state health inspections.
Official CMS rating based on nurse staffing hours per resident per day.
Official CMS rating based on clinical outcomes for residents.
Average daily nursing hours per resident (adjusted for acuity). Higher values indicate more nursing time per resident.
Hours of care per resident per day, broken down by staff type. Data from CMS Medicare.
Registered nurse hours per resident per day.
Official CMS rating based on health inspections, staffing and quality measures.
Official CMS rating based on deficiencies found during state health inspections.
Official CMS rating based on nurse staffing hours per resident per day.
Official CMS rating based on clinical outcomes for residents.
Average daily nursing hours per resident (adjusted for acuity). Higher values indicate more nursing time per resident.
Hours of care per resident per day, broken down by staff type. Data from CMS Medicare.
Registered nurse hours per resident per day.
Offers a balance of services and community atmosphere.
That suggests steady demand, but availability may be limited.
This home supports both short-term rehab and long-term care, with residents staying for a wide range of durations.
37% of new residents, usually for short-term rehab.
57% of new residents, often for short stays.
6% of new residents, often for long-term daily care.
The portion of the home's budget spent on staff, including nurses, caregivers, and other employees who support care and operations.
All remaining costs needed to run the home, such as food, utilities, building maintenance, supplies and administrative expenses.
Florida average 4.3
Last Health inspection on Aug 2025
Health citations are formal notices following inspections when they fail to comply with safety and care standards.
All 21 citations resulted from standard inspections.
Florida average: 0.8
Florida average: 0.4
Data sourced from CMS Health Deficiencies reports. Citation severity codes range from A (least serious) to L (most serious). Immediate Jeopardy (J-L) citations indicate situations where the facility's noncompliance has placed residents at risk of death or serious harm.
Nursing Home 24/7 care needed
Assisted Living For seniors needing help with daily tasks but not full-time nursing.
Nursing Home 24/7 care needed
Assisted Living For seniors needing help with daily tasks but not full-time nursing.
Nursing Home 24/7 care needed
Assisted Living For seniors needing help with daily tasks but not full-time nursing.
Nursing Home 24/7 care needed
Assisted Living For seniors needing help with daily tasks but not full-time nursing.
Nursing Home 24/7 care needed
Assisted Living For seniors needing help with daily tasks but not full-time nursing.
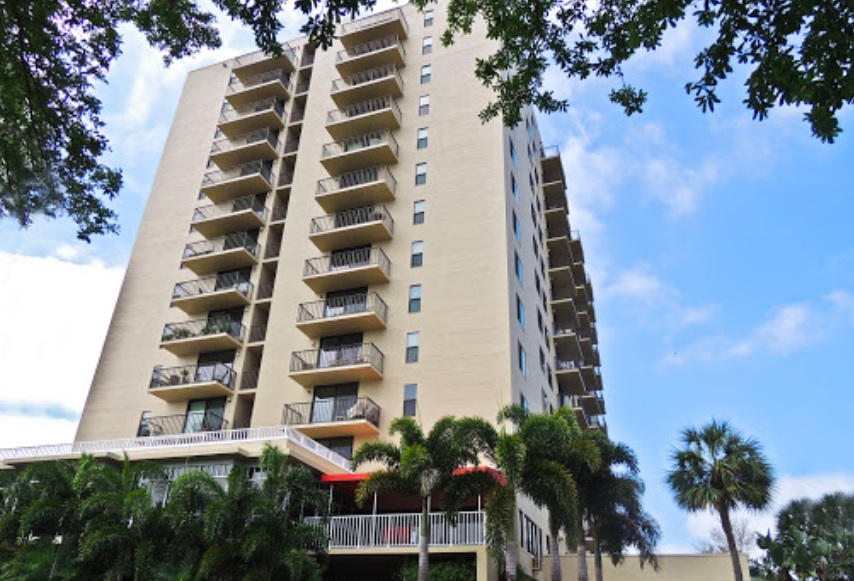 Canterbury Tower
 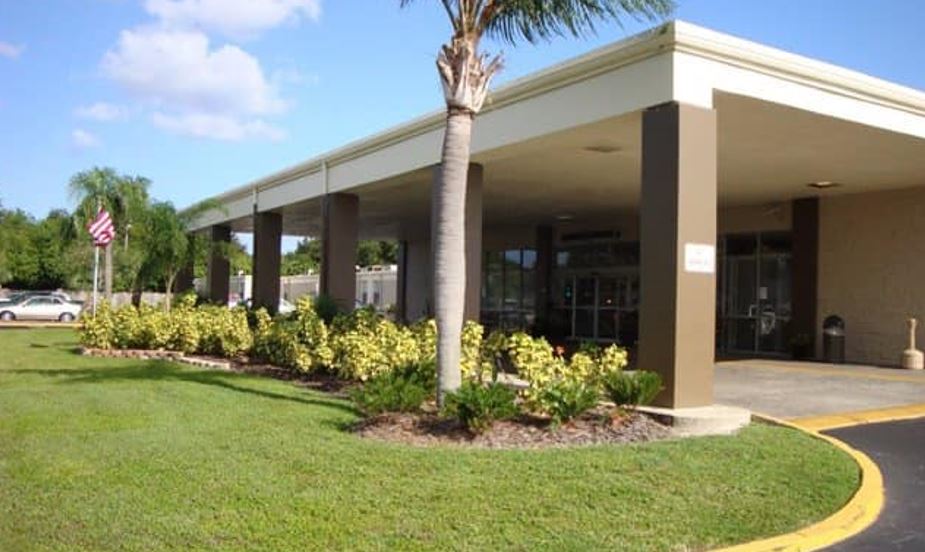 Gandy Crossing Care Center
  Bayshore Pointe Nursing & Rehab Center
  Woodbridge Rehabilitation & Health Center
  Carrollwood Care Center
![]() 8.1 miles from city center — 4.76 miles to nearest hospital (AdventHealth Carrollwood Hospital)
8.1 miles from city center — 4.76 miles to nearest hospital (AdventHealth Carrollwood Hospital)
![]() 8720 Jackson Springs Rd, Tampa, FL 33615
8720 Jackson Springs Rd, Tampa, FL 33615
Add your location
Source: CMS Payroll-Based Journal (Q2 2025)
| Role ⓘ | Count ⓘ | Avg Shift (hrs) ⓘ | Uses Contractors? ⓘ |
|---|---|---|---|
| Registered Nurse | 25 | 7.9 | No |
| Licensed Practical Nurse | 7 | 7.4 | No |
| Certified Nursing Assistant | 63 | 7.9 | No |
| Role ⓘ | Employees ⓘ | Contractors ⓘ | Total Staff ⓘ | Total Hours ⓘ | Days Worked ⓘ | % of Days ⓘ | Avg Shift (hrs) ⓘ |
|---|---|---|---|---|---|---|---|
| Certified Nursing Assistant | 63 | 0 | 63 | 22,858 | 91 | 100% | 7.9 |
| Registered Nurse | 25 | 0 | 25 | 7,520 | 91 | 100% | 7.9 |
| Clinical Nurse Specialist | 5 | 0 | 5 | 2,226 | 91 | 100% | 8.7 |
| Licensed Practical Nurse | 7 | 0 | 7 | 1,698 | 91 | 100% | 7.4 |
| Respiratory Therapy Technician | 6 | 0 | 6 | 1,587 | 76 | 84% | 7.1 |
| Physical Therapy Aide | 7 | 0 | 7 | 1,558 | 78 | 86% | 6.6 |
| Speech Language Pathologist | 5 | 0 | 5 | 1,520 | 70 | 77% | 6.9 |
| Dietitian | 2 | 0 | 2 | 1,005 | 80 | 88% | 8.1 |
| Qualified Social Worker | 3 | 0 | 3 | 957 | 66 | 73% | 7.6 |
| RN Director of Nursing | 2 | 0 | 2 | 900 | 81 | 89% | 6.9 |
| Physical Therapy Assistant | 4 | 0 | 4 | 740 | 63 | 69% | 7.6 |
| Administrator | 1 | 0 | 1 | 496 | 62 | 68% | 8 |
| Mental Health Service Worker | 1 | 0 | 1 | 488 | 61 | 67% | 8 |
| Nurse Practitioner | 2 | 0 | 2 | 452 | 57 | 63% | 7.9 |
| Dental Services Staff | 1 | 0 | 1 | 446 | 59 | 65% | 7.6 |
| Feeding Assistant | 0 | 15 | 15 | 139 | 52 | 57% | 1 |
| Diagnostic X-ray Services Staff | 0 | 1 | 1 | 33 | 12 | 13% | 2.8 |
| Other Physician | 0 | 1 | 1 | 6 | 2 | 2% | 3 |
| Physician Assistant | 0 | 1 | 1 | 1 | 1 | 1% | 1.3 |
Source: CMS Long-Term Care Facility Characteristics (Data as of Jan 2026)
Residents meet regularly to discuss policies, care quality, and activities
Organized group of residents that meets regularly to discuss facility policies, quality of life, and activities.
Data sourced from CMS Long-Term Care Facility Characteristics quarterly report. Payer mix reflects the current resident census by primary payment source.
These measures show how residents usually do over time at this home, based on health outcomes and preventive care.
Florida average: 7.4
Florida average: 12.4
Florida average: 10.5%
Florida average: 12.9%
Florida average: 13.5%
Florida average: 2.6%
Florida average: 5.4%
Florida average: 0.9%
Florida average: 6.0%
Florida average: 3.3%
Florida average: 8.0%
Florida average: 97.7%
Florida average: 99.2%
Florida average: 2.10
Florida average: 1.18
Florida average: 94.0%
Florida average: 1.5%
Florida average: 94.7%
Florida average: 26.2%
Florida average: 9.3%
Florida average: 0.8%
Florida average: 53.7%
Florida average: 50.6%
Quality measures are calculated from Minimum Data Set (MDS) assessments. For most measures, lower percentages indicate better care quality.
Federal penalties imposed by CMS for regulatory violations, including civil money penalties (fines) and denials of payment for new Medicare/Medicaid admissions.
Source: CMS Penalties Database (Data as of Jan 2026)
Florida average: $72K
Florida average: 2.6
Florida average: 0.1
Penalties are imposed by CMS for violations of federal nursing home regulations.
Last updated: Jan 2026
Historical financial and operational data for Woodbridge Rehabilitation & Health Center based on CMS SNF Cost Reports.
Loading trend charts...
Care Cost Calculator: See Prices in Your Area
Nursing Home Data Explorer
Don’t Wait Too Long: 7 Red Flag Signs Your Parent Needs Assisted Living Now
The True Cost of Assisted Living in 2025 – And How Families Are Paying For It
Understanding Senior Living Costs: Pricing Models, Discounts & Financial Assistance

Touring a community? Use this expert-backed checklist to stay organized, ask the right questions, and find the perfect fit.
We'll send you a PDF version of the touring checklist.


