Bayshore Pointe Nursing & Rehab Center
Nursing Home & Respite Care · Tampa, FL
CMS overall rating Info CMS (the Centers for Medicare & Medicaid Services) is the federal agency that rates nursing home quality. Its Overall Rating runs from 1 to 5 stars, combining health inspections, staffing, and quality measures, with inspections weighted most heavily.

Bayshore Pointe Nursing & Rehab Center

Nursing Home & Respite Care · Tampa, FL
CMS overall rating Info CMS (the Centers for Medicare & Medicaid Services) is the federal agency that rates nursing home quality. Its Overall Rating runs from 1 to 5 stars, combining health inspections, staffing, and quality measures, with inspections weighted most heavily.
Calculator: See prices in your area
Bayshore Pointe Nursing & Rehab Center accepts Medicaid, Medicare, and private pay.

Overview of Bayshore Pointe Nursing & Rehab Center

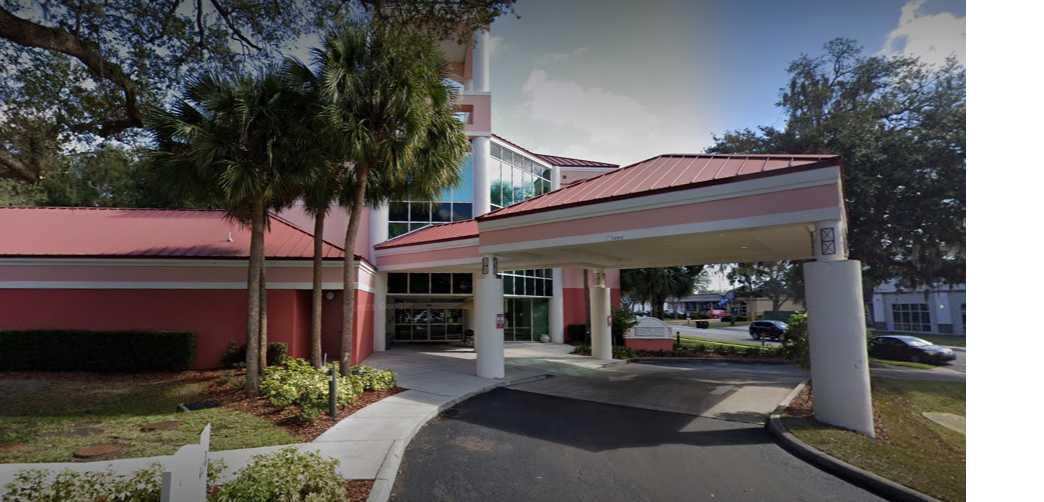
A recipient of the 5-Star Quality Measures rating from the Centers for Medicare and Medicaid, Bayshore Pointe Rehabilitation Center is a skilled nursing facility in Tampa. It offers a wide range of clinical services such as infusion therapy, wound care, enteral therapy, and rehabilitation, to name a few, through its subacute care, long-term care, respite care, and hospice care programs. It promotes accessible medical services as it accepts numerous insurance providers including BayCare, Aetna, Medicare, TRICARE, Coventry, Medicaid, and DevotedHealth.
Their dedication to providing care reflects in their specialty programs specifically designed to serve patients with complex illnesses or treatment plans that can’t be fully addressed using their current resources. Through these programs wherein additional training, education, and specialized equipment are provided to staff and caregivers, a holistic recovery is assured for each individual. Bayshore Pointe Nursing and Rehabilitation Center ensures all of its residents and patients are cared for with its amazing staff and holistic approach to giving quality care.

(813) 261-5500

Quality ratings

Measured by Centers for Medicare & Medicaid Services (CMS)

Overall rating Info The Overall CMS Rating combines results from health inspections, staffing levels and quality measures. Health inspections carry the most weight. Staffing and quality scores can increase or decrease the final rating based on performance compared to state and national standards.
▼ 5.5% Below FL avg. ▼ 5.5% Below FL avg.FL average: 3.2Click the badge to see the full State ranking.Click here to see the full State ranking.
Health Inspection Info Based on the results of the facility's three most recent standard inspections and any complaint investigations. CMS reviews the number, scope, and severity of deficiencies, with more recent findings weighted more heavily.
▼ 28.9% Below FL avg. ▼ 28.9% Below FL avg.FL average: 2.8Click the badge to see the full State ranking.Click here to see the full State ranking.
Staffing Info Measures average nursing staff hours per resident per day, including Registered Nurses (RNs) and total nursing staff. Ratings are adjusted based on the level of care residents require and are compared to state and national benchmarks.
▲ 18.2% Above FL avg. ▲ 18.2% Above FL avg.FL average: 3.4Click the badge to see the full State ranking.Click here to see the full State ranking.
Quality Measures Info Based on clinical and physical health indicators reported to CMS, such as hospital readmissions, falls, pressure ulcers, and improvements in mobility. These measures reflect how well residents' health needs are being managed.
▲ 23.2% Above FL avg. ▲ 23.2% Above FL avg.FL average: 4.1Click the badge to see the full State ranking.Click here to see the full State ranking.

Staffing hours breakdown

Info Daily nursing hours per resident by staff type, reported to CMS. Higher is generally better — compare this facility to state and national averages to see where staffing stands.

Hours per resident per day — compared to Florida state averages

Total nursing care / resident Info This home is ranked 126th out of 253 homes in Florida for nurse hours. Total adjusted nursing hours per resident per day, combining RN, LPN, and aide time. CMS adjusts this for case-mix so facilities can be fairly compared.
3h 53m per day
Rank #126 / 253Nurse hours — State benchmarkedThis home is ranked 126th out of 253 homes in Florida. Shows adjusted nurse hours per resident per day benchmarked to the Florida average, with a ranking across 253 Florida facilities. More hours mean more direct care. The national average is about 3.5 hrs; below 3.0 is a red flag.Rankings are based only on facilities in Florida that report data for that category. Facilities without available data are excluded from the ranking.Click the rank badge to see the full State ranking.Click here to see the full State ranking.
This facility Florida avg (4h 2m per day)
vs Florida avg
-4%

1 of 6 metrics below state avg

Standout metric Physical Therapist is +145% above state avg
Staff typeHours / Day / Residentvs state avg
Registered Nurse (RN) Info RNs hold the highest nursing license and can assess residents, interpret test results, and direct care plans. More RN hours per day often signals stronger clinical oversight and faster response to health changes. 57m per day ▲ 30% State avg: 44m per day · National avg: 41m per day
LPN / LVN Info Licensed Practical Nurses (LPNs) or Licensed Vocational Nurses (LVNs) deliver routine hands-on care — medication administration, wound dressing, and monitoring vital signs. They work under RN supervision and make up a large share of daily bedside care. 33m per day ▼ 30% State avg: 47m per day · National avg: 52m per day
Nurse Aide Info Certified Nurse Aides (CNAs) provide the most direct day-to-day assistance: bathing, dressing, feeding, and mobility. Nurse aide hours are typically the largest staffing category and directly affect residents' quality of life. 2h 18m per day ■ Avg State avg: 2h 20m per day · National avg: 2h 21m per day
Weekend Total Nursing Info Combined nursing hours (RN + LPN + Nurse Aide) per resident per day on weekends. Staffing often drops on weekends — this figure reveals whether the facility maintains adequate coverage outside of weekday hours. 3h 29m per day ■ Avg State avg: 3h 31m per day · National avg: 3h 26m per day
Physical Therapist Info Hours per resident per day provided by licensed Physical Therapists (PTs) or PT Assistants. PT services help residents recover mobility after injury or illness and are especially important for post-acute (short-stay) rehabilitation. 12m per day ▲ 145% State avg: 5m per day · National avg: 4m per day
Weekend RN Info Registered nurse hours specifically on weekends. Facilities sometimes reduce RN presence on Saturdays and Sundays — a low weekend RN figure compared to weekday hours can indicate reduced clinical oversight when most administrative staff are absent. 44m per day ▲ 37% State avg: 32m per day · National avg: 29m per day

Capacity and availability

This home usually has availability

Lower occupancy than the Florida average: 84.3%
Occupancy rate
76.3% Rank #204 / 258Occupancy rate — State benchmarkedThis home is ranked 204th out of 258 homes in Florida. Shows this facility's occupancy rate versus the Florida average, with its Statewide rank out of 258. Higher occupancy signals strong local demand and financial stability.Rankings are based only on facilities in Florida that report data for that category. Facilities without available data are excluded from the ranking.Click the rank badge to see the full State ranking.Click here to see the full State ranking.
Avg. Length of Stay
69 days
Bed community size
117-bed community Rank #340 / 1074Bed count — State benchmarkedThis home is ranked 340th out of 1074 homes in Florida. Shows this facility's certified or reported bed count compared to other Florida facilities. Larger communities may offer more amenities, programs, and on-site services for residents and families.Rankings are based only on facilities in Florida that report data for that category. Facilities without available data are excluded from the ranking.Click the rank badge to see the full State ranking.Click here to see the full State ranking.
A larger shared setting that may offer more common spaces and organized community services.
Years in operation
22 years in operation
A longer operating history, which may indicate experience navigating regulations and delivering ongoing care.
Walk Score
Walk Score: 71 / 100 Rank #203 / 1486Walk Score — State benchmarkedThis home is ranked 203rd out of 1486 homes in Florida. Shows how walkable this facility's neighborhood is compared to the average Walk Score across Florida facilities. Higher scores benefit residents, families, and staff.Rankings are based only on facilities in Florida that report data for that category. Facilities without available data are excluded from the ranking.Click the rank badge to see the full State ranking.Click here to see the full State ranking.
Very walkable. Most errands can be accomplished on foot, and many essentials are within a short walk.
BBB Rating
BBB Rating: A+ (Not Accredited)
An independent rating from the Better Business Bureau based on factors such as complaint history, transparency, and business practices.
How BBB ratings work

About this community

License Details

CMS Certification Number105650
AccreditationsJoint Commission Approved, CMS 5-Star Center Recognition, U.S. News & World Report Best Nursing Homes 2025 – Short Term Rehab, U.S. News & World Report Best Nursing Homes 2026 – Long Term Rehab

Staffing

Key information about the people who lead and staff this community.

Leadership

ContactEllie Shutt, Administrator

Payment & Insurance

2 services
Accept Medicaid
Accept Medicare

Therapy & Rehabilitation

3 services
Rehabilitation Services
Respite Care
Short-Term Rehab

Staffing & Medical

1 service
24-Hour Staffing

Additional Services

4 services
Short-Term Rehabilitation
In-Patient Residential Care
Outpatient Rehabilitation
Specialty Programs

Additional Policies & Features

Pets Allowed
Admission CriteriaPatients must have an admission order from their primary physician.

Amenities & Lifestyle

Private/Semi Private Rooms
Landscaped Grounds
Therapy Up To 7 Days Per Week
Activities
Rehabilitation Gym
Dining Areas
Laundry Services
Courtyard
Library
Indoor/Outdoor Common Areas
Phone/Cable Tv Service
Salon Services
ActivitiesActivities provided daily.
Specific ProgramsShort-Term Stay, In-Patient Residential Stay, Telemedicine, Post COVID-19 Recovery Program
Operating Hours24/7

Dining & Nutrition

Food DescriptionFood is served but has received mixed reviews regarding quality.

Contact Bayshore Pointe Nursing & Rehab Center

Inspection History

In Florida, the Agency for Health Care Administration (AHCA) is the primary authority that conducts unannounced inspections and completes official health quality reports for all healthcare facilities.

Since 2021 · 5 years of data 34 citations
We don't publish a score for nursing homes with fewer than three inspections on record. This would unfairly reward providers with limited inspection history or those that have not been operating long enough to be cited.

Inspection score unavailable

Not enough inspection history to generate a score.

Average score for Florida nursing homes: B 83/100

Inspection score not available. Not enough inspection history to score against the Florida benchmark.

Inspection Scorecard Info This scorecard compares key inspection, citation, and complaint metrics at this facility against the Florida state average. Metrics rated ≥15% worse than average are highlighted in red; those ≥15% better are highlighted in green.

Since 2021 vs. Florida state average
Overall vs. FL average 2 Worse Metrics worse than Florida average:
• Total citations (3% above)
• Citations per year (3% above)
0 Better No metrics in this bucket.
Latest Inspection September 21, 2024 Routine

Citations Info Citations are formal regulatory issues recorded during state inspections.

This FacilityFL Averagevs. FL Avg
Total citations Info Formal regulatory issues recorded by inspectors across all inspection types. 3433 This facility has 3% more total citations than a typical Florida nursing home (34 vs. FL avg 33).↑ 3% worse Rank #1 / 919 Total citations — State benchmarked This home is ranked 1st out of 919 homes in Florida. Shows this facility's total citations compared to the Florida average among 919 comparable communities in the ranking pool. Rankings are based only on facilities in Florida that report data for that category. Facilities without available data are excluded from the ranking.
Citations per year Info Average citations per year since 2021. 6.86.6 This facility has 3% more citations per year than a typical Florida nursing home (6.8 vs. FL avg 6.6).↑ 3% worse

Inspection Reports Summary Info An editor-reviewed summary of the themes and findings across this facility's recent inspection reports.

  • September 21, 2024 inspection found 12 deficiencies including unsanitary resident rooms, medication errors, infection control failures, food safety violations, and inadequate pressure ulcer and enteral nutrition care.
  • Complaint investigations in 2023 substantiated failures in discharge planning, medication administration, pain management delays, and lack of a functioning Quality Assurance Committee.
  • No immediate jeopardy or fines were cited in any inspections, and complaint investigations identified specific issues without license actions or harm-level citations.

Health Inspection History

Inspections since 2021
Total health inspections 5

Florida average 4.3


Last Health inspection on Sep 2024

Total health citations
33 Rank #223 / 252Health citations — State benchmarkedThis home is ranked 223rd out of 252 homes in Florida. Shows this facility's total health deficiency citations benchmarked to the Florida State average, with a ranking across all 252 FL facilities. Lower citation counts earn a better rank.Rankings are based only on facilities in Florida that report data for that category. Facilities without available data are excluded from the ranking.Click the rank badge to see the full State ranking.Click here to see the full State ranking.

Florida average 19.7

Citations per inspection
6.6 Rank #212 / 252Citations per inspection — State benchmarkedThis home is ranked 212th out of 252 homes in Florida. Shows average deficiency citations per CMS inspection for this facility versus the Florida mean across 252 facilities with citation data. Lower is better.Rankings are based only on facilities in Florida that report data for that category. Facilities without available data are excluded from the ranking.Click the rank badge to see the full State ranking.Click here to see the full State ranking.

Florida average 4.48


Health citations are formal notices following inspections when they fail to comply with safety and care standards.

27 of 33 citations resulted from standard inspections; 5 of 33 resulted from complaint investigations; and 1 of 33 came from combined inspections (standard and complaint).

Breakdown of citation severity (last 5 years)
Critical health citations
0
100% better than Florida average

Florida average: 0.8


Serious health citations
1
150% worse than Florida average

Florida average: 0.4

0 critical citations Florida average: 0.8

1 serious citation Florida average: 0.4

32 moderate citations Florida average: 18.4

0 minor citations Florida average: 0.2
Citations history (last 5 years)
Administration moderate citation Sep 21, 2024
Corrected

Infection Control moderate citation Sep 21, 2024
Corrected

Nursing Services moderate citation Sep 21, 2024
Corrected

Nutrition moderate citation Sep 21, 2024
Corrected

Staffing Data

Reporting period: October 1 – December 31, 2025 (Q4 2025). Source: CMS Payroll-Based Journal report.

Total staff 144
Employees 140
Contractors 4
Staff to resident ratio 1.35 : 1
9% fewer staff per resident than Florida average
Florida average ratio: 1.47 : 1 Florida average ratio: 1.47 : 1See full Florida ranking
Avg staff/day 64
Average shift 8 hours
0% compared with Florida average
Florida average: 7.9 hours Florida average shift: 7.9 hoursSee full Florida ranking
Total staff hours (quarter) 47,016

Nursing staff breakdown

Q4 2025 · Oct 1 – Dec 31 More info This data comes from the CMS Payroll-Based Journal report covering October 1 – December 31, 2025.
Registered Nurse

Manages medical care and health needs.

RN Staff Info 26 total: 25 full-time employees and 1 contractor. 26
Average shift length Info Average shift length. Calculated as total hours divided by days worked and average staff per day. 8.2 hours
Licensed Practical Nurse

Assists with medical care and medications.

LPN Staff Info All 16 LPN Staff are full-time employees. No contractors work on this role. 16
Average shift length Info Average shift length. Calculated as total hours divided by days worked and average staff per day. 8.1 hours
Certified Nursing Assistant

Helps with daily care and mobility.

CNA Staff Info All 56 CNA Staff are full-time employees. No contractors work on this role. 56
Average shift length Info Average shift length. Calculated as total hours divided by days worked and average staff per day. 8.4 hours

Contractor staffing

Q4 2025 · Oct 1 – Dec 31 More info This data comes from the CMS Payroll-Based Journal report covering October 1 – December 31, 2025.

Total hours from contractors

0.4%

176 contractor hours this quarter

Occupational Therapy Aide: 3 Registered Nurse: 1

Staff by category

Q4 2025 · Oct 1 – Dec 31 More info This data comes from the CMS Payroll-Based Journal report covering October 1 – December 31, 2025.
Certified Nursing Assistant5605622,28092100%8.4
Registered Nurse251267,86792100%8.2
Licensed Practical Nurse160165,32092100%8.1
Respiratory Therapy Technician6061,9807885%7.3
Physical Therapy Assistant5051,3907278%7.1
Dietitian2021,0297885%8.1
Speech Language Pathologist4041,0108188%6.8
Mental Health Service Worker2029446571%8
Clinical Nurse Specialist8089026571%5.7
Physical Therapy Aide3038898289%7.2
Qualified Social Worker6067447177%6.1
Occupational Therapy Aide1346796672%7.1
Occupational Therapist1015355964%9.1
Administrator1015126470%8
Nurse Practitioner1015126470%8
Dental Services Staff2024145358%7.8
RN Director of Nursing101101921%0.5
56 Certified Nursing Assistant
% of Days 100%
26 Registered Nurse
% of Days 100%
16 Licensed Practical Nurse
% of Days 100%
6 Respiratory Therapy Technician
% of Days 85%
5 Physical Therapy Assistant
% of Days 78%
2 Dietitian
% of Days 85%
4 Speech Language Pathologist
% of Days 88%
2 Mental Health Service Worker
% of Days 71%
8 Clinical Nurse Specialist
% of Days 71%
3 Physical Therapy Aide
% of Days 89%
6 Qualified Social Worker
% of Days 77%
4 Occupational Therapy Aide
% of Days 72%
1 Occupational Therapist
% of Days 64%
1 Administrator
% of Days 70%
1 Nurse Practitioner
% of Days 70%
2 Dental Services Staff
% of Days 58%
1 RN Director of Nursing
% of Days 21%

Penalties and fines

Includes penalties issued in 2023

Federal penalties imposed by CMS for regulatory violations, including civil money penalties (fines) and denials of payment for new Medicare/Medicaid admissions.

Source: CMS Penalties Database (Data as of Jan 2026)

Total fines amount $24K Rank #204 / 258Federal fines — State benchmarkedThis home is ranked 204th out of 258 homes in Florida. Shows this facility's cumulative CMS federal fine dollars versus the Florida average among facilities with fines, and where it ranks among 258 facilities in the pool. Lower total dollars mean a better rank.Rankings are based only on facilities in Florida that report data for that category. Facilities without available data are excluded from the ranking.Click the rank badge to see the full State ranking.Click here to see the full State ranking.
67% lower than Florida average

Florida average: $72K

Number of fines 5
90% more fines than Florida average

Florida average: 2.6

Payment Denials Info Serious action where Medicare and/or Medicaid temporarily stops payments for new residents until issues are fixed. 0
100% fewer payment denials than Florida average

Florida average: 0.1

Fines amount comparison
This facility $24K
Florida average $72K
Penalty History

Penalties are imposed by CMS for violations of federal nursing home regulations.

5 penalties in the past 3 years

Multiple penalties were reported in the last 3 years.

Civil Money Penalty Info Fines imposed for noncompliance, which can be assessed per day or per instance of violation. Jul 11, 2023
$4K
Civil Money Penalty Info Fines imposed for noncompliance, which can be assessed per day or per instance of violation. Jul 11, 2023
$4K
Civil Money Penalty Info Fines imposed for noncompliance, which can be assessed per day or per instance of violation. Jul 11, 2023
$4K
Civil Money Penalty Info Fines imposed for noncompliance, which can be assessed per day or per instance of violation. Jul 11, 2023
$4K

Last updated: Jan 2026

Quality of care over time

These measures show how residents usually do over time at this home, based on health outcomes and preventive care.

High-risk clinical events score Info A composite score based on pressure ulcers, falls with injury, weight loss, walking ability decline, and activities of daily living decline. 5.9
21% better than Florida average

Florida average: 7.4

Functional decline score Info A composite score based on activities of daily living decline, walking ability decline, and incontinence. 14.3
16% worse than Florida average

Florida average: 12.4

Long-stay resident measures
Significantly above average Florida avg: 4.5 Info CMS star rating based on long-stay quality measure performance. 5 stars = significantly above average, 1 star = significantly below average.
Need for Help with Daily Activities Increased Info Percent of long-stay residents whose need for help with daily activities has increased 7.6%
28% better than Florida average

Florida average: 10.5%

Walking Ability Worsened Info Percent of long-stay residents whose ability to move independently worsened 10.8%
17% better than Florida average

Florida average: 12.9%

Low Risk Residents with Bowel/Bladder Incontinence Info Percent of low risk long-stay residents who lose control of their bowels or bladder 24.7%
82% worse than Florida average

Florida average: 13.5%

Falls with Major Injury Info Percent of long-stay residents experiencing one or more falls with major injury 3.4%
30% worse than Florida average

Florida average: 2.6%

High Risk Residents with Pressure Ulcers Info Percent of long-stay high risk residents with pressure ulcers 2.1%
61% better than Florida average

Florida average: 5.4%

Urinary Tract Infection Info Percent of long-stay residents with a urinary tract infection 0.6%
28% better than Florida average

Florida average: 0.9%

Lost Too Much Weight Info Percent of long-stay residents who lose too much weight 5.4%
9% better than Florida average

Florida average: 6.0%

Depressive Symptoms Info Percent of long-stay residents who have depressive symptoms 8.1%
143% worse than Florida average

Florida average: 3.3%

Antipsychotic Use Info Percent of long-stay residents who received an antipsychotic medication 7.8%
In line with Florida average

Florida average: 8.0%

Pneumococcal Vaccine Info Percent of long-stay residents assessed and appropriately given the pneumococcal vaccine 100.0%
In line with Florida average

Florida average: 97.7%

Influenza Vaccine Info Percent of long-stay residents assessed and appropriately given the seasonal influenza vaccine 100.0%
In line with Florida average

Florida average: 99.2%

Hospitalizations per 1,000 days Info Number of hospitalizations per 1,000 long-stay resident days. 1.68
20% better than Florida average

Florida average: 2.10

ED visits per 1,000 days Info Number of outpatient emergency department visits per 1,000 long-stay resident days. 1.09
8% better than Florida average

Florida average: 1.18

Short-stay resident measures
Above average Florida avg: 3.1 Info CMS star rating based on short-stay quality measure performance. 5 stars = much above average, 1 star = much below average.
Pneumococcal Vaccine Info Percent of short-stay residents assessed and appropriately given the pneumococcal vaccine 97.2%
In line with Florida average

Florida average: 94.0%

Antipsychotic medication increase Info Percent of short-stay residents who newly received an antipsychotic medication 0.7%
54% better than Florida average

Florida average: 1.5%

Influenza Vaccine Info Percent of short-stay residents assessed and appropriately given the seasonal influenza vaccine 98.3%
In line with Florida average

Florida average: 94.7%

Re-hospitalized after SNF stay Info Percentage of short-stay residents who were re-hospitalized after their nursing home admission. 27.8%
6% worse than Florida average

Florida average: 26.2%

Emergency department visits Info Percentage of short-stay residents who had an outpatient emergency department visit. 6.5%
30% better than Florida average

Florida average: 9.3%

Falls with major injury Info Percentage of SNF residents who experience falls with major injury during their stay. 1.3%
73% worse than Florida average

Florida average: 0.8%

Ability to care for self at discharge Info Percentage of residents at or above expected ability to care for themselves at discharge. 57.1%
6% better than Florida average

Florida average: 53.7%

Successful return to home or community Info Rate of successful return to home or community from a skilled nursing facility. 44.3%
12% worse than Florida average

Florida average: 50.6%

Breakdown by payment type

Medicare

50% of new residents, usually for short-term rehab.

Typical stay 27 days

Private pay

38% of new residents, often for short stays.

Typical stay 1 months

Medicaid

11% of new residents, often for long-term daily care.

Typical stay 11 - 12 months

Facility Characteristics

Source: CMS Long-Term Care Facility Characteristics (Data as of Jan 2026)

Total residents 107
Medicare
21
19.6% of residents
Medicaid
53
49.5% of residents
Private pay or other
33
30.8% of residents
Programs & Services
Residents Group

Residents meet regularly to discuss policies, care quality, and activities

Family Member Group

Family members meet regularly to discuss policies, care quality, and activities

Active Family Council

Organized group of family members that meets regularly to discuss facility policies, resident care, and activities.

Active Resident Council

Organized group of residents that meets regularly to discuss facility policies, quality of life, and activities.

Finances and operations

Based on CMS SNF Cost Report for fiscal year ending in 12/2023.

Privately-owned community
Operated by a single business entity.
Net patient revenue Info Net patient revenue — what the home actually collects for resident care, after contractual allowances, bad debt and discounts are subtracted from its gross charges (CMS cost report, Worksheet G-3). It covers resident care only; money the home earns from other sources is shown separately as "Other income."
$11.7M
Net patient income Info Net patient income: net patient revenue minus the home's total operating expenses. A positive figure means it earns more from resident care than it spends to deliver it; a negative figure means the opposite. It excludes non-operating "other income."
-$2.1M
Privately-owned community Operated by a single business entity.
Net patient revenue Info Net patient revenue — what the home actually collects for resident care, after contractual allowances, bad debt and discounts are subtracted from its gross charges (CMS cost report, Worksheet G-3). It covers resident care only; money the home earns from other sources is shown separately as "Other income."
$11.7M Rank #185 / 257Revenue — State benchmarkedThis home is ranked 185th out of 257 homes in Florida. Shows this facility's annual revenue compared to the Florida average. Higher revenue generally means more resources for staffing and capital — read alongside Payroll %.Rankings are based only on facilities in Florida that report data for that category. Facilities without available data are excluded from the ranking.Click the rank badge to see the full State ranking.Click here to see the full State ranking.
Net patient income Info Net patient income: net patient revenue minus the home's total operating expenses. A positive figure means it earns more from resident care than it spends to deliver it; a negative figure means the opposite. It excludes non-operating "other income."
-$2.1M
Other income Info Money the home earns outside of resident care — such as investments, grants, rentals and other non-operating sources (CMS cost report, Worksheet G-3). It is tracked separately from net patient revenue: it is not part of that figure, and it is not included in net patient income.
$3.7K
Payroll costs Info Staff salaries plus wage-related costs — benefits such as payroll taxes, health insurance and retirement — from the home's own accounting records (CMS cost report, Worksheet A). Contract or agency labor is counted separately, under other operating costs. Rank #155 / 257Payroll — State benchmarkedThis home is ranked 155th out of 257 homes in Florida. Shows total annual staff payroll benchmarked to the Florida average. Higher payroll investment relative to peers often signals better staffing and less reliance on cheaper contract labor.Rankings are based only on facilities in Florida that report data for that category. Facilities without available data are excluded from the ranking.Click the rank badge to see the full State ranking.Click here to see the full State ranking.
$6.0M 51.9% of net patient revenue Info Payroll as a share of revenue: staff salaries and wage-related benefits divided by net patient revenue. A higher figure means more of each revenue dollar goes to staff pay. Rank #40 / 257Payroll % — State benchmarkedThis home is ranked 40th out of 257 homes in Florida. Shows payroll as a percentage of revenue versus the Florida average. Well-run Florida facilities typically land around 49–56% — the top third Statewide. Below 25% may signal understaffing or heavy agency use — read with Staffing ratings.Rankings are based only on facilities in Florida that report data for that category. Facilities without available data are excluded from the ranking.Click the rank badge to see the full State ranking.Click here to see the full State ranking.
Other operating costs Info Everything it costs to run the home apart from payroll — food, utilities, supplies, maintenance, contract labor and administration. Calculated as total operating expense minus payroll (staff salaries and wage-related benefits).
$7.7M
Total costs Info The home's total operating expense for the year — all the costs of running it, salaries included (CMS cost report, Worksheet G-3).
$13.8M

Who this home usually serves

TYPE OF STAY

Mostly short-term rehab stays

Most residents typically stay for a few weeks or months before returning home or moving on.

Most new residents arrive under Medicare (50% of admissions), and a typical Medicare stay runs around 27 days.

Admissions
498 total

Coverage residents most often arrive under.

Medicare 50%
Private pay 38%
Medicaid 11%
Discharges
471 total

Coverage residents most often leave under.

Medicare 41%
Private pay 38%
Medicaid 21%

Places of interest near Bayshore Pointe Nursing & Rehab Center

Address 4.6 miles from city center Info Estimated distance in miles from Tampa's city center to Bayshore Pointe Nursing & Rehab Center's address, calculated via Google Maps. — 3.07 miles to nearest hospital (HCA Florida South Tampa Hospital)

Calculate Travel Distance to Bayshore Pointe Nursing & Rehab Center

Add your location

Address

Compare Nursing Homes around Tampa

The information below is reported by the Florida Agency for Health Care Administration (AHCA).

5 facilities compared · CMS & FL Dept. of Health data

Canterbury Tower
NH
AL
IL
RC
Tampa (South Tampa)
17
Facility 17
FL AVG 89
Rank #889 / 1074
100.0%
Facility 100.0%
FL AVG 84.3%
Rank #1 / 258
+19%
6.47
Facility 6.47
FL AVG 4.04
Rank #3 / 253
-6%+60%
$0
Facility $0
FL AVG $78.9k
Rank #1 / 258
95
Facility 95
FL AVG 83
Rank #128 / 876
6
Facility 6
FL AVG 19.7
Rank #23 / 252
3.0
Facility 3.0
FL AVG 4.5
Rank #53 / 252
-32A+
56
Facility 56
FL AVG 40
Rank #407 / 1486
Caridad Vinas
$3.4M
Facility $3.4M
FL AVG $15.7M
Rank #181 / 257
$4.8M
Facility $4.8M
FL AVG $6.1M
Rank #206 / 257
142.4%
Facility 142.4%
FL AVG 39.8%
Rank #162 / 257
105326
Bayshore Pointe Nursing & Rehab Center
NH
RC
Tampa (South Tampa)
117
Facility 117
FL AVG 89
Rank #340 / 1074
76.3%
Facility 76.3%
FL AVG 84.3%
Rank #204 / 258
-9%
3.89
Facility 3.89
FL AVG 4.04
Rank #126 / 253
+50%-4%
$23.6k
Facility $23.6k
FL AVG $78.9k
Rank #204 / 258
-
33
Facility 33
FL AVG 19.7
Rank #223 / 252
6.6
Facility 6.6
FL AVG 4.5
Rank #212 / 252
1106A+
71
Facility 71
FL AVG 40
Rank #203 / 1486
-
$11.7M
Facility $11.7M
FL AVG $15.7M
Rank #185 / 257
$6.0M
Facility $6.0M
FL AVG $6.1M
Rank #155 / 257
51.9%
Facility 51.9%
FL AVG 39.8%
Rank #40 / 257
105650
Palm Garden Of Tampa
NH
HC
PC
RC
Tampa (South Florida Terraces)
120
Facility 120
FL AVG 89
Rank #256 / 1074
90.4%
Facility 90.4%
FL AVG 84.3%
Rank #111 / 258
+7%
3.95
Facility 3.95
FL AVG 4.04
Rank #110 / 253
-49%-2%
$0
Facility $0
FL AVG $78.9k
Rank #1 / 258
-
24
Facility 24
FL AVG 19.7
Rank #172 / 252
8.0
Facility 8.0
FL AVG 4.5
Rank #236 / 252
-113A+
27
Facility 27
FL AVG 40
Rank #954 / 1486
Michele Forney
$13.7M
Facility $13.7M
FL AVG $15.7M
Rank #126 / 257
$7.0M
Facility $7.0M
FL AVG $6.1M
Rank #154 / 257
51.3%
Facility 51.3%
FL AVG 39.8%
Rank #174 / 257
105591
Fairway Oaks Center
NH
PC
RC
Tampa
120
Facility 120
FL AVG 89
Rank #256 / 1074
93.5%
Facility 93.5%
FL AVG 84.3%
Rank #52 / 258
+11%
3.28
Facility 3.28
FL AVG 4.04
Rank #241 / 253
-23%-19%
$0
Facility $0
FL AVG $78.9k
Rank #1 / 258
-
26
Facility 26
FL AVG 19.7
Rank #187 / 252
8.7
Facility 8.7
FL AVG 4.5
Rank #244 / 252
-104B-
32
Facility 32
FL AVG 40
Rank #888 / 1486
Dawn Debrunner
$13.3M
Facility $13.3M
FL AVG $15.7M
Rank #189 / 257
$6.5M
Facility $6.5M
FL AVG $6.1M
Rank #158 / 257
48.7%
Facility 48.7%
FL AVG 39.8%
Rank #36 / 257
105305
The Bristol at Tampa Rehabilitation & Nursing Center
NH
PC
RC
Tampa (Cross Fletcher)
266
Facility 266
FL AVG 89
Rank #8 / 1074
88.0%
Facility 88.0%
FL AVG 84.3%
Rank #145 / 258
+4%
3.91
Facility 3.91
FL AVG 4.04
Rank #126 / 253
-28%-3%
$130.7k
Facility $130.7k
FL AVG $78.9k
Rank #243 / 258
-
54
Facility 54
FL AVG 19.7
Rank #252 / 252
9.0
Facility 9.0
FL AVG 4.5
Rank #245 / 252
6219-
75
Facility 75
FL AVG 40
Rank #151 / 1486
Bristol Holdco LLC
$25.3M
Facility $25.3M
FL AVG $15.7M
Rank #71 / 257
$12.7M
Facility $12.7M
FL AVG $6.1M
Rank #33 / 257
50.4%
Facility 50.4%
FL AVG 39.8%
Rank #25 / 257
105140

Financial Assistance for
Nursing Home in Florida

Bayshore Pointe Nursing & Rehab Center is located in Tampa, Florida.
Here are the financial assistance programs available to residents in Florida.

Get Financial aid guidance

Long-Term Care Waiver

Florida Medicaid LTC Waiver

Age 65+ or 21+ disabled
General Florida resident, Medicaid- eligible, nursing home-level care need.
Income Limits (2025) ~$2,829/month 300% FBR, individual
Asset Limits $2,000 (individual), $3,000 (couple).
FL

High demand; waitlists common.

Benefits
In-home care (6-8 hours/day) Assisted living Respite (240 hours/year) Case management

Community Care for the Elderly (CCE)

Florida CCE

Age 60+
General Florida resident, at risk of nursing home.
Income Limits ~$2,000/month varies
Asset Limits $5,000 individual
FL

Limited funding; regional variation.

Benefits
Homemaker services (3-5 hours/week) Adult day care (~$60/day) Respite (up to 10 days/year)

Home Care for the Elderly (HCE)

Florida Home Care for the Elderly

Age 60+
General Florida resident, at risk of nursing home placement; caregiver must be approved.
Income Limits (2025) ~$2,829/month individual, aligned with Medicaid thresholds
Asset Limits ~$2,000 (individual); varies by case manager discretion.
FL

Limited funding (~3,500 served annually); prioritizes low-income frail seniors.

Benefits
Basic subsidy (~$160/month) for housing/medical costs; special subsidies for supplies/services (e.g., incontinence supplies, ~$50-$200/month)

Program of All-Inclusive Care for the Elderly (PACE)

Florida Medicaid PACE

Age 55+
General Florida resident, nursing home-level care need, safe with PACE support.
Income Limits (2025) ~$2,829/month 300% FBR
Asset Limits $2,000 (individual), $3,000 (couple).
FL

Limited to specific counties (e.g., Hillsborough, Miami-Dade); ~10 sites statewide.

Benefits
Personal care (5-7 hours/day) Medical care Meals Transportation Therapy

Optional State Supplementation (OSS)

Florida Optional State Supplementation

Age 65+ or disabled
General Florida resident, living in approved facility, receiving SSI or low-income.
Income Limits (2025) ~$1,004/month individual, including SSI
Asset Limits $2,000 (individual), $3,000 (couple).
FL

Limited to specific facility types; ~$78.40/month max supplement.

Benefits
Cash payment (~$78.40/month) for room/board or personal needs in facilities

Frequently Asked Questions about Bayshore Pointe Nursing & Rehab Center

What neighborhood is Bayshore Pointe Nursing & Rehab Center in?

Bayshore Pointe Nursing & Rehab Center is in the South Tampa neighborhood of Tampa.

Is Bayshore Pointe Nursing & Rehab Center in a walkable area?

Bayshore Pointe Nursing & Rehab Center has a walk score of 71. Very walkable. Most errands can be accomplished on foot, and many essentials are within a short walk.

What is the occupancy rate at Bayshore Pointe Nursing & Rehab Center?

Bayshore Pointe Nursing & Rehab Center's occupancy is 76.3%.

Are there photos of Bayshore Pointe Nursing & Rehab Center?

Yes — there is 1 photo of Bayshore Pointe Nursing & Rehab Center in the photo gallery on this page.

What is the address of Bayshore Pointe Nursing & Rehab Center?

Bayshore Pointe Nursing & Rehab Center is located at 3117 West Gandy Blvd, Tampa, FL 33611.

What is the phone number of Bayshore Pointe Nursing & Rehab Center?

(813) 261-5500 will put you in contact with the team at Bayshore Pointe Nursing & Rehab Center.

Is Bayshore Pointe Nursing & Rehab Center Medicare or Medicaid certified?

Yes — Bayshore Pointe Nursing & Rehab Center is a CMS-certified provider of Medicare and Medicaid.

Guides for Better Senior Living

Care Cost Calculator: See Prices in Your Area

Nursing Home Data Explorer

Don’t Wait Too Long: 7 Red Flag Signs Your Parent Needs Assisted Living Now

The True Cost of Assisted Living in 2025 – And How Families Are Paying For It

Understanding Senior Living Costs: Pricing Models, Discounts & Financial Assistance