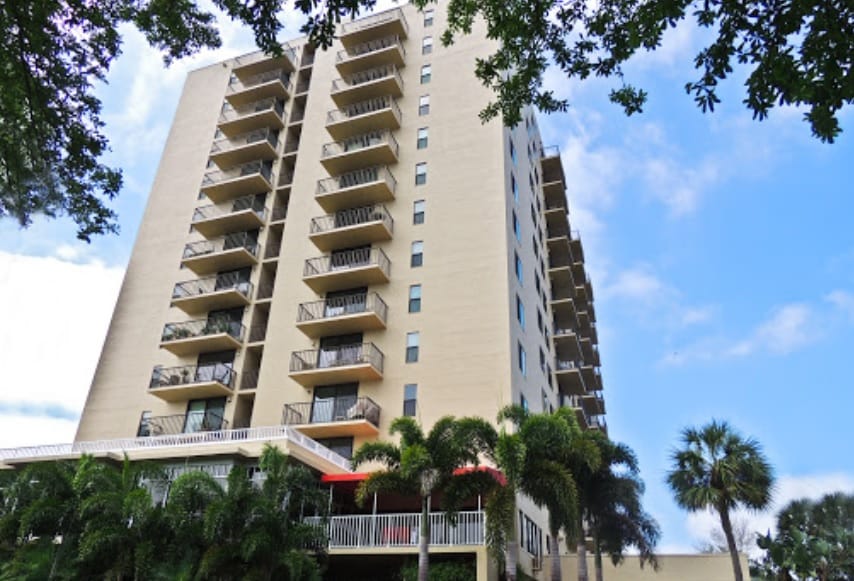
Canterbury Tower
Nursing Home · Tampa, FL
CMS overall rating Info The Overall CMS Rating is scored from 1 to 5 stars and combines results from health inspections, staffing levels, and quality measures. Health inspections carry the most weight. Staffing and quality scores can increase or decrease the final rating based on performance compared to state and national standards.

Canterbury Tower

Nursing Home · Tampa, FL
CMS overall rating Info The Overall CMS Rating is scored from 1 to 5 stars and combines results from health inspections, staffing levels, and quality measures. Health inspections carry the most weight. Staffing and quality scores can increase or decrease the final rating based on performance compared to state and national standards.
Calculator: See prices in your area
Canterbury Tower accepts Medicare and private pay.

Overview of Canterbury Tower

Serving seniors since 1976, Canterbury Tower is a continuing lifecare retirement community in Tampa, Florida. With over 40 years of experience, its design is rooted in the simplicity of providing a comfortable residence for seniors after retirement, adding extra layers of comfort for seniors needing more complex assistance and support. They offer independent living, assisted living, short-term rehabilitative care, respite care and long-term care as a premier care provider to seniors. 
Situated in an exquisite area, Canterbury Tower offers its residents excellent views of Hillsborough Bay, Bayshore Boulevard, and the Tampa, Florida skyline. On top of that, residents can enjoy a variety of social activities including scheduled entertainment, exercise classes, outdoor picnics, and current event discussions. The supportive and caring environment built through the decades delivers on the promise of Canterbury Tower to excel in providing high-quality care each day. 

(813) 837-1083

Quality ratings

Measured by Centers for Medicare & Medicaid Services (CMS)

Overall rating Info The Overall CMS Rating combines results from health inspections, staffing levels and quality measures. Health inspections carry the most weight. Staffing and quality scores can increase or decrease the final rating based on performance compared to state and national standards.
▲ 9.3% Above FL avg. ▲ 9.3% Above FL avg.Click the badge to see the full State ranking.Click here to see the full State ranking.
Health Inspection Info Based on the results of the facility's three most recent standard inspections and any complaint investigations. CMS reviews the number, scope, and severity of deficiencies, with more recent findings weighted more heavily.
▲ 26.2% Above FL avg. ▲ 26.2% Above FL avg.Click the badge to see the full State ranking.Click here to see the full State ranking.
Staffing Info Measures average nursing staff hours per resident per day, including Registered Nurses (RNs) and total nursing staff. Ratings are adjusted based on the level of care residents require and are compared to state and national benchmarks.
▲ 7.2% Above FL avg. ▲ 7.2% Above FL avg.Click the badge to see the full State ranking.Click here to see the full State ranking.
Quality Measures Info Based on clinical and physical health indicators reported to CMS, such as hospital readmissions, falls, pressure ulcers, and improvements in mobility. These measures reflect how well residents' health needs are being managed.
▼ 29.7% Below FL avg. ▼ 29.7% Below FL avg.Click the badge to see the full State ranking.Click here to see the full State ranking.

Staffing hours breakdown

Info Daily nursing hours per resident by staff type, reported to CMS. Higher is generally better — compare this facility to state and national averages to see where staffing stands.

Hours per resident per day — compared to Florida state averages

Total nursing care / resident Info This home is ranked 3rd out of 252 homes in Florida. Total adjusted nursing hours per resident per day, combining RN, LPN, and aide time. CMS adjusts this for case-mix so facilities can be fairly compared.
6h 28m per day
Rank #3 / 252Nurse hours — State benchmarkedThis home is ranked 3rd out of 252 homes in Florida. Shows adjusted nurse hours per resident per day benchmarked to the Florida average, with a ranking across 252 Florida SNFs. More hours mean more direct care. The national average is about 3.5 hrs; below 3.0 is a red flag.Click the rank badge to see the full State ranking.Click here to see the full State ranking.
This facility Florida avg (4h 25m per day)
vs Florida avg
+46%

1 of 6 metrics below state avg

Standout metric Weekend RN is +113% above state avg
Staff typeHours / Day / Residentvs state avg
Registered Nurse (RN) Info RNs hold the highest nursing license and can assess residents, interpret test results, and direct care plans. More RN hours per day often signals stronger clinical oversight and faster response to health changes. 1h 25m per day ▲ 93% State avg: 44m per day · National avg: 41m per day
LPN / LVN Info Licensed Practical Nurses (LPNs) or Licensed Vocational Nurses (LVNs) deliver routine hands-on care — medication administration, wound dressing, and monitoring vital signs. They work under RN supervision and make up a large share of daily bedside care. 34m per day ▼ 28% State avg: 47m per day · National avg: 52m per day
Nurse Aide Info Certified Nurse Aides (CNAs) provide the most direct day-to-day assistance: bathing, dressing, feeding, and mobility. Nurse aide hours are typically the largest staffing category and directly affect residents' quality of life. 3h 42m per day ▲ 59% State avg: 2h 20m per day · National avg: 2h 21m per day
Weekend Total Nursing Info Combined nursing hours (RN + LPN + Nurse Aide) per resident per day on weekends. Staffing often drops on weekends — this figure reveals whether the facility maintains adequate coverage outside of weekday hours. 5h 0m per day ▲ 42% State avg: 3h 31m per day · National avg: 3h 26m per day
Physical Therapist Info Hours per resident per day provided by licensed Physical Therapists (PTs) or PT Assistants. PT services help residents recover mobility after injury or illness and are especially important for post-acute (short-stay) rehabilitation. 7m per day ▲ 40% State avg: 5m per day · National avg: 4m per day
Weekend RN Info Registered nurse hours specifically on weekends. Facilities sometimes reduce RN presence on Saturdays and Sundays — a low weekend RN figure compared to weekday hours can indicate reduced clinical oversight when most administrative staff are absent. 1h 8m per day ▲ 113% State avg: 32m per day · National avg: 29m per day

Capacity and availability

Avg. Length of Stay
101 days
Bed community size
17-bed community Rank #888 / 1065Bed count — State benchmarkedThis home is ranked 888th out of 1065 homes in Florida. Shows this facility's certified or reported bed count compared to other Florida SNFs. Larger communities may offer more amenities, programs, and on-site services for residents and families.Click the rank badge to see the full State ranking.Click here to see the full State ranking.
A smaller, more intimate setting that may offer a quieter environment and closer staff-resident interactions.
Walk Score
Walk Score: 56 / 100 Rank #406 / 1486Walk Score — State benchmarkedThis home is ranked 406th out of 1486 homes in Florida. Shows how walkable this facility's neighborhood is compared to the average Walk Score across Florida SNFs. Higher scores benefit residents, families, and staff.Click the rank badge to see the full State ranking.Click here to see the full State ranking.
Moderately walkable. Some errands can be accomplished on foot, with a mix of nearby amenities.
BBB Rating
BBB Rating: A+ (Not Accredited)
An independent rating from the Better Business Bureau based on factors such as complaint history, transparency, and business practices.
How BBB ratings work

About this community

Occupancy

Occupancy rate
100%
Rank #1 / 255Occupancy rate — State benchmarkedThis home is ranked 1st out of 255 homes in Florida. Shows this facility's occupancy rate versus the Florida average, with its Statewide rank out of 255. Higher occupancy signals strong local demand and financial stability.Click the rank badge to see the full State ranking.Click here to see the full State ranking.
Higher than the Florida average: 84.3%
Occupied beds
17 / 17
Average residents per home in Florida 108 per day

License Details

Facility TypeAssisted Living Facility
StatusLicensed
IssuanceFebruary 12, 2024
ExpirationJanuary 12, 2026
CountyHillsborough
License Number13753
CMS Certification Number105326

Ownership & Operating Entity

Canterbury Tower is legally operated by Canterbury Towers, Inc., and administrated by Aaron Brown.

Profit StatusNot-For-Profit

Safety & Compliance

No secured perimeter
Emergency Systems24-hour in-house monitored emergency alert sensors
Safety FeaturesState-of-the-art fire detection system

Staffing

Key information about the people who lead and staff this community.

Languages Spoken

Creole English French Portuguese Spanish Vietnamese

Payment & Insurance

1 service
Accept Medicare

Therapy & Rehabilitation

3 services
Rehabilitation Services
Respite Care
Short-Term Rehab

Additional Policies & Features

Continuing Care Retirement Community (CCRC)
Minimum Age62

Amenities & Lifestyle

Fitness Center
Library
Heated Resort-Style Pool
Gated Parking
Dining Options
ActivitiesNumerous activities, guest speakers, excursions, cultural events
Specific ProgramsShort-term Rehabilitation

Contact Canterbury Tower

Inspection History

In Florida, the Agency for Health Care Administration (AHCA) is the primary authority that conducts unannounced inspections and completes official health quality reports for all healthcare facilities.

Since 2021 · 5 years of data 8 citations 5 inspections

Inspection Scorecard Info This scorecard compares key inspection, citation, and complaint metrics at this facility against the Florida state average. Metrics rated ≥15% worse than average are highlighted in red; those ≥15% better are highlighted in green.

Since 2021 vs. Florida state average
Overall vs. FL average 1 Worse Metrics worse than Florida average:
• Citations per inspection (23% above)
5 Better Metrics better than Florida average:
• Total citations (76% below)
• Citations per year (76% below)
• Total inspections (81% below)
• Inspections with citations (88% below)
• Inspection citation rate (35% below)
Latest Inspection July 17, 2025 Annual Inspection

Citations Info Citations are formal regulatory issues recorded during state inspections.

This FacilityFL Averagevs. FL Avg
Total citations Info Formal regulatory issues recorded by inspectors across all inspection types. 833 This facility has 76% fewer total citations than a typical Florida nursing home (8 vs. FL avg 33).↓ 76% better
Citations per year Info Average citations per year since 2021. 1.66.6 This facility has 76% fewer citations per year than a typical Florida nursing home (1.6 vs. FL avg 6.6).↓ 76% better
Citations per inspection Info Average citations per inspection. 1.61.3 This facility has 23% more citations per inspection than a typical Florida nursing home (1.6 vs. FL avg 1.3).↑ 23% worse

Inspections Info State inspections evaluate whether the facility meets health and safety standards.

This FacilityFL Averagevs. FL Avg
Total inspections Info Combined count of all routine and focused inspections. Excludes complaint investigations. 526 This facility has 81% fewer total inspections than a typical Florida nursing home (5 vs. FL avg 26).↓ 81% better
Inspections with citations Info Inspections that resulted in at least one regulatory citation. 216 This facility has 88% fewer inspections with citations than a typical Florida nursing home (2 vs. FL avg 16).↓ 88% better
Inspection citation rate Info Percentage of inspections that resulted in at least one citation. 40%62% This facility has 22 percentage points lower inspection citation rate than a typical Florida nursing home (40% vs. FL avg 62%).↓ 22% better

Inspection Reports Summary Info An editor-reviewed summary of the themes and findings across this facility's recent inspection reports.

Canterbury Towers Inc underwent its most recent inspection on November 13, 2024, which reported a status of Deficiencies Corrected. During this reporting period, from November 30, 2022 to December 26, 2024, the facility had a total of five inspections, with all five resulting in deficiencies. A total of eight line-item deficiencies were identified across these inspections. Common themes observed during inspections included records and documentation issues. Following the latest inspection, the facility corrected its cited deficiencies, demonstrating improvement in addressing areas for concern.

Read the full inspection reports for this facility, including detailed findings and corrective actions.

Show Inspection Reports

Health Inspection History

Inspections since 2023
Total health inspections 2

Florida average 4.3


Last Health inspection on Jul 2025

Total health citations
6 Rank #23 / 251Health citations — State benchmarkedThis home is ranked 23rd out of 251 homes in Florida. Shows this facility's total health deficiency citations benchmarked to the Florida State average, with a ranking across all 251 FL SNFs. Lower citation counts earn a better rank.Click the rank badge to see the full State ranking.Click here to see the full State ranking.

Florida average 19.7

Citations per inspection
3 Rank #53 / 251Citations per inspection — State benchmarkedThis home is ranked 53rd out of 251 homes in Florida. Shows average deficiency citations per CMS inspection for this facility versus the Florida mean across 251 SNFs with citation data. Lower is better.Click the rank badge to see the full State ranking.Click here to see the full State ranking.

Florida average 4.48


Health citations are formal notices following inspections when they fail to comply with safety and care standards.

All 6 citations resulted from standard inspections.

Breakdown of citation severity (last 3 years)
Critical Health citations
0
100% better than Florida average

Florida average: 0.8


Serious Health citations
0
100% better than Florida average

Florida average: 0.4

0 critical citations Florida average: 0.8

0 serious citations Florida average: 0.4

6 moderate citations Florida average: 18.4

0 minor citations Florida average: 0.2
Citations history (last 3 years)
Nutrition moderate citation Jul 17, 2025
Corrected

Care Planning moderate citation Jul 17, 2025
Corrected

Resident Rights moderate citation Jul 17, 2025
Corrected

Infection Control moderate citation Aug 10, 2023
Corrected

Staffing Data

Reporting period: October 1 – December 31, 2025 (Q4 2025). Source: CMS Payroll-Based Journal report.

Total staff 79
Employees 51
Contractors 28
Staff to resident ratio 0:0
100% worse than Florida average
Florida average ratio: 1.47:1 Florida average ratio: 1.47:1See full Florida ranking
Avg staff/day 32
Average shift 7.7 hours
0% compared with Florida average
Florida average: 7.9 hours Florida average shift: 7.9 hoursSee full Florida ranking
Total staff hours (quarter) 22,644

Nursing staff breakdown

Q4 2025 · Oct 1 – Dec 31 More info This data comes from the CMS Payroll-Based Journal report covering October 1 – December 31, 2025.
Registered Nurse

Manages medical care and health needs.

RN Staff 9
Average shift length Info Average shift length. Calculated as total hours divided by days worked and average staff per day. 9.4 hours

No contractors work on this role.

Licensed Practical Nurse

Assists with medical care and medications.

LPN Staff 15
Average shift length Info Average shift length. Calculated as total hours divided by days worked and average staff per day. 9 hours

This role is partially covered by contractors.

Certified Nursing Assistant

Helps with daily care and mobility.

CNA Staff 27
Average shift length Info Average shift length. Calculated as total hours divided by days worked and average staff per day. 7.7 hours

No contractors work on this role.

Contractor staffing

Q4 2025 · Oct 1 – Dec 31 More info This data comes from the CMS Payroll-Based Journal report covering October 1 – December 31, 2025.

Total hours from contractors

10%

2,267 contractor hours this quarter

Licensed Practical Nurse: 9 Speech Language Pathologist: 5 Physical Therapy Aide: 5 Physical Therapy Assistant: 3 Respiratory Therapy Technician: 1 Qualified Social Worker: 1 Occupational Therapy Aide: 1 Diagnostic X-ray Services Staff: 1 Medical Director: 1 Occupational Therapy Assistant: 1

Staff by category

Q4 2025 · Oct 1 – Dec 31 More info This data comes from the CMS Payroll-Based Journal report covering October 1 – December 31, 2025.
Certified Nursing Assistant2702711,10792100%7.7
Licensed Practical Nurse69152,6298997%9
Registered Nurse9092,46692100%9.4
Other Dietary Services Staff3031,52692100%8
RN Director of Nursing2029195560%9.4
Physical Therapy Aide0557107480%5.8
Speech Language Pathologist0556577683%6.1
Dietitian1015126470%8
Nurse Practitioner1014966267%8
Dental Services Staff1014806065%8
Administrator1014405560%8
Respiratory Therapy Technician0113406672%5.2
Qualified Social Worker0111275661%2.3
Physical Therapy Assistant033973841%2.3
Occupational Therapy Aide011962426%4
Diagnostic X-ray Services Staff0112567%4.2
Occupational Therapy Assistant0111233%4
Medical Director011633%2
27 Certified Nursing Assistant
% of Days 100%
15 Licensed Practical Nurse
% of Days 97%
9 Registered Nurse
% of Days 100%
3 Other Dietary Services Staff
% of Days 100%
2 RN Director of Nursing
% of Days 60%
5 Physical Therapy Aide
% of Days 80%
5 Speech Language Pathologist
% of Days 83%
1 Dietitian
% of Days 70%
1 Nurse Practitioner
% of Days 67%
1 Dental Services Staff
% of Days 65%
1 Administrator
% of Days 60%
1 Respiratory Therapy Technician
% of Days 72%
1 Qualified Social Worker
% of Days 61%
3 Physical Therapy Assistant
% of Days 41%
1 Occupational Therapy Aide
% of Days 26%
1 Diagnostic X-ray Services Staff
% of Days 7%
1 Occupational Therapy Assistant
% of Days 3%
1 Medical Director
% of Days 3%

Penalties and fines

Federal penalties imposed by CMS for regulatory violations, including civil money penalties (fines) and denials of payment for new Medicare/Medicaid admissions.

Source: CMS Penalties Database

No penalties in the past 3 years

No civil money penalties or payment denials were reported in the last 3 years.

Quality of care over time

These measures show how residents usually do over time at this home, based on health outcomes and preventive care.

High-risk clinical events score Info A composite score based on pressure ulcers, falls with injury, weight loss, walking ability decline, and activities of daily living decline. 9.6
30% worse than Florida average

Florida average: 7.4

Functional decline score Info A composite score based on activities of daily living decline, walking ability decline, and incontinence. 17.8
44% worse than Florida average

Florida average: 12.4

Long-stay resident measures
Below average Florida avg: 4.5 Info CMS star rating based on long-stay quality measure performance. 5 stars = significantly above average, 1 star = significantly below average.
Need for Help with Daily Activities Increased Info Percent of long-stay residents whose need for help with daily activities has increased 21.1%
101% worse than Florida average

Florida average: 10.5%

Walking Ability Worsened Info Percent of long-stay residents whose ability to move independently worsened 19.3%
49% worse than Florida average

Florida average: 12.9%

Low Risk Residents with Bowel/Bladder Incontinence Info Percent of low risk long-stay residents who lose control of their bowels or bladder 13.0%
In line with Florida average

Florida average: 13.5%

Falls with Major Injury Info Percent of long-stay residents experiencing one or more falls with major injury 4.4%
68% worse than Florida average

Florida average: 2.6%

High Risk Residents with Pressure Ulcers Info Percent of long-stay high risk residents with pressure ulcers 1.8%
67% better than Florida average

Florida average: 5.4%

Urinary Tract Infection Info Percent of long-stay residents with a urinary tract infection 9.8%
1006% worse than Florida average

Florida average: 0.9%

Lost Too Much Weight Info Percent of long-stay residents who lose too much weight 1.5%
75% better than Florida average

Florida average: 6.0%

Depressive Symptoms Info Percent of long-stay residents who have depressive symptoms 11.0%
228% worse than Florida average

Florida average: 3.3%

Antipsychotic Use Info Percent of long-stay residents who received an antipsychotic medication 24.4%
205% worse than Florida average

Florida average: 8.0%

Pneumococcal Vaccine Info Percent of long-stay residents assessed and appropriately given the pneumococcal vaccine 97.8%
In line with Florida average

Florida average: 97.7%

Influenza Vaccine Info Percent of long-stay residents assessed and appropriately given the seasonal influenza vaccine 70.8%
29% worse than Florida average

Florida average: 99.2%

Hospitalizations per 1,000 days Info Number of hospitalizations per 1,000 long-stay resident days. 2.40
14% worse than Florida average

Florida average: 2.10

ED visits per 1,000 days Info Number of outpatient emergency department visits per 1,000 long-stay resident days. 1.34
14% worse than Florida average

Florida average: 1.18

Short-stay resident measures
Average Florida avg: 3.1 Info CMS star rating based on short-stay quality measure performance. 5 stars = much above average, 1 star = much below average.
Pneumococcal Vaccine Info Percent of short-stay residents assessed and appropriately given the pneumococcal vaccine 90.1%
In line with Florida average

Florida average: 94.0%

Antipsychotic medication increase Info Percent of short-stay residents who newly received an antipsychotic medication 4.1%
171% worse than Florida average

Florida average: 1.5%

Influenza Vaccine Info Percent of short-stay residents assessed and appropriately given the seasonal influenza vaccine 83.3%
12% worse than Florida average

Florida average: 94.7%

Re-hospitalized after SNF stay Info Percentage of short-stay residents who were re-hospitalized after their nursing home admission. 29.0%
11% worse than Florida average

Florida average: 26.2%

Emergency department visits Info Percentage of short-stay residents who had an outpatient emergency department visit. 10.0%
8% worse than Florida average

Florida average: 9.3%

Falls with major injury Info Percentage of SNF residents who experience falls with major injury during their stay. 0.0%
100% better than Florida average

Florida average: 0.8%

Ability to care for self at discharge Info Percentage of residents at or above expected ability to care for themselves at discharge. 72.3%
35% better than Florida average

Florida average: 53.7%

Successful return to home or community Info Rate of successful return to home or community from a skilled nursing facility. 55.1%
9% better than Florida average

Florida average: 50.6%

Breakdown by payment type

Medicare

67% of new residents, usually for short-term rehab.

Typical stay 26 days

Private pay

33% of new residents, often for short stays.

Typical stay 9 - 10 months

Finances and operations

Voluntary non-profit community
Home revenue
$13.8M
Operating deficit
-$782.8K
Voluntary non-profit community
Home revenue
$13.8M Rank #180 / 256Revenue — State benchmarkedThis home is ranked 180th out of 256 homes in Florida. Shows this facility's annual revenue compared to the Florida SNF average. Higher revenue generally means more resources for staffing and capital — read alongside Payroll %.Click the rank badge to see the full State ranking.Click here to see the full State ranking.
Operating deficit
-$782.8K
Payroll costs Info The portion of the home's budget spent on staff, including nurses, caregivers, and other employees who support care and operations. Rank #205 / 256Payroll — State benchmarkedThis home is ranked 205th out of 256 homes in Florida. Shows total annual staff payroll benchmarked to the Florida average. Higher payroll investment relative to peers often signals better staffing and less reliance on cheaper contract labor.Click the rank badge to see the full State ranking.Click here to see the full State ranking.
$5.7M
41% of revenue Rank #160 / 256Payroll % — State benchmarkedThis home is ranked 160th out of 256 homes in Florida. Shows payroll as a percentage of revenue versus the Florida average. Well-run Florida SNFs typically land around 49–56% — the top third Statewide. Below 25% may signal understaffing or heavy agency use — read with Staffing ratings.Click the rank badge to see the full State ranking.Click here to see the full State ranking.
Other operating costs Info All remaining costs needed to run the home, such as food, utilities, building maintenance, supplies and administrative expenses.
$8.9M
Total costs $14.6M

Who this home usually serves

TYPE OF STAY

Mostly short-term rehab stays

Most residents typically stay for a few weeks or months before returning home or moving on.

Activities in this home

Places of interest near Canterbury Tower

Address 3.4 miles from city center Info Estimated distance in miles from Tampa's city center to Canterbury Tower's address, calculated via Google Maps. — 1.85 miles to nearest hospital (HCA Florida South Tampa Hospital)

Calculate Travel Distance to Canterbury Tower

Add your location

Address

Financial Assistance for
Nursing Home in Florida

Canterbury Tower is located in Tampa, Florida.
Here are the financial assistance programs available to residents in Florida.

Get Financial aid guidance

Long-Term Care Waiver

Florida Medicaid LTC Waiver

Age 65+ or 21+ disabled
General Florida resident, Medicaid- eligible, nursing home-level care need.
Income Limits (2025) ~$2,829/month 300% FBR, individual
Asset Limits $2,000 (individual), $3,000 (couple).
FL

High demand; waitlists common.

Benefits
In-home care (6-8 hours/day) Assisted living Respite (240 hours/year) Case management

Community Care for the Elderly (CCE)

Florida CCE

Age 60+
General Florida resident, at risk of nursing home.
Income Limits ~$2,000/month varies
Asset Limits $5,000 individual
FL

Limited funding; regional variation.

Benefits
Homemaker services (3-5 hours/week) Adult day care (~$60/day) Respite (up to 10 days/year)

Home Care for the Elderly (HCE)

Florida Home Care for the Elderly

Age 60+
General Florida resident, at risk of nursing home placement; caregiver must be approved.
Income Limits (2025) ~$2,829/month individual, aligned with Medicaid thresholds
Asset Limits ~$2,000 (individual); varies by case manager discretion.
FL

Limited funding (~3,500 served annually); prioritizes low-income frail seniors.

Benefits
Basic subsidy (~$160/month) for housing/medical costs; special subsidies for supplies/services (e.g., incontinence supplies, ~$50-$200/month)

Program of All-Inclusive Care for the Elderly (PACE)

Florida Medicaid PACE

Age 55+
General Florida resident, nursing home-level care need, safe with PACE support.
Income Limits (2025) ~$2,829/month 300% FBR
Asset Limits $2,000 (individual), $3,000 (couple).
FL

Limited to specific counties (e.g., Hillsborough, Miami-Dade); ~10 sites statewide.

Benefits
Personal care (5-7 hours/day) Medical care Meals Transportation Therapy

Optional State Supplementation (OSS)

Florida Optional State Supplementation

Age 65+ or disabled
General Florida resident, living in approved facility, receiving SSI or low-income.
Income Limits (2025) ~$1,004/month individual, including SSI
Asset Limits $2,000 (individual), $3,000 (couple).
FL

Limited to specific facility types; ~$78.40/month max supplement.

Benefits
Cash payment (~$78.40/month) for room/board or personal needs in facilities

Compare Nursing Home around Tampa

The information below is reported by the Florida Agency for Health Care Administration (AHCA).

4 facilities compared · CMS & FL Dept. of Health data

Filter by care type
Canterbury Tower
NH

Nursing Home Licensed facility providing 24/7 skilled nursing care for residents with complex, ongoing medical needs. Staffed by RNs, LPNs, and CNAs. Inspected and star-rated annually by CMS. Accepts Medicare (short-term rehab) and Medicaid (long-term care).

AL

Assisted Living A licensed, long-term care setting for seniors or individuals with disabilities who need help with daily activities — like bathing, dressing, and medication management — but not 24-hour skilled nursing. Offers housing, meals, and around-the-clock support while aiming to maximize resident independence.

Tampa (South Tampa)17 50.3% -40%6.47 -6%+60%$063.0-33A+ 56 Caridad Vinas$13.8M$5.7M41%105326
Gandy Crossing Care Center
NH

Nursing Home Licensed facility providing 24/7 skilled nursing care for residents with complex, ongoing medical needs. Staffed by RNs, LPNs, and CNAs. Inspected and star-rated annually by CMS. Accepts Medicare (short-term rehab) and Medicaid (long-term care).

AL

Assisted Living A licensed, long-term care setting for seniors or individuals with disabilities who need help with daily activities — like bathing, dressing, and medication management — but not 24-hour skilled nursing. Offers housing, meals, and around-the-clock support while aiming to maximize resident independence.

Tampa (South Tampa)160 88.2% +5%4.09 -21%+1%$0175.7-145- 66 Sandra Haywood$20.8M$9.5M46%105491
Bayshore Pointe Nursing & Rehab Center
NH

Nursing Home Licensed facility providing 24/7 skilled nursing care for residents with complex, ongoing medical needs. Staffed by RNs, LPNs, and CNAs. Inspected and star-rated annually by CMS. Accepts Medicare (short-term rehab) and Medicaid (long-term care).

AL

Assisted Living A licensed, long-term care setting for seniors or individuals with disabilities who need help with daily activities — like bathing, dressing, and medication management — but not 24-hour skilled nursing. Offers housing, meals, and around-the-clock support while aiming to maximize resident independence.

Tampa (South Tampa)117 76.3% -9%3.89 +50%-4%$23.6k336.61107A+ 71 -$13.6M$7.3M53.8%105650
Palm Garden Of Tampa
NH

Nursing Home Licensed facility providing 24/7 skilled nursing care for residents with complex, ongoing medical needs. Staffed by RNs, LPNs, and CNAs. Inspected and star-rated annually by CMS. Accepts Medicare (short-term rehab) and Medicaid (long-term care).

AL

Assisted Living A licensed, long-term care setting for seniors or individuals with disabilities who need help with daily activities — like bathing, dressing, and medication management — but not 24-hour skilled nursing. Offers housing, meals, and around-the-clock support while aiming to maximize resident independence.

Tampa (South Florida Terraces)120 90.4% +7%3.95 -49%-2%$0248.0-112A+ 27 Michele Forney$18.7M$7.3M39.3%105591

Frequently Asked Questions about Canterbury Tower

What neighborhood is Canterbury Tower in?

Canterbury Tower is in the South Tampa neighborhood of Tampa.

What languages are spoken at Canterbury Tower?

The team at Canterbury Tower speaks Creole, English, French, Portuguese, Spanish, and Vietnamese.

Who is the owner of Canterbury Tower?

The legal owner and operator of Canterbury Tower is Canterbury Towers, Inc..

Is Canterbury Tower in a walkable area?

Canterbury Tower has a walk score of 56. Moderately walkable. Some errands can be accomplished on foot, with a mix of nearby amenities.

What is the license number of Canterbury Tower?

According to FL state health department records, Canterbury Tower's license number is 13753.

When does Canterbury Tower's license expire?

According to FL state health department records, Canterbury Tower's license expires on January 12, 2026.

What is the occupancy rate at Canterbury Tower?

Canterbury Tower's occupancy is 100%.

Guides for Better Senior Living

Care Cost Calculator: See Prices in Your Area

Nursing Home Data Explorer

Don’t Wait Too Long: 7 Red Flag Signs Your Parent Needs Assisted Living Now

The True Cost of Assisted Living in 2025 – And How Families Are Paying For It

Understanding Senior Living Costs: Pricing Models, Discounts & Financial Assistance

Explore Open Rooms
1 Contact details
2 What type of senior care service are you looking for?
3 What budget do you have in mind for senior care?
4 How soon do you need to find care?
5 Additional details

Thank you for your interest!

Our team will be in touch shortly to help with next steps.