


Total staff
209
Employees
193
Contractors
16
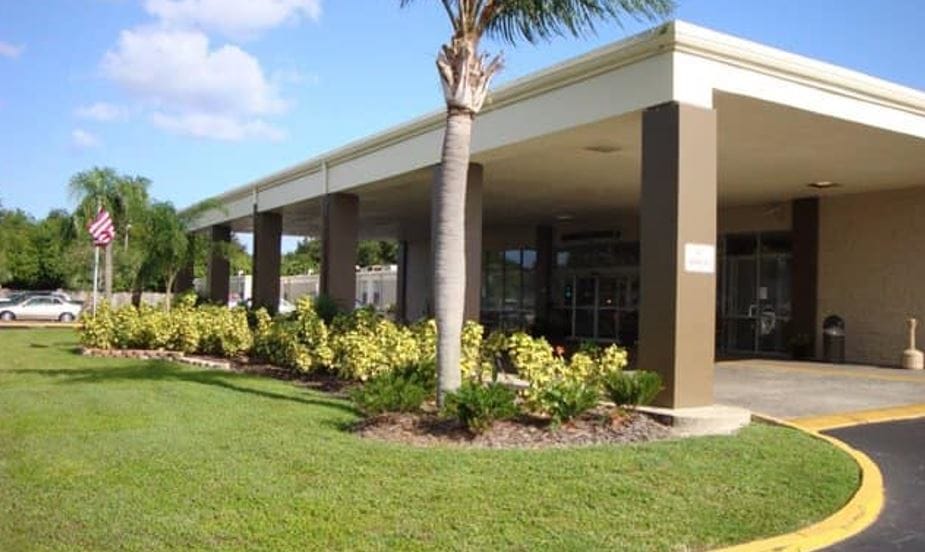
Gandy Crossing is a 160-bed nursing home in South Tampa, right off S Manhattan Ave, and it’s currently running at 88.2% occupancy. That number matters more than people think. It means beds are filled, which usually means families are choosing to stay, not just landing there by default.
The neighborhood itself is walkable enough that you could actually run errands on foot if you wanted to (Walk Score’s a 66), and HCA Florida South Tampa Hospital is only about 3.4 miles away, which is genuinely reassuring if something urgent ever comes up. Downtown Tampa’s a quick 5.3 miles out too, so it’s not stuck in the middle of nowhere.
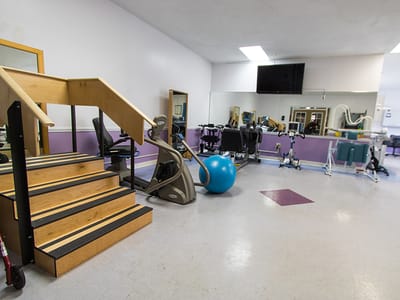
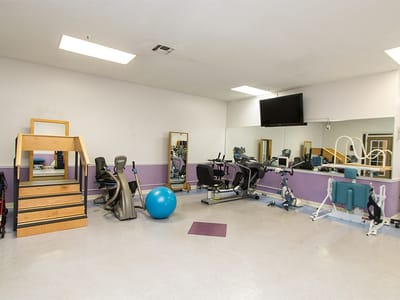
Here’s where it gets specific: nursing care here averages just over 4 hours per resident per day. Nurse aides are doing the bulk of that hands-on work, about 2 hours and 21 minutes daily, while LPNs and RNs round out the rest with medication management, wound care, and monitoring. That breakdown tells you about how care actually gets distributed day to day, not just a vague “we provide quality care” line.
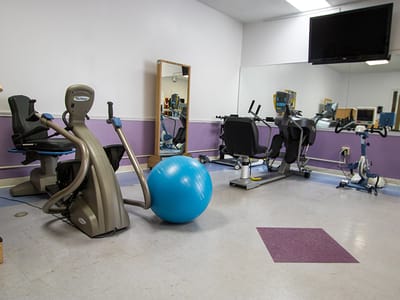
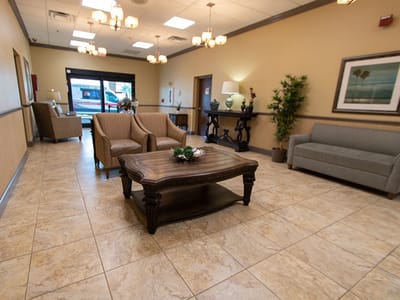
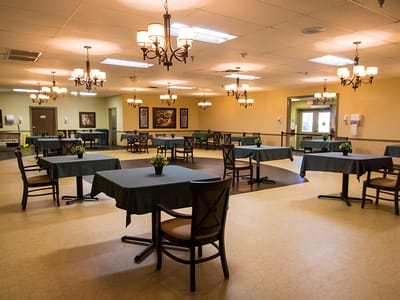
On the softer side, there’s a dining room run with an actual registered dietitian, therapeutic and selective menus, plus case management, counseling, and family support groups. Community outings and organized entertainment fill out the calendar too.
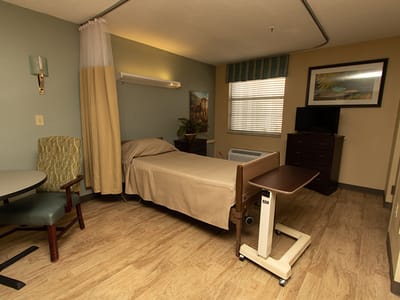
Medicare, Medicaid, and private pay are all accepted, so the financial door isn’t shut for most families walking in. Gandy Crossing reads as a facility built for people who need real clinical support layered with actual daily structure, not just a place to park.
| Staff type | Hours / Day / Resident | vs state avg |
|---|---|---|
|
Registered Nurse (RN)
| 37m per day | ▼ 16% State avg: 44m per day · National avg: 41m per day |
|
LPN / LVN
| 49m per day | ▲ 4% State avg: 47m per day · National avg: 52m per day |
|
Nurse Aide
| 2h 21m per day | ■ Avg State avg: 2h 20m per day · National avg: 2h 21m per day |
|
Weekend Total Nursing
| 3h 22m per day | ▼ 4% State avg: 3h 31m per day · National avg: 3h 26m per day |
|
Physical Therapist
| 10m per day | ▲ 96% State avg: 5m per day · National avg: 4m per day |
|
Weekend RN
| 27m per day | ▼ 16% State avg: 32m per day · National avg: 29m per day |
Reporting period: October 1 – December 31, 2025 (Q4 2025). Source: CMS Payroll-Based Journal report.
Manages medical care and health needs.
Assists with medical care and medications.
Helps with daily care and mobility.
Total hours from contractors
430 contractor hours this quarter
| Certified Nursing Assistant | 80 | 0 | 80 | 31,083 | 92 | 100% | 9 |
| Licensed Practical Nurse | 29 | 15 | 44 | 10,855 | 92 | 100% | 9.2 |
| Registered Nurse | 19 | 1 | 20 | 5,910 | 92 | 100% | 10.4 |
| Physical Therapist | 12 | 0 | 12 | 3,805 | 92 | 100% | 7.6 |
| Occupational Therapy Aide | 13 | 0 | 13 | 2,780 | 92 | 100% | 7.7 |
| Respiratory Therapy Technician | 7 | 0 | 7 | 2,165 | 83 | 90% | 7.6 |
| Clinical Nurse Specialist | 6 | 0 | 6 | 1,708 | 65 | 71% | 7.9 |
| Physical Therapy Assistant | 5 | 0 | 5 | 1,531 | 81 | 88% | 6.9 |
| Dietitian | 4 | 0 | 4 | 1,512 | 92 | 100% | 8.2 |
| Qualified Social Worker | 4 | 0 | 4 | 1,253 | 74 | 80% | 7.6 |
| Speech Language Pathologist | 3 | 0 | 3 | 986 | 70 | 76% | 7.1 |
| Mental Health Service Worker | 2 | 0 | 2 | 944 | 65 | 71% | 8 |
| Physical Therapy Aide | 5 | 0 | 5 | 542 | 64 | 70% | 6.5 |
| Administrator | 1 | 0 | 1 | 520 | 65 | 71% | 8 |
| Nurse Practitioner | 1 | 0 | 1 | 520 | 66 | 72% | 7.9 |
| Medical Director | 1 | 0 | 1 | 156 | 26 | 28% | 6 |
| Nurse Aide in Training | 1 | 0 | 1 | 47 | 4 | 4% | 11.8 |
Federal penalties imposed by CMS for regulatory violations, including civil money penalties (fines) and denials of payment for new Medicare/Medicaid admissions.
Source: CMS Penalties Database
No penalties in the past 3 years
No civil money penalties or payment denials were reported in the last 3 years.
These measures show how residents usually do over time at this home, based on health outcomes and preventive care.
Florida average: 7.4
Florida average: 12.4
Florida average: 10.5%
Florida average: 12.9%
Florida average: 13.5%
Florida average: 2.6%
Florida average: 5.4%
Florida average: 0.9%
Florida average: 6.0%
Florida average: 3.3%
Florida average: 8.0%
Florida average: 97.7%
Florida average: 99.2%
Florida average: 2.10
Florida average: 1.18
Florida average: 94.0%
Florida average: 1.5%
Florida average: 94.7%
Florida average: 26.2%
Florida average: 9.3%
Florida average: 0.8%
Florida average: 53.7%
Florida average: 50.6%
Quality measures are calculated from Minimum Data Set (MDS) assessments. For most measures, lower percentages indicate better care quality.
25% of new residents, usually for short-term rehab.
71% of new residents, often for short stays.
4% of new residents, often for long-term daily care.
Source: CMS Long-Term Care Facility Characteristics (Data as of Jan 2026)
Residents meet regularly to discuss policies, care quality, and activities
Organized group of residents that meets regularly to discuss facility policies, quality of life, and activities.
Data sourced from CMS Long-Term Care Facility Characteristics quarterly report. Payer mix reflects the current resident census by primary payment source.
Historical financial and operational data for Gandy Crossing Care Center from 2011–2023, based on CMS SNF Cost Reports.
Key figures below are for fiscal year ending in 12/2023.
Based on CMS SNF Cost Report for fiscal year ending in 12/2023.
Residents typically stay for brief periods, with frequent admissions and discharges throughout the year.
Most new residents arrive under private pay (71% of admissions), and a typical private pay stay runs around 1 - 2 months.
Coverage residents most often arrive under.
Coverage residents most often leave under.
![]() 5.3 miles from city center
5.3 miles from city center
![]() Estimated distance in miles from Tampa's city center to Gandy Crossing Care Center's address, calculated via Google Maps.
— 3.38 miles to nearest hospital (HCA Florida South Tampa Hospital)
Estimated distance in miles from Tampa's city center to Gandy Crossing Care Center's address, calculated via Google Maps.
— 3.38 miles to nearest hospital (HCA Florida South Tampa Hospital)
Add your location
Info below is compiled from CMS reports & the FL Agency for Health Care Administration (AHCA), senior community websites & trusted data sources such as Walk Score & BBB.
Communities are listed from highest to lowest based on our ranking methodology.
| Canterbury Tower | NH AL IL RC SNF | Tampa (South Tampa) | 17
Facility
17
FL AVG
88
Rank
#873 / 1058 | - | - | 6.47
Facility
6.47
FL AVG
4.04
Rank
#3 / 181 | -6% | +60% | $0
Facility
$0
FL AVG
$78.9k
Rank
#1 / 185 | 95
Facility
95
FL AVG
83
Rank
#128 / 876 | 6
Facility
6
FL AVG
19.7
Rank
#18 / 181 | 3.0
Facility
3.0
FL AVG
4.5
Rank
#39 / 181 | - | 33 | A+ |
56
Facility
56
FL AVG
40
Rank
#407 / 1487 | Caridad Vinas | $3.4MFiscal year ending 12/2023
Facility
$3.4MFiscal year ending 12/2023
FL AVG
$15.7M
Rank
#140 / 184 | $4.8MFiscal year ending 12/2023
Facility
$4.8MFiscal year ending 12/2023
FL AVG
$6.1M
Rank
#158 / 184 | 142.4%Fiscal year ending 12/2023
Facility
142.4%Fiscal year ending 12/2023
FL AVG
39.8%
Rank
#112 / 184 | 105326 | ||||
| Palm Garden Of Tampa | NH HOS PC RC SNF | Tampa (South Florida Terraces) | 120
Facility
120
FL AVG
88
Rank
#253 / 1058 |
93.9%
Facility
93.9%
FL AVG
84.4
Rank
#31 / 125 | +11% | 3.95
Facility
3.95
FL AVG
4.04
Rank
#91 / 181 | -49% | -2% | $0
Facility
$0
FL AVG
$78.9k
Rank
#1 / 185 | - | 24
Facility
24
FL AVG
19.7
Rank
#123 / 181 | 8.0
Facility
8.0
FL AVG
4.5
Rank
#170 / 181 | - | 113 | A+ |
27
Facility
27
FL AVG
40
Rank
#955 / 1487 | Michele Forney | $13.7MFiscal year ending 10/2023
Facility
$13.7MFiscal year ending 10/2023
FL AVG
$15.7M
Rank
#101 / 184 | $7.0MFiscal year ending 10/2023
Facility
$7.0MFiscal year ending 10/2023
FL AVG
$6.1M
Rank
#124 / 184 | 51.3%Fiscal year ending 10/2023
Facility
51.3%Fiscal year ending 10/2023
FL AVG
39.8%
Rank
#124 / 184 | 105591 | ||||
| Northdale Rehabilitation Center | NH RC SNF | Tampa | 120
Facility
120
FL AVG
88
Rank
#253 / 1058 |
92.6%
Facility
92.6%
FL AVG
84.4
Rank
#47 / 125 | +10% | 3.51
Facility
3.51
FL AVG
4.04
Rank
#158 / 181 | -4% | -13% | $0
Facility
$0
FL AVG
$78.9k
Rank
#1 / 185 | - | 15
Facility
15
FL AVG
19.7
Rank
#68 / 181 | 5.0
Facility
5.0
FL AVG
4.5
Rank
#118 / 181 | - | 111 | - |
22
Facility
22
FL AVG
40
Rank
#1057 / 1487 | Brian Mccoy | $14.3MFiscal year ending 12/2023
Facility
$14.3MFiscal year ending 12/2023
FL AVG
$15.7M
Rank
#116 / 184 | $7.4MFiscal year ending 12/2023
Facility
$7.4MFiscal year ending 12/2023
FL AVG
$6.1M
Rank
#106 / 184 | 51.8%Fiscal year ending 12/2023
Facility
51.8%Fiscal year ending 12/2023
FL AVG
39.8%
Rank
#68 / 184 | 105700 | ||||
| Woodbridge Care Center | NH PC SNF | Tampa (Town N County Park) | 120
Facility
120
FL AVG
88
Rank
#253 / 1058 |
94.5%
Facility
94.5%
FL AVG
84.4
Rank
#22 / 125 | +12% | 3.37
Facility
3.37
FL AVG
4.04
Rank
#168 / 181 | +43% | -17% | $4.9k
Facility
$4.9k
FL AVG
$78.9k
Rank
#121 / 185 | - | 21
Facility
21
FL AVG
19.7
Rank
#108 / 181 | 7.0
Facility
7.0
FL AVG
4.5
Rank
#157 / 181 | - | 113 | - |
72
Facility
72
FL AVG
40
Rank
#186 / 1487 | Woodbridge Nursing Holdco LLC | $14.0M*Fiscal year ending 12/2022These figures are from this home's most recent complete cost report — an older period than most facilities report. Compare with that in mind.
Facility
$14.0M*Fiscal year ending 12/2022These figures are from this home's most recent complete cost report — an older period than most facilities report. Compare with that in mind.
FL AVG
$15.7M
Rank
#53 / 184 | $6.7M*Fiscal year ending 12/2022These figures are from this home's most recent complete cost report — an older period than most facilities report. Compare with that in mind.
Facility
$6.7M*Fiscal year ending 12/2022These figures are from this home's most recent complete cost report — an older period than most facilities report. Compare with that in mind.
FL AVG
$6.1M
Rank
#138 / 184 | 47.5%*Fiscal year ending 12/2022These figures are from this home's most recent complete cost report — an older period than most facilities report. Compare with that in mind.
Facility
47.5%*Fiscal year ending 12/2022These figures are from this home's most recent complete cost report — an older period than most facilities report. Compare with that in mind.
FL AVG
39.8%
Rank
#178 / 184 | 105426 | ||||
| Gandy Crossing Care Center | NH SNF | Tampa (South Tampa) | 160
Facility
160
FL AVG
88
Rank
#108 / 1058 |
90.2%
Facility
90.2%
FL AVG
84.4
Rank
#65 / 125 | +7% | 4.09
Facility
4.09
FL AVG
4.04
Rank
#76 / 181 | -21% | +1% | $0
Facility
$0
FL AVG
$78.9k
Rank
#1 / 185 | - | 17
Facility
17
FL AVG
19.7
Rank
#92 / 181 | 5.7
Facility
5.7
FL AVG
4.5
Rank
#139 / 181 | - | 144 | - |
66
Facility
66
FL AVG
40
Rank
#262 / 1487 | Sandra Haywood | $16.2MFiscal year ending 12/2023
Facility
$16.2MFiscal year ending 12/2023
FL AVG
$15.7M
Rank
#87 / 184 | $9.0MFiscal year ending 12/2023
Facility
$9.0MFiscal year ending 12/2023
FL AVG
$6.1M
Rank
#72 / 184 | 55.2%Fiscal year ending 12/2023
Facility
55.2%Fiscal year ending 12/2023
FL AVG
39.8%
Rank
#75 / 184 | 105491 |
Gandy Crossing Care Center is located in Tampa, Florida.
Here are the financial assistance programs available to residents in Florida.
Gandy Crossing Care Center is in the South Tampa neighborhood.
Gandy Crossing Care Center has a walk score of 66. Moderately walkable. Some errands can be accomplished on foot, with a mix of nearby amenities.
Gandy Crossing Care Center's occupancy is 88.2%.
No, Gandy Crossing Care Center has a no-pet policy.
Gandy Crossing Care Center is registered as a for-profit.
Yes — there are 8 photos of Gandy Crossing Care Center in the photo gallery on this page.
Gandy Crossing Care Center is located at 4610 S Manhattan Ave, Tampa, FL 33611.
Care Cost Calculator: See Prices in Your Area
Nursing Home Data Explorer
Don’t Wait Too Long: 7 Red Flag Signs Your Parent Needs Assisted Living Now
The True Cost of Assisted Living in 2025 – And How Families Are Paying For It
Understanding Senior Living Costs: Pricing Models, Discounts & Financial Assistance


