









Charter Senior Living of Annapolis
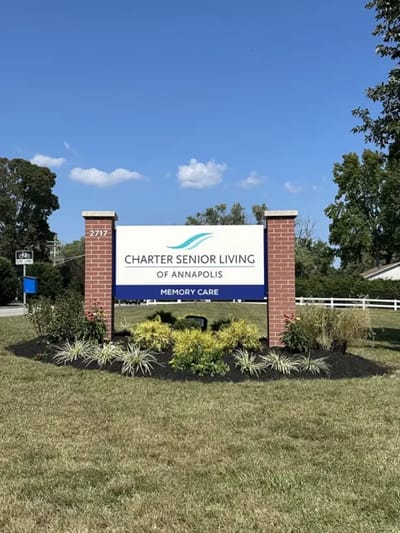
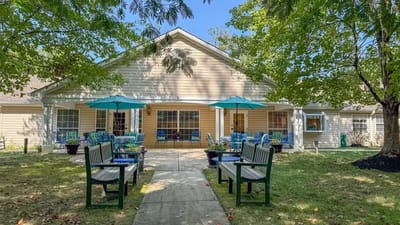
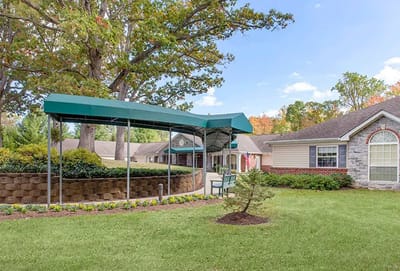
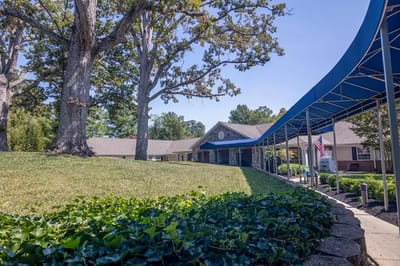
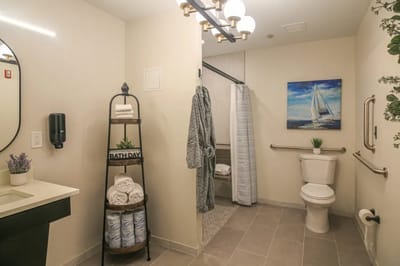
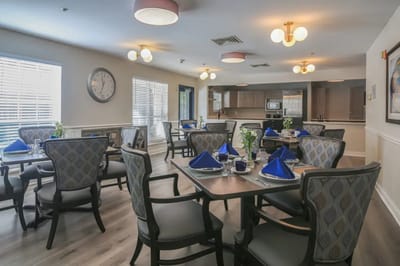
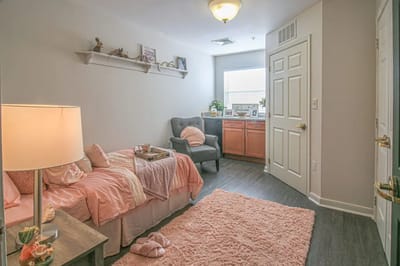
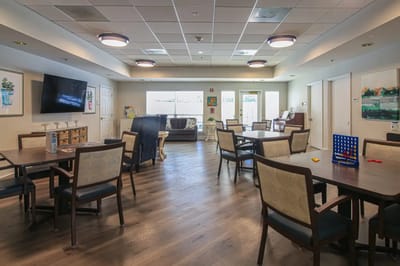
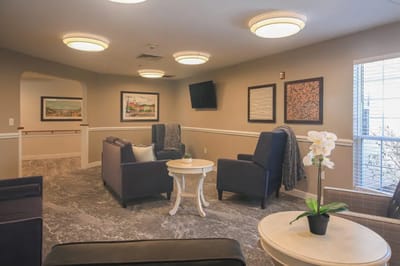
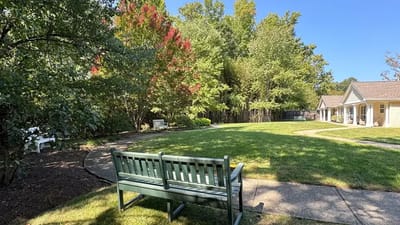
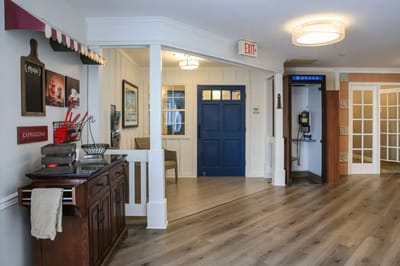
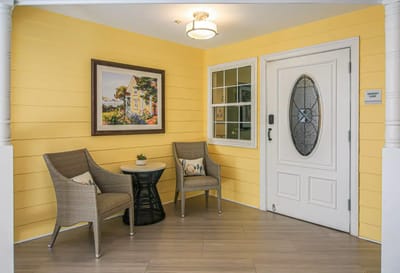
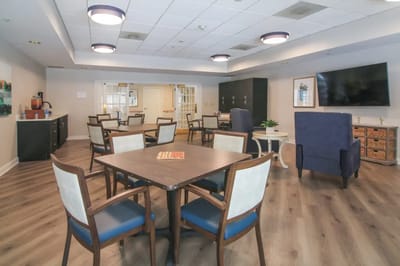
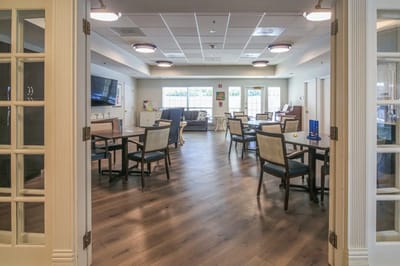
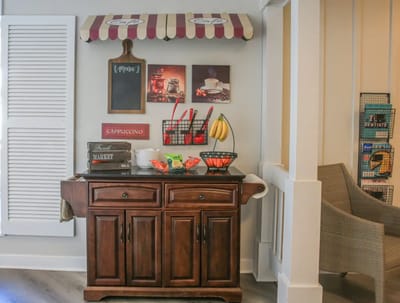
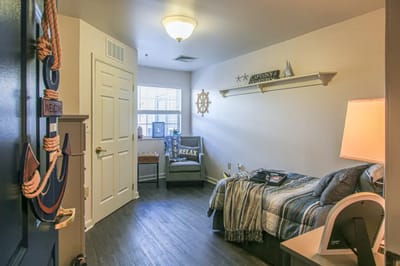
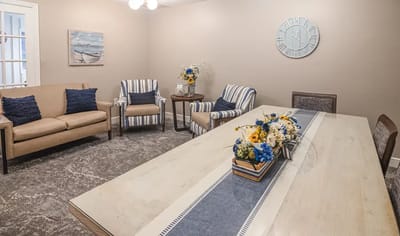
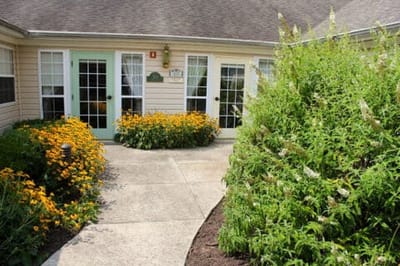
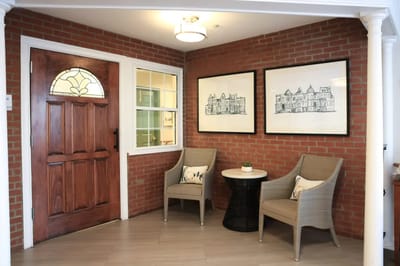
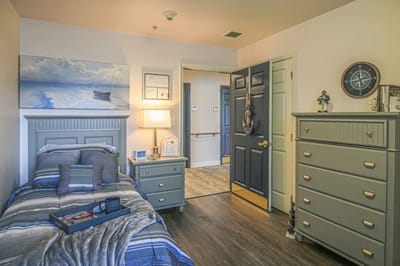



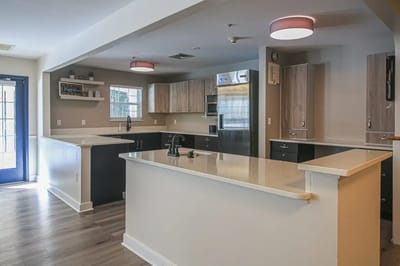
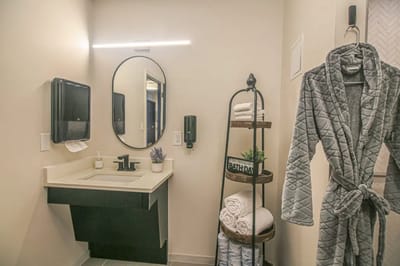

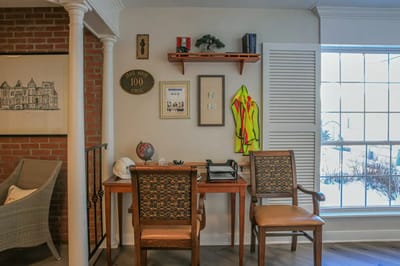

Charter Senior Living of Annapolis
Overview of Charter Senior Living of Annapolis

Charter Senior Living of Annapolis operates a 64-bed memory care community in Annapolis, Maryland, serving residents with Alzheimer’s disease and other dementias. The facility, which has been in operation for 25 years, is licensed as assisted living and is not Medicare or Medicaid certified. It is managed by Executive Director Susan Maupin.
The community delivers 17 documented services concentrated on dementia-specific care and daily living support. Clinical and therapeutic services include physical, occupational, and speech therapy. A dedicated secure Alzheimer’s unit houses residents across three defined care levels reflecting disease progression: mild, moderate, and severe. Staffing operates on a 24-hour awake model. Medical support encompasses catheter care, colostomy care, pressure ulcer management, portable oxygen provision, and on-site medication dispensing.
Home health agency services operate within the facility.
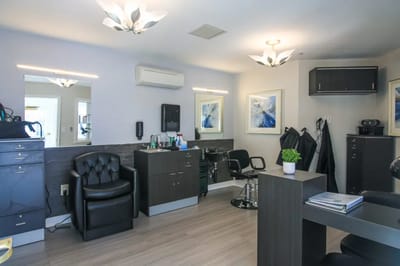
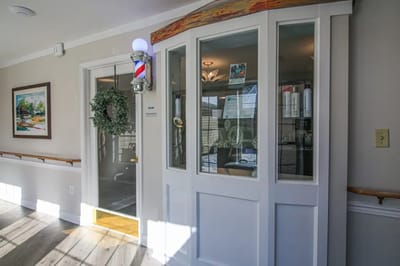
Barber and beauty services, complete laundry management, housekeeping, and three daily meals round out the service portfolio.
Behavioral management and individualized care planning are documented care emphases. The Flourish™ program structures daily activity and cognitive engagement. Lifestyle programming includes scheduled social and recreational activities. Respite care accommodates short-term admissions, enabling family caregivers to take breaks while residents remain in structured, secure environments.
Resident composition at Charter reflects demographic characteristics unusual for assisted living. The gender split is 50% male and 50% female; which is substantially higher male representation than the 31% Maryland average for memory care facilities. Age distribution concentrates at the oldest brackets: 45% are 75–84, and 40% are 85–94, reflecting the advanced age-related needs typical of dementia-focused communities. Racial and ethnic composition stands at 75% White, 20% African American, and 5% Asian, with African American residents represented at rates significantly higher than state averages.
Monthly pricing: shared suites at $7,750; private rooms at $9,795. Pet-friendly policies apply. Visitors are welcome around the clock.
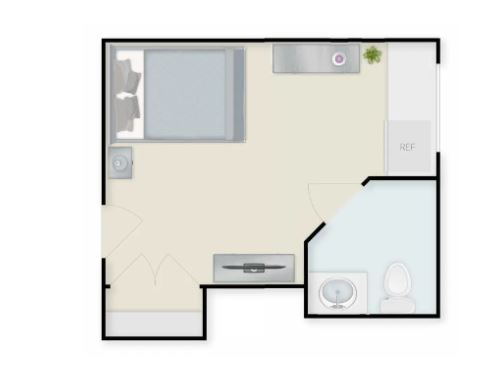
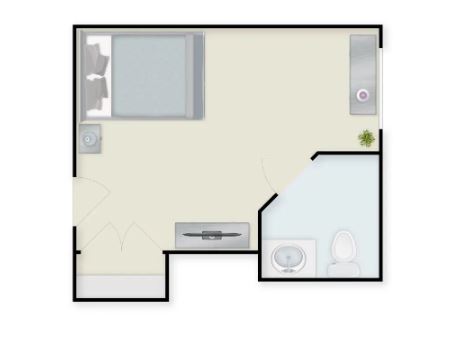
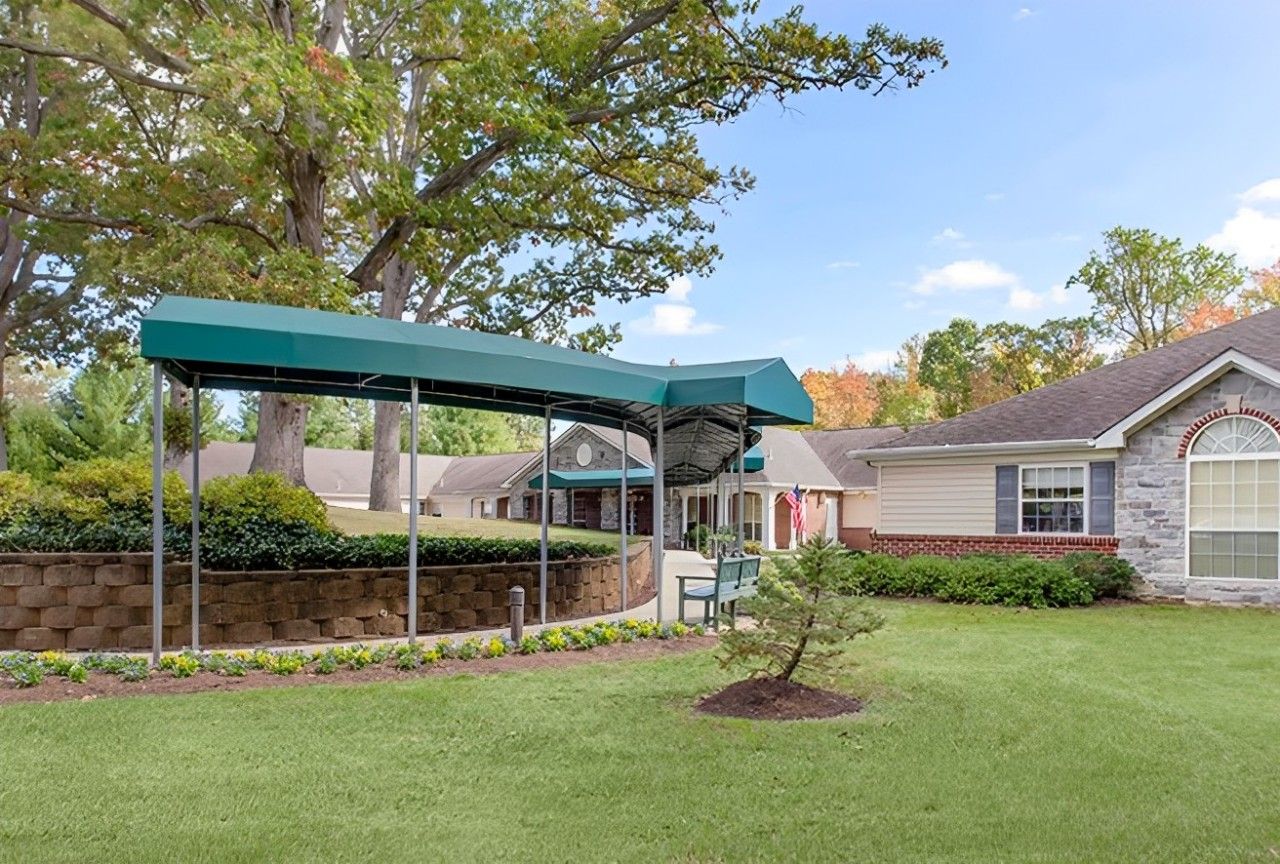
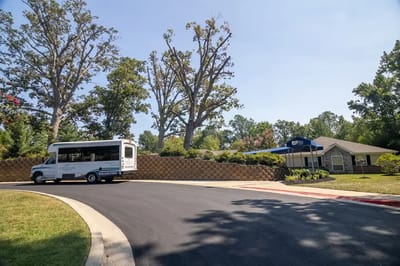
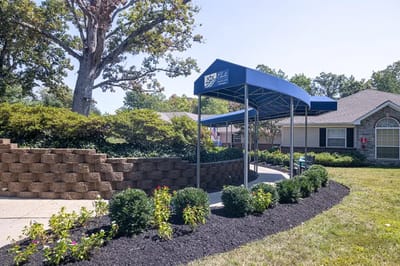
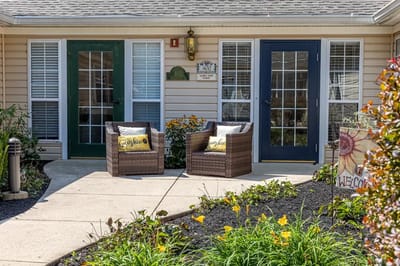
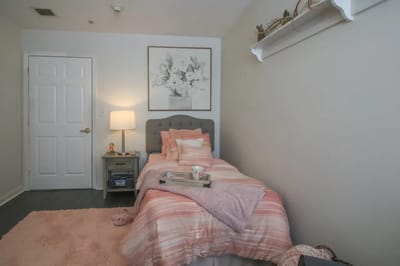
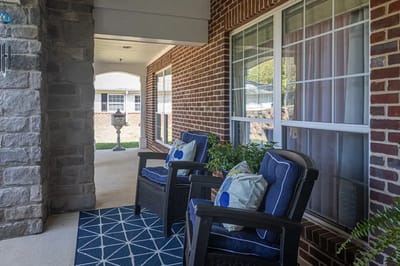
Single-story construction with studio-style accommodations. A minimum age of 62 applies to admission. The secured perimeter environment addresses wandering risk and safety for residents with cognitive impairment.
The facility sits 6.2 miles from central Annapolis with a Walk Score of 16, requiring automobile transportation for most activities.
Charter Senior Living of Annapolis is structured for individuals in middle to advanced dementia stages seeking specialized memory care with behavioral support, therapeutic services, and family-inclusive respite options within a long-established community setting.

64-bed community Rank #203 / 697Bed count — State benchmarkedThis home is ranked 203rd out of 697 homes in Maryland. Shows this facility's certified or reported bed count compared to other Maryland facilities. Larger communities may offer more amenities, programs, and on-site services for residents and families.Rankings are based only on facilities in Maryland that report data for that category. Facilities without available data are excluded from the ranking.Click the rank badge to see the full State ranking.Click here to see the full State ranking.
A moderately sized community that may balance personal attention with shared amenities and social activities.

25 years in operation Rank #83 / 208Years in operation — State benchmarkedThis home is ranked 83rd out of 208 homes in Maryland. Shows how long this facility has been in operation compared to other Maryland facilities. Longer operating histories may benefit residents, families, and staff.Rankings are based only on facilities in Maryland that report data for that category. Facilities without available data are excluded from the ranking.Click the rank badge to see the full State ranking.Click here to see the full State ranking.
A longer operating history, which may indicate experience navigating regulations and delivering ongoing care.

Walk Score: 16 / 100 Rank #772 / 985Walk Score — State benchmarkedThis home is ranked 772nd out of 985 homes in Maryland. Shows how walkable this facility's neighborhood is compared to the average Walk Score across Maryland facilities. Higher scores benefit residents, families, and staff.Rankings are based only on facilities in Maryland that report data for that category. Facilities without available data are excluded from the ranking.Click the rank badge to see the full State ranking.Click here to see the full State ranking.
Car-dependent. Most errands require a car, with limited nearby walkable options.
About this community
Facility TypeAssisted Living
CountyAnne Arundel
Private Room
$279 - $290 per day
Semi-Private Room
$224 - $235 per day
Secured Perimeter
Hospice Affiliations

Rehabilitation Services
Respite Care
Nursing Services
24-Hour Staffing
Dedicated Alzheimer's Unit
Mild Alzheimer's Level
Moderate Alzheimer's Level
Severe Alzheimer's Level
Visitor PolicyVisitors are welcome 24 hours a day, 7 days a week.
HousekeepingYes
Specific ProgramsFlourish℠ Programming, Short-Term Stays (Respite Care), Daily lifestyle programming and activities
Operating HoursVisitors are welcome 24 hours a day, 7 days a week.
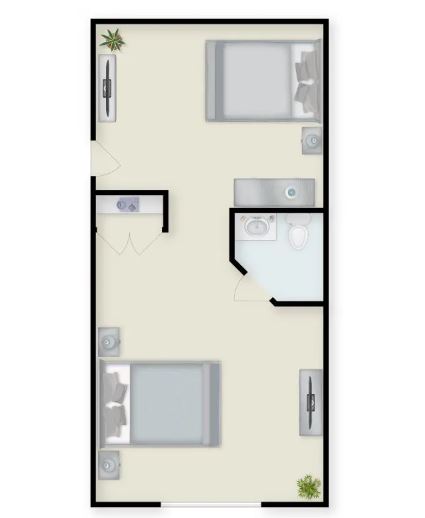
Shared suite$7,750 per month
Private room$9,795 per month
Demographics
Resident demographic information for this facility.
Gender
- Female 50%
- Male 50%
Age Distribution
- 75-84 45%
- 85-94 40%
- 65-74 10%
- ≤64 5%
Ethnicity
- White 75%
- African American 20%
- Asian 5%
What does this home offer?

Pets Allowed

Housing Options: Studio

Building Type: Single-story

Transportation Services

Fitness and Recreation
Places of interest near Charter Senior Living of Annapolis
 4.0 miles from city center
 Estimated distance in miles from Annapolis's city center to Charter Senior Living of Annapolis's address, calculated via Google Maps.
Calculate Travel Distance to Charter Senior Living of Annapolis
Add your location
Compare Memory Care around Annapolis
The information below is reported by the Maryland Department of Health, Office of Health Care Quality.
| Brightview South River | MC AL | Edgewater (Lee Airpark Drive) | 100
Facility
100
MD AVG
43
Rank
#117 / 697 | Yes |
49
Facility
49
MD AVG
43
Rank
#431 / 985 | Studio / 1 Bed / 2 Bed | 14
Facility
14
MD AVG
21
Rank
#138 / 208 | - |
30% Male Residents — State Benchmarked 30% of residents are male, compared to the Maryland average of 31%. This facility caters to a majority female resident pool (70% female), consistent with the broader assisted living trend where women significantly outnumber men. |
70% Female Residents — State Benchmarked 70% of residents are female, compared to the Maryland average of 69%. Women comprise the large majority, consistent with national assisted living demographics where women live longer and enter care facilities at higher rates. |
95% White Residents — State Benchmarked 95% of residents are reported as White, compared to the Maryland average of 81%. A higher White share than is typical for assisted living in Maryland in this dataset — compare with peer facilities for local context. |
1% African American Residents — State Benchmarked 1% of residents are reported as African American or Black, compared to the Maryland average of 13%. A lower African American share than is typical in Maryland; local markets still vary widely. |
4% Other Ethnicity Residents — State Benchmarked 4% of residents fall into categories other than White or African American (combined), compared to the Maryland average of 6%. This column aggregates Hispanic, Asian, multiracial, and any other labeled groups that are not classified as White or African American. Reported subgroups in this total: Hispanic (2%), Mixed Race (1%). |
2% Residents Age 65–74 — State Benchmarked 2% of residents are 65–74, compared to the Maryland average of 13%. Fewer younger seniors suggests the resident population skews older, likely requiring higher acuity care and more hands-on support. |
52% Residents Age 75–84 — State Benchmarked 52% of residents are 75–84, compared to the Maryland average of 31%. A high concentration in this mid-range bracket, where residents typically need moderate support with daily activities. |
37% Residents Age 85–94 — State Benchmarked 37% of residents are 85–94, compared to the Maryland average of 44%. The population here skews younger than the statewide norm, which may indicate a more active, lower-acuity community. |
9% Residents Age 95+ — State Benchmarked 9% of residents are 95 or older, compared to the Maryland average of 16%. Most residents here have not yet reached the oldest-old bracket, suggesting a younger overall community. |
| Ginger Cove | MC AL HC IL NH | Annapolis (River Crescent Drive) | 96
Facility
96
MD AVG
43
Rank
#140 / 697 | No |
51
Facility
51
MD AVG
43
Rank
#413 / 985 | 1 Bed / 2 Bed | 42
Facility
42
MD AVG
21
Rank
#8 / 208 | A+ |
40% Male Residents — State Benchmarked 40% of residents are male, compared to the Maryland average of 31%. A relatively balanced gender mix for assisted living, where facilities typically skew heavily female. |
60% Female Residents — State Benchmarked 60% of residents are female, compared to the Maryland average of 69%. Closer to an even gender split than most assisted living facilities, which typically have 65–75% female residents. |
100% White Residents — State Benchmarked 100% of residents are reported as White, compared to the Maryland average of 81%. A higher White share than is typical for assisted living in Maryland in this dataset — compare with peer facilities for local context. |
0% African American Residents — State Benchmarked 0% of residents are reported as African American or Black, compared to the Maryland average of 13%. A lower African American share than is typical in Maryland; local markets still vary widely. |
0% Other Ethnicity Residents — State Benchmarked 0% of residents fall into categories other than White or African American (combined), compared to the Maryland average of 6%. This column aggregates Hispanic, Asian, multiracial, and any other labeled groups that are not classified as White or African American. | - |
13% Residents Age 75–84 — State Benchmarked 13% of residents are 75–84, compared to the Maryland average of 31%. Below the state norm — the resident mix may skew either younger or older than this typical middle bracket. |
64% Residents Age 85–94 — State Benchmarked 64% of residents are 85–94, compared to the Maryland average of 44%. A high concentration of very elderly residents signals a higher-acuity facility with experience caring for advanced age-related needs. |
22% Residents Age 95+ — State Benchmarked 22% of residents are 95 or older, compared to the Maryland average of 16%. A high proportion of the oldest-old suggests strong end-of-life care experience and very-high-acuity capabilities. |
| Brightview Annapolis | MC AL IL | Annapolis | 85
Facility
85
MD AVG
43
Rank
#168 / 697 | Yes |
34
Facility
34
MD AVG
43
Rank
#590 / 985 | Studio / 1 Bed / 2 Bed | 8
Facility
8
MD AVG
21
Rank
#162 / 208 | - |
27% Male Residents — State Benchmarked 27% of residents are male, compared to the Maryland average of 31%. This facility caters to a majority female resident pool (73% female), consistent with the broader assisted living trend where women significantly outnumber men. |
73% Female Residents — State Benchmarked 73% of residents are female, compared to the Maryland average of 69%. Women comprise the large majority, consistent with national assisted living demographics where women live longer and enter care facilities at higher rates. |
97% White Residents — State Benchmarked 97% of residents are reported as White, compared to the Maryland average of 81%. A higher White share than is typical for assisted living in Maryland in this dataset — compare with peer facilities for local context. |
0% African American Residents — State Benchmarked 0% of residents are reported as African American or Black, compared to the Maryland average of 13%. A lower African American share than is typical in Maryland; local markets still vary widely. |
3% Other Ethnicity Residents — State Benchmarked 3% of residents fall into categories other than White or African American (combined), compared to the Maryland average of 6%. This column aggregates Hispanic, Asian, multiracial, and any other labeled groups that are not classified as White or African American. Reported subgroups in this total: Hispanic (3%). |
3% Residents Age 65–74 — State Benchmarked 3% of residents are 65–74, compared to the Maryland average of 13%. Fewer younger seniors suggests the resident population skews older, likely requiring higher acuity care and more hands-on support. |
27% Residents Age 75–84 — State Benchmarked 27% of residents are 75–84, compared to the Maryland average of 31%. This is the second most common age bracket in assisted living, representing residents with moderate care needs. |
59% Residents Age 85–94 — State Benchmarked 59% of residents are 85–94, compared to the Maryland average of 44%. A high concentration of very elderly residents signals a higher-acuity facility with experience caring for advanced age-related needs. |
9% Residents Age 95+ — State Benchmarked 9% of residents are 95 or older, compared to the Maryland average of 16%. Most residents here have not yet reached the oldest-old bracket, suggesting a younger overall community. |
| Charter Senior Living of Annapolis | MC | Annapolis | 64
Facility
64
MD AVG
43
Rank
#203 / 697 | Yes |
16
Facility
16
MD AVG
43
Rank
#772 / 985 | Studio | 25
Facility
25
MD AVG
21
Rank
#83 / 208 | - |
50% Male Residents — State Benchmarked 50% of residents are male, compared to the Maryland average of 31%. An unusually high male share for assisted living, where most facilities skew heavily female. |
50% Female Residents — State Benchmarked 50% of residents are female, compared to the Maryland average of 69%. Closer to an even gender split than most assisted living facilities, which typically have 65–75% female residents. |
75% White Residents — State Benchmarked 75% of residents are reported as White, compared to the Maryland average of 81%. Close to the average for this category among assisted living facilities in Maryland with reported race/ethnicity data. |
20% African American Residents — State Benchmarked 20% of residents are reported as African American or Black, compared to the Maryland average of 13%. In line with the Maryland average for African American residents among facilities reporting this breakdown. |
5% Other Ethnicity Residents — State Benchmarked 5% of residents fall into categories other than White or African American (combined), compared to the Maryland average of 6%. This column aggregates Hispanic, Asian, multiracial, and any other labeled groups that are not classified as White or African American. Reported subgroups in this total: Asian (5%). |
10% Residents Age 65–74 — State Benchmarked 10% of residents are 65–74, compared to the Maryland average of 13%. Fewer younger seniors suggests the resident population skews older, likely requiring higher acuity care and more hands-on support. |
45% Residents Age 75–84 — State Benchmarked 45% of residents are 75–84, compared to the Maryland average of 31%. A high concentration in this mid-range bracket, where residents typically need moderate support with daily activities. |
40% Residents Age 85–94 — State Benchmarked 40% of residents are 85–94, compared to the Maryland average of 44%. This is typically the most common age bracket in assisted living — this facility is in line with the statewide norm. | - |
| La Casa LLC | MC HC NC NH | Annapolis (Parole) | 16
Facility
16
MD AVG
43
Rank
#260 / 697 | No |
29
Facility
29
MD AVG
43
Rank
#638 / 985 | Private Rooms | 12
Facility
12
MD AVG
21
Rank
#145 / 208 | - |
33% Male Residents — State Benchmarked 33% of residents are male, compared to the Maryland average of 31%. This facility caters to a majority female resident pool (67% female), consistent with the broader assisted living trend where women significantly outnumber men. |
67% Female Residents — State Benchmarked 67% of residents are female, compared to the Maryland average of 69%. Women comprise the large majority, consistent with national assisted living demographics where women live longer and enter care facilities at higher rates. |
100% White Residents — State Benchmarked 100% of residents are reported as White, compared to the Maryland average of 81%. A higher White share than is typical for assisted living in Maryland in this dataset — compare with peer facilities for local context. |
0% African American Residents — State Benchmarked 0% of residents are reported as African American or Black, compared to the Maryland average of 13%. A lower African American share than is typical in Maryland; local markets still vary widely. |
0% Other Ethnicity Residents — State Benchmarked 0% of residents fall into categories other than White or African American (combined), compared to the Maryland average of 6%. This column aggregates Hispanic, Asian, multiracial, and any other labeled groups that are not classified as White or African American. |
13% Residents Age 65–74 — State Benchmarked 13% of residents are 65–74, compared to the Maryland average of 13%. In line with the statewide profile for this youngest senior bracket in assisted living. |
33% Residents Age 75–84 — State Benchmarked 33% of residents are 75–84, compared to the Maryland average of 31%. This is the second most common age bracket in assisted living, representing residents with moderate care needs. |
53% Residents Age 85–94 — State Benchmarked 53% of residents are 85–94, compared to the Maryland average of 44%. A high concentration of very elderly residents signals a higher-acuity facility with experience caring for advanced age-related needs. | - |
Financial Assistance for
Memory Care in Maryland
Charter Senior Living of Annapolis is located in Annapolis, Maryland.
Here are the financial assistance programs available to residents in Maryland.

Frequently Asked Questions about Charter Senior Living of Annapolis
Is Charter Senior Living of Annapolis in a walkable area?
Charter Senior Living of Annapolis has a walk score of 16. Car-dependent. Most errands require a car, with limited nearby walkable options.
Does Charter Senior Living of Annapolis have different floorplan options?
Yes — see the floorplan options available at Charter Senior Living of Annapolis on this page.
How many beds does Charter Senior Living of Annapolis have?
Charter Senior Living of Annapolis has 64 beds.
Are there photos of Charter Senior Living of Annapolis?
Yes — there are 45 photos of Charter Senior Living of Annapolis in the photo gallery on this page.
What is the address of Charter Senior Living of Annapolis?
Charter Senior Living of Annapolis is located at 2717 Riva Rd, Annapolis, MD 21401.
What is the phone number of Charter Senior Living of Annapolis?
(410) 648-2355 will put you in contact with the team at Charter Senior Living of Annapolis.
What county is Charter Senior Living of Annapolis located in?
Charter Senior Living of Annapolis is in Anne Arundel County.
Guides for Better Senior Living
Updated on


