| Annapolis (River Crescent Drive) | 96 | No | | 1 Bed / 2 Bed | 42 |
40%
Male Residents — State Benchmarked
40% of residents are male, compared to the Maryland average of 31%. A relatively balanced gender mix for assisted living, where facilities typically skew heavily female. |
60%
Female Residents — State Benchmarked
60% of residents are female, compared to the Maryland average of 69%. Closer to an even gender split than most assisted living facilities, which typically have 65–75% female residents. |
100%
White Residents — State Benchmarked
100% of residents are reported as White, compared to the Maryland average of 81%. A higher White share than is typical for assisted living in Maryland in this dataset — compare with peer facilities for local context. |
0%
African American Residents — State Benchmarked
0% of residents are reported as African American or Black, compared to the Maryland average of 13%. A lower African American share than is typical in Maryland; local markets still vary widely. |
0%
Other Ethnicity Residents — State Benchmarked
0% of residents fall into categories other than White or African American (combined), compared to the Maryland average of 6%. This column aggregates Hispanic, Asian, multiracial, and any other labeled groups that are not classified as White or African American. | - |
13%
Residents Age 75–84 — State Benchmarked
13% of residents are 75–84, compared to the Maryland average of 31%. Below the state norm — the resident mix may skew either younger or older than this typical middle bracket. |
64%
Residents Age 85–94 — State Benchmarked
64% of residents are 85–94, compared to the Maryland average of 44%. A high concentration of very elderly residents signals a higher-acuity facility with experience caring for advanced age-related needs. |
22%
Residents Age 95+ — State Benchmarked
22% of residents are 95 or older, compared to the Maryland average of 16%. A high proportion of the oldest-old suggests strong end-of-life care experience and very-high-acuity capabilities. |
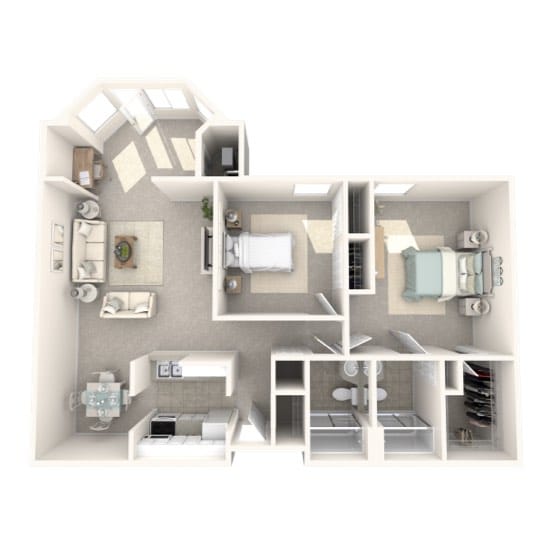
| Annapolis | 106 | Yes | | Studio / 1 Bed / 2 Bed | 30 |
31%
Male Residents — State Benchmarked
31% of residents are male, compared to the Maryland average of 31%. This facility caters to a majority female resident pool (69% female), consistent with the broader assisted living trend where women significantly outnumber men. |
69%
Female Residents — State Benchmarked
69% of residents are female, compared to the Maryland average of 69%. Women comprise the large majority, consistent with national assisted living demographics where women live longer and enter care facilities at higher rates. |
90%
White Residents — State Benchmarked
90% of residents are reported as White, compared to the Maryland average of 81%. A higher White share than is typical for assisted living in Maryland in this dataset — compare with peer facilities for local context. |
6%
African American Residents — State Benchmarked
6% of residents are reported as African American or Black, compared to the Maryland average of 13%. In line with the Maryland average for African American residents among facilities reporting this breakdown. |
4%
Other Ethnicity Residents — State Benchmarked
4% of residents fall into categories other than White or African American (combined), compared to the Maryland average of 6%. This column aggregates Hispanic, Asian, multiracial, and any other labeled groups that are not classified as White or African American. Reported subgroups in this total: American Indian (1%), Hawaiian/Pacific Islander (1%), Hispanic (1%). |
12%
Residents Age 65–74 — State Benchmarked
12% of residents are 65–74, compared to the Maryland average of 13%. In line with the statewide profile for this youngest senior bracket in assisted living. |
22%
Residents Age 75–84 — State Benchmarked
22% of residents are 75–84, compared to the Maryland average of 31%. Below the state norm — the resident mix may skew either younger or older than this typical middle bracket. |
65%
Residents Age 85–94 — State Benchmarked
65% of residents are 85–94, compared to the Maryland average of 44%. A high concentration of very elderly residents signals a higher-acuity facility with experience caring for advanced age-related needs. | - |
| Edgewater (Lee Airpark Drive) | 100 | Yes | | Studio / 1 Bed / 2 Bed | 14 |
30%
Male Residents — State Benchmarked
30% of residents are male, compared to the Maryland average of 31%. This facility caters to a majority female resident pool (70% female), consistent with the broader assisted living trend where women significantly outnumber men. |
70%
Female Residents — State Benchmarked
70% of residents are female, compared to the Maryland average of 69%. Women comprise the large majority, consistent with national assisted living demographics where women live longer and enter care facilities at higher rates. |
95%
White Residents — State Benchmarked
95% of residents are reported as White, compared to the Maryland average of 81%. A higher White share than is typical for assisted living in Maryland in this dataset — compare with peer facilities for local context. |
1%
African American Residents — State Benchmarked
1% of residents are reported as African American or Black, compared to the Maryland average of 13%. A lower African American share than is typical in Maryland; local markets still vary widely. |
4%
Other Ethnicity Residents — State Benchmarked
4% of residents fall into categories other than White or African American (combined), compared to the Maryland average of 6%. This column aggregates Hispanic, Asian, multiracial, and any other labeled groups that are not classified as White or African American. Reported subgroups in this total: Hispanic (2%), Mixed Race (1%). |
2%
Residents Age 65–74 — State Benchmarked
2% of residents are 65–74, compared to the Maryland average of 13%. Fewer younger seniors suggests the resident population skews older, likely requiring higher acuity care and more hands-on support. |
52%
Residents Age 75–84 — State Benchmarked
52% of residents are 75–84, compared to the Maryland average of 31%. A high concentration in this mid-range bracket, where residents typically need moderate support with daily activities. |
37%
Residents Age 85–94 — State Benchmarked
37% of residents are 85–94, compared to the Maryland average of 44%. The population here skews younger than the statewide norm, which may indicate a more active, lower-acuity community. |
9%
Residents Age 95+ — State Benchmarked
9% of residents are 95 or older, compared to the Maryland average of 16%. Most residents here have not yet reached the oldest-old bracket, suggesting a younger overall community. |
| Annapolis | 88 | Yes | | Studio / 1 Bed | 5 |
32%
Male Residents — State Benchmarked
32% of residents are male, compared to the Maryland average of 31%. This facility caters to a majority female resident pool (68% female), consistent with the broader assisted living trend where women significantly outnumber men. |
68%
Female Residents — State Benchmarked
68% of residents are female, compared to the Maryland average of 69%. Women comprise the large majority, consistent with national assisted living demographics where women live longer and enter care facilities at higher rates. |
99%
White Residents — State Benchmarked
99% of residents are reported as White, compared to the Maryland average of 81%. A higher White share than is typical for assisted living in Maryland in this dataset — compare with peer facilities for local context. |
0%
African American Residents — State Benchmarked
0% of residents are reported as African American or Black, compared to the Maryland average of 13%. A lower African American share than is typical in Maryland; local markets still vary widely. |
1%
Other Ethnicity Residents — State Benchmarked
1% of residents fall into categories other than White or African American (combined), compared to the Maryland average of 6%. This column aggregates Hispanic, Asian, multiracial, and any other labeled groups that are not classified as White or African American. Reported subgroups in this total: Hispanic (1%). |
14%
Residents Age 65–74 — State Benchmarked
14% of residents are 65–74, compared to the Maryland average of 13%. In line with the statewide profile for this youngest senior bracket in assisted living. |
28%
Residents Age 75–84 — State Benchmarked
28% of residents are 75–84, compared to the Maryland average of 31%. This is the second most common age bracket in assisted living, representing residents with moderate care needs. |
50%
Residents Age 85–94 — State Benchmarked
50% of residents are 85–94, compared to the Maryland average of 44%. A high concentration of very elderly residents signals a higher-acuity facility with experience caring for advanced age-related needs. |
8%
Residents Age 95+ — State Benchmarked
8% of residents are 95 or older, compared to the Maryland average of 16%. Most residents here have not yet reached the oldest-old bracket, suggesting a younger overall community. |
| Annapolis | 85 | Yes | | Studio / 1 Bed / 2 Bed | 8 |
27%
Male Residents — State Benchmarked
27% of residents are male, compared to the Maryland average of 31%. This facility caters to a majority female resident pool (73% female), consistent with the broader assisted living trend where women significantly outnumber men. |
73%
Female Residents — State Benchmarked
73% of residents are female, compared to the Maryland average of 69%. Women comprise the large majority, consistent with national assisted living demographics where women live longer and enter care facilities at higher rates. |
97%
White Residents — State Benchmarked
97% of residents are reported as White, compared to the Maryland average of 81%. A higher White share than is typical for assisted living in Maryland in this dataset — compare with peer facilities for local context. |
0%
African American Residents — State Benchmarked
0% of residents are reported as African American or Black, compared to the Maryland average of 13%. A lower African American share than is typical in Maryland; local markets still vary widely. |
3%
Other Ethnicity Residents — State Benchmarked
3% of residents fall into categories other than White or African American (combined), compared to the Maryland average of 6%. This column aggregates Hispanic, Asian, multiracial, and any other labeled groups that are not classified as White or African American. Reported subgroups in this total: Hispanic (3%). |
3%
Residents Age 65–74 — State Benchmarked
3% of residents are 65–74, compared to the Maryland average of 13%. Fewer younger seniors suggests the resident population skews older, likely requiring higher acuity care and more hands-on support. |
27%
Residents Age 75–84 — State Benchmarked
27% of residents are 75–84, compared to the Maryland average of 31%. This is the second most common age bracket in assisted living, representing residents with moderate care needs. |
59%
Residents Age 85–94 — State Benchmarked
59% of residents are 85–94, compared to the Maryland average of 44%. A high concentration of very elderly residents signals a higher-acuity facility with experience caring for advanced age-related needs. |
9%
Residents Age 95+ — State Benchmarked
9% of residents are 95 or older, compared to the Maryland average of 16%. Most residents here have not yet reached the oldest-old bracket, suggesting a younger overall community. |
| Annapolis | 64 | Yes | | Studio | 25 |
50%
Male Residents — State Benchmarked
50% of residents are male, compared to the Maryland average of 31%. An unusually high male share for assisted living, where most facilities skew heavily female. |
50%
Female Residents — State Benchmarked
50% of residents are female, compared to the Maryland average of 69%. Closer to an even gender split than most assisted living facilities, which typically have 65–75% female residents. |
75%
White Residents — State Benchmarked
75% of residents are reported as White, compared to the Maryland average of 81%. Close to the average for this category among assisted living facilities in Maryland with reported race/ethnicity data. |
20%
African American Residents — State Benchmarked
20% of residents are reported as African American or Black, compared to the Maryland average of 13%. In line with the Maryland average for African American residents among facilities reporting this breakdown. |
5%
Other Ethnicity Residents — State Benchmarked
5% of residents fall into categories other than White or African American (combined), compared to the Maryland average of 6%. This column aggregates Hispanic, Asian, multiracial, and any other labeled groups that are not classified as White or African American. Reported subgroups in this total: Asian (5%). |
10%
Residents Age 65–74 — State Benchmarked
10% of residents are 65–74, compared to the Maryland average of 13%. Fewer younger seniors suggests the resident population skews older, likely requiring higher acuity care and more hands-on support. |
45%
Residents Age 75–84 — State Benchmarked
45% of residents are 75–84, compared to the Maryland average of 31%. A high concentration in this mid-range bracket, where residents typically need moderate support with daily activities. |
40%
Residents Age 85–94 — State Benchmarked
40% of residents are 85–94, compared to the Maryland average of 44%. This is typically the most common age bracket in assisted living — this facility is in line with the statewide norm. | - |
| Annapolis | - | Yes | | Studio / 1 Bed / 2 Bed | - | - | - | - | - | - | - | - | - | - |
| Annapolis (Parole) | 16 | No | | Private Rooms | 12 |
33%
Male Residents — State Benchmarked
33% of residents are male, compared to the Maryland average of 31%. This facility caters to a majority female resident pool (67% female), consistent with the broader assisted living trend where women significantly outnumber men. |
67%
Female Residents — State Benchmarked
67% of residents are female, compared to the Maryland average of 69%. Women comprise the large majority, consistent with national assisted living demographics where women live longer and enter care facilities at higher rates. |
100%
White Residents — State Benchmarked
100% of residents are reported as White, compared to the Maryland average of 81%. A higher White share than is typical for assisted living in Maryland in this dataset — compare with peer facilities for local context. |
0%
African American Residents — State Benchmarked
0% of residents are reported as African American or Black, compared to the Maryland average of 13%. A lower African American share than is typical in Maryland; local markets still vary widely. |
0%
Other Ethnicity Residents — State Benchmarked
0% of residents fall into categories other than White or African American (combined), compared to the Maryland average of 6%. This column aggregates Hispanic, Asian, multiracial, and any other labeled groups that are not classified as White or African American. |
13%
Residents Age 65–74 — State Benchmarked
13% of residents are 65–74, compared to the Maryland average of 13%. In line with the statewide profile for this youngest senior bracket in assisted living. |
33%
Residents Age 75–84 — State Benchmarked
33% of residents are 75–84, compared to the Maryland average of 31%. This is the second most common age bracket in assisted living, representing residents with moderate care needs. |
53%
Residents Age 85–94 — State Benchmarked
53% of residents are 85–94, compared to the Maryland average of 44%. A high concentration of very elderly residents signals a higher-acuity facility with experience caring for advanced age-related needs. | - |
| Annapolis | - | Yes | | 1 Bed / 2 Bed | - | - | - | - | - | - | - | - | - | - |
| Annapolis (Bay Front Drive) | - | Yes | | 1 Bed / 2 Bed | 17 | - | - | - | - | - | - | - | - | - |
| Annapolis | - | No | | - | - | - | - | - | - | - | - | - | - | - |
| Annapolis | - | Yes | | Private Studio / Companion Suites | - | - | - | - | - | - | - | - | - | - |
| Annapolis | - | Yes | | - | - | - | - | - | - | - | - | - | - | - |
| Annapolis | 4 | No | | Private / Semi-Private Rooms | - | - | - | - | - | - | - | - | - | - |