Complete Care at Annapolis
Nursing Home, Hospice Care, Palliative Care & Respite Care · Annapolis, MD
CMS overall rating Info CMS (the Centers for Medicare & Medicaid Services) is the federal agency that rates nursing home quality. Its Overall Rating runs from 1 to 5 stars, combining health inspections, staffing, and quality measures, with inspections weighted most heavily.

Complete Care at Annapolis

Nursing Home, Hospice Care, Palliative Care & Respite Care · Annapolis, MD
CMS overall rating Info CMS (the Centers for Medicare & Medicaid Services) is the federal agency that rates nursing home quality. Its Overall Rating runs from 1 to 5 stars, combining health inspections, staffing, and quality measures, with inspections weighted most heavily.
Calculator: See prices in your area
Complete Care at Annapolis accepts Medicare, Medicaid, and private pay.

Overview of Complete Care at Annapolis

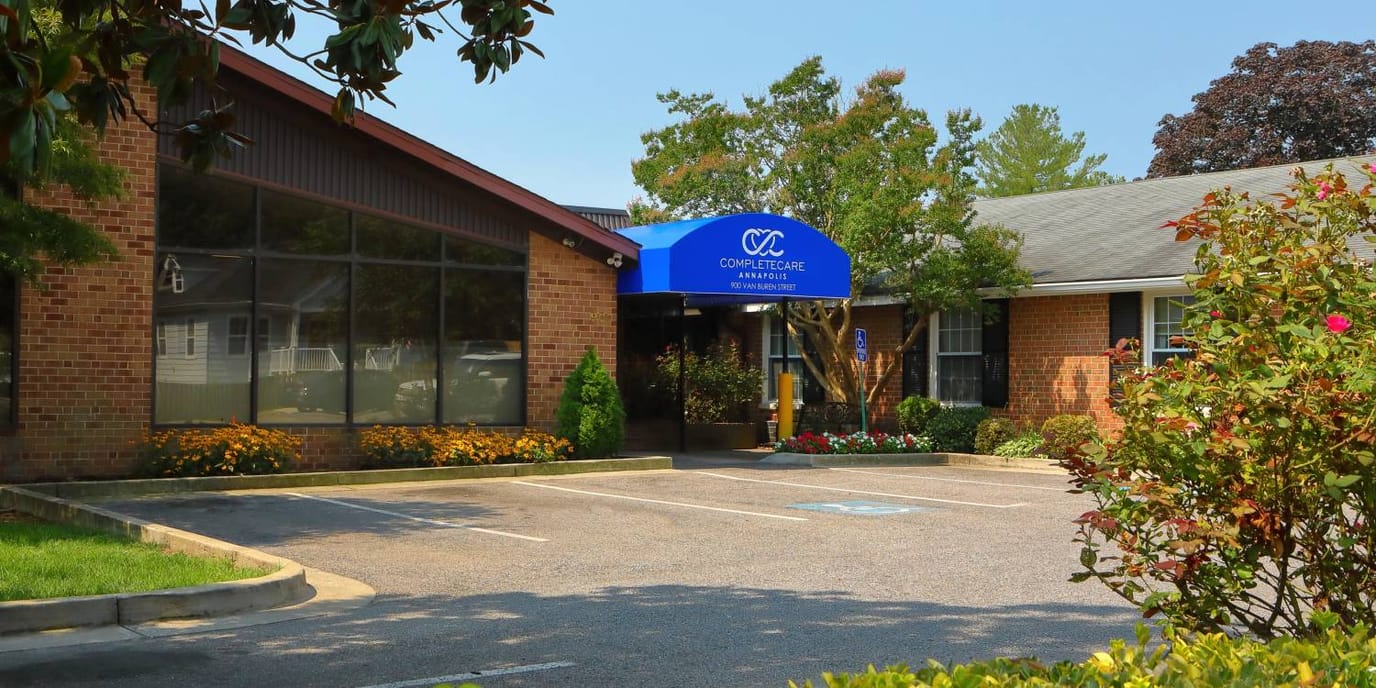
Complete Care at Annapolis is a nursing home in Annapolis, MD, offering skilled nursing, rehabilitation, and long-term care. The community focuses on older adults’ healing, providing clinical excellence, and thoughtfully designed amenities. Chef-inspired dining, concierge services, and live entertainment are among the lifestyle services provided. Wound care, hospice care, and respite care are also available, ensuring residents can stay even when their needs evolve.

Physical, occupational, and speech therapy are conducted based on residents’ abilities and tolerance to help with their recovery. Spacious accommodations and state-of-the-art rehabilitation equipment are also provided for residents’ relaxation and rehabilitation. The community also features an on-site dialysis program, in collaboration with Concerto Renal Services, so residents can receive treatment without the need to travel. This nursing home is a great choice for senior living in Maryland, especially with its wide range of care services.

(410) 267-8653

Quality ratings

Measured by Centers for Medicare & Medicaid Services (CMS)

Overall rating Info The Overall CMS Rating combines results from health inspections, staffing levels and quality measures. Health inspections carry the most weight. Staffing and quality scores can increase or decrease the final rating based on performance compared to state and national standards.
▲ 64.4% Above MD avg. ▲ 64.4% Above MD avg.MD average: 3.0Click the badge to see the full State ranking.Click here to see the full State ranking.
Health Inspection Info Based on the results of the facility's three most recent standard inspections and any complaint investigations. CMS reviews the number, scope, and severity of deficiencies, with more recent findings weighted more heavily.
▲ 42.0% Above MD avg. ▲ 42.0% Above MD avg.MD average: 2.8Click the badge to see the full State ranking.Click here to see the full State ranking.
Staffing Info Measures average nursing staff hours per resident per day, including Registered Nurses (RNs) and total nursing staff. Ratings are adjusted based on the level of care residents require and are compared to state and national benchmarks.
At MD avg. At MD avg.MD average: 3.0Click the badge to see the full State ranking.Click here to see the full State ranking.
Quality Measures Info Based on clinical and physical health indicators reported to CMS, such as hospital readmissions, falls, pressure ulcers, and improvements in mobility. These measures reflect how well residents' health needs are being managed.
▲ 35.3% Above MD avg. ▲ 35.3% Above MD avg.MD average: 3.7Click the badge to see the full State ranking.Click here to see the full State ranking.

Staffing hours breakdown

Info Daily nursing hours per resident by staff type, reported to CMS. Higher is generally better — compare this facility to state and national averages to see where staffing stands.

Hours per resident per day — compared to Maryland state averages

Total nursing care / resident Info Total adjusted nursing hours per resident per day, combining RN, LPN, and aide time. CMS adjusts this for case-mix so facilities can be fairly compared.
3h 16m per day
This facility Maryland avg (3h 46m per day)
vs Maryland avg
-14%

5 of 6 metrics below state avg

Standout metric LPN / LVN is +33% above state avg
Staff typeHours / Day / Residentvs state avg
Registered Nurse (RN) Info RNs hold the highest nursing license and can assess residents, interpret test results, and direct care plans. More RN hours per day often signals stronger clinical oversight and faster response to health changes. 43m per day ▼ 13% State avg: 49m per day · National avg: 41m per day
LPN / LVN Info Licensed Practical Nurses (LPNs) or Licensed Vocational Nurses (LVNs) deliver routine hands-on care — medication administration, wound dressing, and monitoring vital signs. They work under RN supervision and make up a large share of daily bedside care. 1h 12m per day ▲ 33% State avg: 55m per day · National avg: 52m per day
Nurse Aide Info Certified Nurse Aides (CNAs) provide the most direct day-to-day assistance: bathing, dressing, feeding, and mobility. Nurse aide hours are typically the largest staffing category and directly affect residents' quality of life. 1h 51m per day ▼ 14% State avg: 2h 8m per day · National avg: 2h 20m per day
Weekend Total Nursing Info Combined nursing hours (RN + LPN + Nurse Aide) per resident per day on weekends. Staffing often drops on weekends — this figure reveals whether the facility maintains adequate coverage outside of weekday hours. 3h 9m per day ▼ 10% State avg: 3h 31m per day · National avg: 3h 27m per day
Physical Therapist Info Hours per resident per day provided by licensed Physical Therapists (PTs) or PT Assistants. PT services help residents recover mobility after injury or illness and are especially important for post-acute (short-stay) rehabilitation. 5m per day ▼ 17% State avg: 6m per day · National avg: 4m per day
Weekend RN Info Registered nurse hours specifically on weekends. Facilities sometimes reduce RN presence on Saturdays and Sundays — a low weekend RN figure compared to weekday hours can indicate reduced clinical oversight when most administrative staff are absent. 27m per day ▼ 27% State avg: 37m per day · National avg: 29m per day

Capacity and availability

This home usually has availability

Lower occupancy than the Maryland average: 82.4%
Occupancy rate
79.4%
Avg. Length of Stay
106 days
Bed community size
97-bed community Rank #139 / 697Bed count — State benchmarkedThis home is ranked 139th out of 697 homes in Maryland. Shows this facility's certified or reported bed count compared to other Maryland facilities. Larger communities may offer more amenities, programs, and on-site services for residents and families.Rankings are based only on facilities in Maryland that report data for that category. Facilities without available data are excluded from the ranking.Click the rank badge to see the full State ranking.Click here to see the full State ranking.
A larger shared setting that may offer more common spaces and organized community services.
Walk Score
Walk Score: 62 / 100 Rank #286 / 985Walk Score — State benchmarkedThis home is ranked 286th out of 985 homes in Maryland. Shows how walkable this facility's neighborhood is compared to the average Walk Score across Maryland facilities. Higher scores benefit residents, families, and staff.Rankings are based only on facilities in Maryland that report data for that category. Facilities without available data are excluded from the ranking.Click the rank badge to see the full State ranking.Click here to see the full State ranking.
Moderately walkable. Some errands can be accomplished on foot, with a mix of nearby amenities.

About this community

Therapy & Rehabilitation

3 services
Rehabilitation Services
Respite Care
Short-Term Rehab

Staffing & Medical

1 service
24-Hour Staffing

Additional Services

1 service
Post-Acute Care

Amenities & Lifestyle

Specific ProgramsRehabilitation Program, Orthopedic & Post-Surgical Care, Cardiac Care, Neuro & Stroke Care, Pulmonary Care, Renal Care, Bariatric Care, Psychology/Psychiatric Care

Contact Complete Care at Annapolis

Staffing Data

Reporting period: October 1 – December 31, 2025 (Q4 2025). Source: CMS Payroll-Based Journal report.

Total staff 127
Employees 80
Contractors 47
Staff to resident ratio 1.98 : 1
9% more staff per resident than Maryland average
Maryland average ratio: 1.81 : 1 Maryland average ratio: 1.81 : 1See full Maryland ranking
Avg staff/day 40
Average shift 8.5 hours
6% better than Maryland average
Maryland average: 8 hours Maryland average shift: 8 hoursSee full Maryland ranking
Total staff hours (quarter) 31,255

Nursing staff breakdown

Q4 2025 · Oct 1 – Dec 31 More info This data comes from the CMS Payroll-Based Journal report covering October 1 – December 31, 2025.
Registered Nurse

Manages medical care and health needs.

RN Staff Info 17 total: 7 full-time employees and 10 contractors. 17
Average shift length Info Average shift length. Calculated as total hours divided by days worked and average staff per day. 8.9 hours
Licensed Practical Nurse

Assists with medical care and medications.

LPN Staff Info 25 total: 18 full-time employees and 7 contractors. 25
Average shift length Info Average shift length. Calculated as total hours divided by days worked and average staff per day. 9.1 hours
Certified Nursing Assistant

Helps with daily care and mobility.

CNA Staff Info 50 total: 30 full-time employees and 20 contractors. 50
Average shift length Info Average shift length. Calculated as total hours divided by days worked and average staff per day. 8.7 hours

Contractor staffing

Q4 2025 · Oct 1 – Dec 31 More info This data comes from the CMS Payroll-Based Journal report covering October 1 – December 31, 2025.

Total hours from contractors

12.8%

3,985 contractor hours this quarter

Certified Nursing Assistant: 20 Registered Nurse: 10 Licensed Practical Nurse: 7 Respiratory Therapy Technician: 4 Physical Therapy Assistant: 2 Qualified Social Worker: 2 Speech Language Pathologist: 1 Physical Therapy Aide: 1

Staff by category

Q4 2025 · Oct 1 – Dec 31 More info This data comes from the CMS Payroll-Based Journal report covering October 1 – December 31, 2025.
Certified Nursing Assistant30205012,71592100%8.7
Licensed Practical Nurse187256,61392100%9.1
Clinical Nurse Specialist7072,45192100%8.6
Registered Nurse710172,12892100%8.9
RN Director of Nursing5051,7258592%8.7
Other Dietary Services Staff3031,2698896%7.6
Physical Therapy Assistant0229626672%7.8
Respiratory Therapy Technician0445576975%7.8
Mental Health Service Worker1015046368%8
Administrator1014966267%8
Physical Therapy Aide0114806065%8
Speech Language Pathologist0113956065%6.6
Nurse Practitioner1013524448%8
Qualified Social Worker0222913841%7.7
Occupational Therapy Aide5052251112%7.7
Dietitian202931011%7.1
50 Certified Nursing Assistant
% of Days 100%
25 Licensed Practical Nurse
% of Days 100%
7 Clinical Nurse Specialist
% of Days 100%
17 Registered Nurse
% of Days 100%
5 RN Director of Nursing
% of Days 92%
3 Other Dietary Services Staff
% of Days 96%
2 Physical Therapy Assistant
% of Days 72%
4 Respiratory Therapy Technician
% of Days 75%
1 Mental Health Service Worker
% of Days 68%
1 Administrator
% of Days 67%
1 Physical Therapy Aide
% of Days 65%
1 Speech Language Pathologist
% of Days 65%
1 Nurse Practitioner
% of Days 48%
2 Qualified Social Worker
% of Days 41%
5 Occupational Therapy Aide
% of Days 12%
2 Dietitian
% of Days 11%

Penalties and fines

Federal penalties imposed by CMS for regulatory violations, including civil money penalties (fines) and denials of payment for new Medicare/Medicaid admissions.

Source: CMS Penalties Database

No penalties in the past 3 years

No civil money penalties or payment denials were reported in the last 3 years.

Quality of care over time

These measures show how residents usually do over time at this home, based on health outcomes and preventive care.

High-risk clinical events score Info A composite score based on pressure ulcers, falls with injury, weight loss, walking ability decline, and activities of daily living decline. 3.8
70% better than Maryland average

Maryland average: 12.9

Functional decline score Info A composite score based on activities of daily living decline, walking ability decline, and incontinence. 11.9
54% better than Maryland average

Maryland average: 25.7

Long-stay resident measures
Need for Help with Daily Activities Increased Info Percent of long-stay residents whose need for help with daily activities has increased 5.7%
76% better than Maryland average

Maryland average: 23.7%

Walking Ability Worsened Info Percent of long-stay residents whose ability to move independently worsened 4.7%
83% better than Maryland average

Maryland average: 27.7%

Low Risk Residents with Bowel/Bladder Incontinence Info Percent of low risk long-stay residents who lose control of their bowels or bladder 25.4%
In line with Maryland average

Maryland average: 25.9%

Falls with Major Injury Info Percent of long-stay residents experiencing one or more falls with major injury 0.0%
100% better than Maryland average

Maryland average: 2.3%

High Risk Residents with Pressure Ulcers Info Percent of long-stay high risk residents with pressure ulcers 6.5%
In line with Maryland average

Maryland average: 6.5%

Urinary Tract Infection Info Percent of long-stay residents with a urinary tract infection 0.4%
76% better than Maryland average

Maryland average: 1.6%

Lost Too Much Weight Info Percent of long-stay residents who lose too much weight 2.4%
59% better than Maryland average

Maryland average: 5.8%

Depressive Symptoms Info Percent of long-stay residents who have depressive symptoms 51.4%
155% worse than Maryland average

Maryland average: 20.2%

Antipsychotic Use Info Percent of long-stay residents who received an antipsychotic medication 3.9%
70% better than Maryland average

Maryland average: 12.9%

Pneumococcal Vaccine Info Percent of long-stay residents assessed and appropriately given the pneumococcal vaccine 98.5%
7% better than Maryland average

Maryland average: 92.0%

Influenza Vaccine Info Percent of long-stay residents assessed and appropriately given the seasonal influenza vaccine 100.0%
In line with Maryland average

Maryland average: 96.6%

Short-stay resident measures
Pneumococcal Vaccine Info Percent of short-stay residents assessed and appropriately given the pneumococcal vaccine 70.6%
10% worse than Maryland average

Maryland average: 78.4%

Antipsychotic medication increase Info Percent of short-stay residents who newly received an antipsychotic medication 0.0%
100% better than Maryland average

Maryland average: 1.4%

Influenza Vaccine Info Percent of short-stay residents assessed and appropriately given the seasonal influenza vaccine 86.7%
8% better than Maryland average

Maryland average: 80.6%

Breakdown by payment type

Medicare

39% of new residents, usually for short-term rehab.

Typical stay 30 days

Private pay

31% of new residents, often for short stays.

Typical stay 1 - 2 months

Medicaid

30% of new residents, often for long-term daily care.

Typical stay 8 - 9 months

Facility Characteristics

Source: CMS Long-Term Care Facility Characteristics (Data as of Jan 2026)

Total residents 64
Medicare
11
17.2% of residents
Medicaid
53
82.8% of residents
Programs & Services
Residents Group

Residents meet regularly to discuss policies, care quality, and activities

Active Resident Council

Organized group of residents that meets regularly to discuss facility policies, quality of life, and activities.

Finances and operations

Based on CMS SNF Cost Report for fiscal year ending in 12/2023.

Privately-owned community
Operated by a single business entity.
Net patient revenue Info Net patient revenue — what the home actually collects for resident care, after contractual allowances, bad debt and discounts are subtracted from its gross charges (CMS cost report, Worksheet G-3). It covers resident care only; money the home earns from other sources is shown separately as "Other income."
$12.0M
Net patient income Info Net patient income: net patient revenue minus the home's total operating expenses. A positive figure means it earns more from resident care than it spends to deliver it; a negative figure means the opposite. It excludes non-operating "other income."
-$1.3M
Privately-owned community Operated by a single business entity.
Net patient revenue Info Net patient revenue — what the home actually collects for resident care, after contractual allowances, bad debt and discounts are subtracted from its gross charges (CMS cost report, Worksheet G-3). It covers resident care only; money the home earns from other sources is shown separately as "Other income."
$12.0M
Net patient income Info Net patient income: net patient revenue minus the home's total operating expenses. A positive figure means it earns more from resident care than it spends to deliver it; a negative figure means the opposite. It excludes non-operating "other income."
-$1.3M
Other income Info Money the home earns outside of resident care — such as investments, grants, rentals and other non-operating sources (CMS cost report, Worksheet G-3). It is tracked separately from net patient revenue: it is not part of that figure, and it is not included in net patient income.
$123.4K
Payroll costs Info Staff salaries plus wage-related costs — benefits such as payroll taxes, health insurance and retirement — from the home's own accounting records (CMS cost report, Worksheet A). Contract or agency labor is counted separately, under other operating costs.
$4.8M 39.7% of net patient revenue Info Payroll as a share of revenue: staff salaries and wage-related benefits divided by net patient revenue. A higher figure means more of each revenue dollar goes to staff pay.
Other operating costs Info Everything it costs to run the home apart from payroll — food, utilities, supplies, maintenance, contract labor and administration. Calculated as total operating expense minus payroll (staff salaries and wage-related benefits).
$8.5M
Total costs Info The home's total operating expense for the year — all the costs of running it, salaries included (CMS cost report, Worksheet G-3).
$13.2M

Who this home usually serves

TYPE OF STAY

Mostly short-term rehab stays

Most residents typically stay for a few weeks or months before returning home or moving on.

New residents most often arrive under Medicare (39% of admissions), and a typical Medicare stay runs around 30 days.

Admissions
246 total

Coverage residents most often arrive under.

Medicare 39%
Private pay 31%
Medicaid 30%
Discharges
243 total

Coverage residents most often leave under.

Medicare 31%
Private pay 28%
Medicaid 40%

Managed by Michael Willis

Administrator

Compare Nursing Homes around Annapolis

The information below is reported by the Maryland Department of Health, Office of Health Care Quality.

5 facilities compared · CMS & MD Dept. of Health data

Complete Care at Annapolis
NH
HC
PC
RC
Annapolis
97
Facility 97
MD AVG 43
Rank #139 / 697
79.4% -4%3.26 -3%-14%$03210.7-75-
62
Facility 62
MD AVG 43
Rank #286 / 985
Pc Md5 Opco Holdco LLC$12.0M$4.8M39.7%215005
Ginger Cove
NH
AL
HC
IL
MC
Annapolis (River Crescent Drive)
96
Facility 96
MD AVG 43
Rank #140 / 697
66.1% -20%5.57 +25%+47%$0196.3-35A+
51
Facility 51
MD AVG 43
Rank #413 / 985
Phyllis Boulden$5.0M$13.3M265.4%215174
Autumn Lake Healthcare at Crofton
NH
RC
Crofton (Charing Cross)
180
Facility 180
MD AVG 43
Rank #19 / 697
88.0% +7%3.37 +35%-11%$0
27
Facility 27
MD AVG 49.9
Rank #28 / 149
6.8-160-
41
Facility 41
MD AVG 43
Rank #508 / 985
A&R Stern Family Cc Holdings LLC$27.2M$3.0M11.1%215120
Autumn Lake Healthcare at Spa Creek
NH
RC
Annapolis (Milkshake Lane)
130
Facility 130
MD AVG 43
Rank #66 / 697
88.3% +7%3.32 -41%-12%$0
65
Facility 65
MD AVG 49.9
Rank #118 / 149
13.01114-
48
Facility 48
MD AVG 43
Rank #448 / 985
35 Milkshake Holdco LLC$20.1M$1.5M7.2%215258
Autumn Lake Healthcare at Glen Burnie
NH
Glen Burnie (East Furnace Branch Road)
190
Facility 190
MD AVG 43
Rank #13 / 697
88.5% +7%3.15 -71%-17%$0
123
Facility 123
MD AVG 49.9
Rank #146 / 149
30.8-167-
50
Facility 50
MD AVG 43
Rank #419 / 985
7355 Furnace Branch Road East Opco LLC$25.1M$1.4M5.5%215266

Financial Assistance for
Nursing Home in Maryland

Complete Care at Annapolis is located in Annapolis, Maryland.
Here are the financial assistance programs available to residents in Maryland.

Get Financial aid guidance

Community Options Waiver

Maryland Medicaid Community Options Waiver

Age 65+ or disabled
General Maryland resident, Medicaid- eligible, nursing home-level care need.
Income Limits (2025) ~$2,829/month 300% FBR, individual
Asset Limits $2,000 (individual), $3,000 (couple) (excludes home, car).
MD

High urban demand; rural outreach efforts.

Benefits
Personal care (5-7 hours/day, e.g., bathing, dressing) Respite care (up to 240 hours/year) Adult day care ($70/day) Home modifications ($1,500 avg.)

Senior Care Program

Maryland Senior Care

Age 65+
General Maryland resident, at risk of nursing home placement.
Income Limits ~$2,000/month individual, varies by county
Asset Limits $11,000 individual
MD

Limited funding; waitlists common in high-demand areas.

Benefits
In-home care (3-5 hours/week) Respite care (up to 10 days/year) Meals (~$6/meal) Transportation (~5 trips/month) Case management

Maryland Nursing Home Medicaid

Maryland Medical Assistance (Medicaid) Nursing Home Program

Age 65+
General Maryland resident, Medicaid-eligible, requires nursing home-level care.
Income Limits (2025) $943/month (individual); most income applied to care costs.
Asset Limits $2,500 (individual), $3,000 (couple); spousal protections up to $155,356.
MD

Home equity limit $636,000; estate recovery applies post-55.

Benefits
24/7 nursing care Meals Therapy Medications (unlimited per medical need)

Senior Assisted Living Subsidy Program

Maryland Senior Assisted Living Group Home Subsidy

Age 62+
General Maryland resident, in or moving to approved assisted living, low/moderate income.
Income Limits (2025) ~$34,000/year individual, varies by county
Asset Limits Not strict; prioritizes low-income.
MD

Not available statewide; facility must be licensed by MDH.

Benefits
Personal care Meals 24-hour supervision (up to $1,500/month subsidy typical)

Veterans Aid and Attendance (A&A) Benefit

Maryland VA Aid and Attendance

Age
General Wartime veteran/spouse, age 65+ or disabled, needs ADL help, Maryland resident.
Income Limits (2025) Net income minus medical expenses < $1,984/month individual with A&A
Asset Limits $155,356 net worth limit
MD

High veteran population in suburban/rural areas.

Benefits
Cash benefit ($1,478-$2,471/month, varies by status) for care costs

Senior Prescription Drug Assistance Program (SPDAP)

Maryland Senior Prescription Drug Assistance Program

Age 65+
General Maryland resident (6+ months), Medicare Part D enrolled.
Income Limits (2025) $48,560/year individual, 300% FPL
Asset Limits None specified.
MD

Supplements Medicare Part D; annual enrollment required.

Benefits
Up to $40/month premium subsidy Reducing drug costs

Medicare Savings Programs (MSP)

Maryland Medicare Savings Programs

Age 65+
General Maryland resident, Medicare Part A/B enrollee.
Income Limits (2025) $2,014/month (QMB), $2,706/month (SLMB/QI, individual).
Asset Limits $9,090 (individual), $13,630 (couple).
MD

Includes QMB, SLMB, QI categories.

Benefits
Covers premiums (up to $174.70/month Part B) Co-pays Deductibles

Community Personal Assistance Services (CPAS)

Maryland Medicaid Community Personal Assistance Services

Age 65+
General Maryland resident, Medicaid-eligible, needs ADL assistance.
Income Limits (2025) $943/month (individual); spend-down available.
Asset Limits $2,500 (individual), $3,000 (couple).
MD

Consumer-directed option allows hiring family caregivers.

Benefits
Personal care (hours vary, typically 20-30/week) Chores Nurse supervision

Frequently Asked Questions about Complete Care at Annapolis

Is Complete Care at Annapolis in a walkable area?

Complete Care at Annapolis has a walk score of 62. Moderately walkable. Some errands can be accomplished on foot, with a mix of nearby amenities.

What is the occupancy rate at Complete Care at Annapolis?

Complete Care at Annapolis's occupancy is 79.4%.

Are there photos of Complete Care at Annapolis?

Yes — there is 1 photo of Complete Care at Annapolis in the photo gallery on this page.

What is the phone number of Complete Care at Annapolis?

(410) 267-8653 will put you in contact with the team at Complete Care at Annapolis.

Is Complete Care at Annapolis Medicare or Medicaid certified?

Yes — Complete Care at Annapolis is a CMS-certified provider of Medicare and Medicaid.

Guides for Better Senior Living

Care Cost Calculator: See Prices in Your Area

Nursing Home Data Explorer

Don’t Wait Too Long: 7 Red Flag Signs Your Parent Needs Assisted Living Now

The True Cost of Assisted Living in 2025 – And How Families Are Paying For It

Understanding Senior Living Costs: Pricing Models, Discounts & Financial Assistance