Autumn Lake Healthcare at Glen Burnie
CMS overall rating Info CMS (the Centers for Medicare & Medicaid Services) is the federal agency that rates nursing home quality. Its Overall Rating runs from 1 to 5 stars, combining health inspections, staffing, and quality measures, with inspections weighted most heavily.

Autumn Lake Healthcare at Glen Burnie

CMS overall rating Info CMS (the Centers for Medicare & Medicaid Services) is the federal agency that rates nursing home quality. Its Overall Rating runs from 1 to 5 stars, combining health inspections, staffing, and quality measures, with inspections weighted most heavily.
Calculator: See prices in your area
Autumn Lake Healthcare at Glen Burnie accepts Medicare, Medicaid, and private pay.

Overview of Autumn Lake Healthcare at Glen Burnie

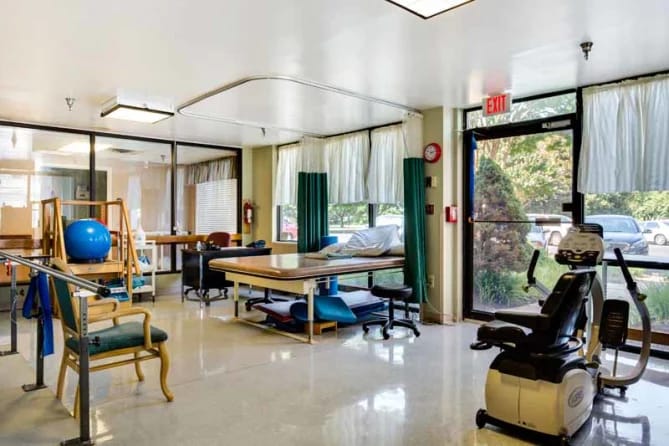
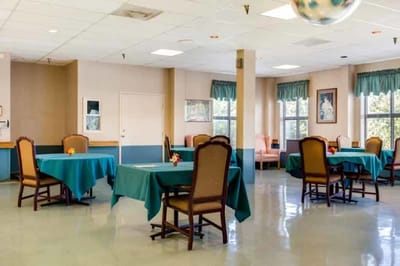
Located within vibrant green landscapes, Autumn Lake Healthcare at Glen Burnie is an assisted living community that offers top-tier nursing and rehabilitative services. This idyllic setting, steeped in historical allure and lakeside serenity, beckons residents seeking solace and vitality, all under the attentive care of a compassionate team.
Beyond its renowned rehabilitation, the facility stands out for its unwavering commitment to long-term care, delivering continuous, expert nursing support for an array of medical needs. Autumn Lake offers advanced care programs for complex medical conditions, with a dedicated staff ready to assist senior residents every step of the way.

Autumn Lake Healthcare at Glen Burnie is an independently owned and operated healthcare center that is licensed to use the Autumn Lake Healthcare name and receive non-healthcare related services. All healthcare-related services are provided solely by Autumn Lake Healthcare at Glen Burnie.

(410) 766-3460

Quality ratings

Measured by Centers for Medicare & Medicaid Services (CMS)

Overall rating Info The Overall CMS Rating combines results from health inspections, staffing levels and quality measures. Health inspections carry the most weight. Staffing and quality scores can increase or decrease the final rating based on performance compared to state and national standards.
▼ 34.2% Below MD avg. ▼ 34.2% Below MD avg.MD average: 3.0Click the badge to see the full State ranking.Click here to see the full State ranking.
Health Inspection Info Based on the results of the facility's three most recent standard inspections and any complaint investigations. CMS reviews the number, scope, and severity of deficiencies, with more recent findings weighted more heavily.
▼ 29.0% Below MD avg. ▼ 29.0% Below MD avg.MD average: 2.8Click the badge to see the full State ranking.Click here to see the full State ranking.
Staffing Info Measures average nursing staff hours per resident per day, including Registered Nurses (RNs) and total nursing staff. Ratings are adjusted based on the level of care residents require and are compared to state and national benchmarks.
At MD avg. At MD avg.MD average: 3.0Click the badge to see the full State ranking.Click here to see the full State ranking.
Quality Measures Info Based on clinical and physical health indicators reported to CMS, such as hospital readmissions, falls, pressure ulcers, and improvements in mobility. These measures reflect how well residents' health needs are being managed.
▼ 18.8% Below MD avg. ▼ 18.8% Below MD avg.MD average: 3.7Click the badge to see the full State ranking.Click here to see the full State ranking.

Staffing hours breakdown

Info Daily nursing hours per resident by staff type, reported to CMS. Higher is generally better — compare this facility to state and national averages to see where staffing stands.

Hours per resident per day — compared to Maryland state averages

Total nursing care / resident Info Total adjusted nursing hours per resident per day, combining RN, LPN, and aide time. CMS adjusts this for case-mix so facilities can be fairly compared.
3h 9m per day
This facility Maryland avg (3h 46m per day)
vs Maryland avg
-17%

5 of 6 metrics below state avg

Standout metric LPN / LVN is +8% above state avg
Staff typeHours / Day / Residentvs state avg
Registered Nurse (RN) Info RNs hold the highest nursing license and can assess residents, interpret test results, and direct care plans. More RN hours per day often signals stronger clinical oversight and faster response to health changes. 41m per day ▼ 17% State avg: 49m per day · National avg: 41m per day
LPN / LVN Info Licensed Practical Nurses (LPNs) or Licensed Vocational Nurses (LVNs) deliver routine hands-on care — medication administration, wound dressing, and monitoring vital signs. They work under RN supervision and make up a large share of daily bedside care. 59m per day ▲ 8% State avg: 55m per day · National avg: 52m per day
Nurse Aide Info Certified Nurse Aides (CNAs) provide the most direct day-to-day assistance: bathing, dressing, feeding, and mobility. Nurse aide hours are typically the largest staffing category and directly affect residents' quality of life. 1h 53m per day ▼ 12% State avg: 2h 8m per day · National avg: 2h 20m per day
Weekend Total Nursing Info Combined nursing hours (RN + LPN + Nurse Aide) per resident per day on weekends. Staffing often drops on weekends — this figure reveals whether the facility maintains adequate coverage outside of weekday hours. 3h 11m per day ▼ 9% State avg: 3h 31m per day · National avg: 3h 27m per day
Physical Therapist Info Hours per resident per day provided by licensed Physical Therapists (PTs) or PT Assistants. PT services help residents recover mobility after injury or illness and are especially important for post-acute (short-stay) rehabilitation. 6m per day ▼ 5% State avg: 6m per day · National avg: 4m per day
Weekend RN Info Registered nurse hours specifically on weekends. Facilities sometimes reduce RN presence on Saturdays and Sundays — a low weekend RN figure compared to weekday hours can indicate reduced clinical oversight when most administrative staff are absent. 35m per day ▼ 5% State avg: 37m per day · National avg: 29m per day

Capacity and availability

This home usually has limited availability

Higher occupancy than the Maryland average: 82.4%
Occupancy rate
88.5%
Avg. Length of Stay
88 days
Bed community size
190-bed community Rank #13 / 697Bed count — State benchmarkedThis home is ranked 13th out of 697 homes in Maryland. Shows this facility's certified or reported bed count compared to other Maryland facilities. Larger communities may offer more amenities, programs, and on-site services for residents and families.Rankings are based only on facilities in Maryland that report data for that category. Facilities without available data are excluded from the ranking.Click the rank badge to see the full State ranking.Click here to see the full State ranking.
A large-scale community that may provide a wide range of amenities, services, and structured programs.
Walk Score
Walk Score: 50 / 100 Rank #419 / 985Walk Score — State benchmarkedThis home is ranked 419th out of 985 homes in Maryland. Shows how walkable this facility's neighborhood is compared to the average Walk Score across Maryland facilities. Higher scores benefit residents, families, and staff.Rankings are based only on facilities in Maryland that report data for that category. Facilities without available data are excluded from the ranking.Click the rank badge to see the full State ranking.Click here to see the full State ranking.
Moderately walkable. Some errands can be accomplished on foot, with a mix of nearby amenities.

Payment & Insurance

2 services
Accept Medicaid
Accept Medicare

Therapy & Rehabilitation

2 services
Rehabilitation Services
Short-Term Rehab

Amenities & Lifestyle

Specific ProgramsLong-Term Living, Post-Operative Care, Nutrition and Hydration Management, Cardiac Care, Respiratory Care, Total Joint Replacement, Amputation, Post Fracture Care, Open Heart Surgery, Reconditioning / Strengthening, Assistance with Activities of Daily Living, Activities/Events/Social Engagement, Lab and X-Ray Services, Diabetes Management, Pain Management, Digestive Disorder Management, Discharge Planning, Home Health Services upon Discharge, Renal Disease Management, Specialized Meal Planning, Stroke Recovery, Prosthetics and Orthotics, Treatment of Swallowing Disorders, Urinary Incontinence Management, Advanced Therapy Modalities, Dental Care, Dialysis, Podiatry Services

Contact Autumn Lake Healthcare at Glen Burnie

Staffing Data

Reporting period: October 1 – December 31, 2025 (Q4 2025). Source: CMS Payroll-Based Journal report.

Total staff 396
Employees 136
Contractors 260
Staff to resident ratio 2.33 : 1
28% more staff per resident than Maryland average
Maryland average ratio: 1.81 : 1 Maryland average ratio: 1.81 : 1See full Maryland ranking
Avg staff/day 81
Average shift 8.6 hours
8% better than Maryland average
Maryland average: 8 hours Maryland average shift: 8 hoursSee full Maryland ranking
Total staff hours (quarter) 64,195

Nursing staff breakdown

Q4 2025 · Oct 1 – Dec 31 More info This data comes from the CMS Payroll-Based Journal report covering October 1 – December 31, 2025.
Registered Nurse

Manages medical care and health needs.

RN Staff Info All 16 RN Staff are full-time employees. No contractors work on this role. 16
Average shift length Info Average shift length. Calculated as total hours divided by days worked and average staff per day. 9.9 hours
Licensed Practical Nurse

Assists with medical care and medications.

LPN Staff Info 112 total: 25 full-time employees and 87 contractors. 112
Average shift length Info Average shift length. Calculated as total hours divided by days worked and average staff per day. 9.5 hours
Certified Nursing Assistant

Helps with daily care and mobility.

CNA Staff Info 210 total: 56 full-time employees and 154 contractors. 210
Average shift length Info Average shift length. Calculated as total hours divided by days worked and average staff per day. 8.6 hours

Contractor staffing

Q4 2025 · Oct 1 – Dec 31 More info This data comes from the CMS Payroll-Based Journal report covering October 1 – December 31, 2025.

Total hours from contractors

23.8%

15,306 contractor hours this quarter

Certified Nursing Assistant: 154 Licensed Practical Nurse: 87 Physical Therapy Aide: 5 Respiratory Therapy Technician: 4 Speech Language Pathologist: 4 Physical Therapy Assistant: 3 Qualified Social Worker: 3

Staff by category

Q4 2025 · Oct 1 – Dec 31 More info This data comes from the CMS Payroll-Based Journal report covering October 1 – December 31, 2025.
Certified Nursing Assistant5615421027,67292100%8.6
Licensed Practical Nurse258711212,83892100%9.5
Registered Nurse160168,53892100%9.9
Other Dietary Services Staff9092,43892100%7.4
RN Director of Nursing100102,2046470%7.8
Physical Therapy Aide0551,5367076%8
Clinical Nurse Specialist6061,4776672%7.7
Respiratory Therapy Technician0441,4206975%7.9
Mental Health Service Worker5051,3486571%7.9
Nurse Aide in Training3031,14892100%7.2
Speech Language Pathologist0441,0256975%7.8
Physical Therapy Assistant0338136874%6.7
Nurse Practitioner2025046368%8
Qualified Social Worker0334805964%7.8
Administrator1014656166%7.6
Medication Aide/Technician1011732022%8.7
Dietitian2021161516%7.8
210 Certified Nursing Assistant
% of Days 100%
112 Licensed Practical Nurse
% of Days 100%
16 Registered Nurse
% of Days 100%
9 Other Dietary Services Staff
% of Days 100%
10 RN Director of Nursing
% of Days 70%
5 Physical Therapy Aide
% of Days 76%
6 Clinical Nurse Specialist
% of Days 72%
4 Respiratory Therapy Technician
% of Days 75%
5 Mental Health Service Worker
% of Days 71%
3 Nurse Aide in Training
% of Days 100%
4 Speech Language Pathologist
% of Days 75%
3 Physical Therapy Assistant
% of Days 74%
2 Nurse Practitioner
% of Days 68%
3 Qualified Social Worker
% of Days 64%
1 Administrator
% of Days 66%
1 Medication Aide/Technician
% of Days 22%
2 Dietitian
% of Days 16%

Penalties and fines

Federal penalties imposed by CMS for regulatory violations, including civil money penalties (fines) and denials of payment for new Medicare/Medicaid admissions.

Source: CMS Penalties Database

No penalties in the past 3 years

No civil money penalties or payment denials were reported in the last 3 years.

Quality of care over time

These measures show how residents usually do over time at this home, based on health outcomes and preventive care.

High-risk clinical events score Info A composite score based on pressure ulcers, falls with injury, weight loss, walking ability decline, and activities of daily living decline. 16.2
25% worse than Maryland average

Maryland average: 12.9

Functional decline score Info A composite score based on activities of daily living decline, walking ability decline, and incontinence. 33.4
30% worse than Maryland average

Maryland average: 25.7

Long-stay resident measures
Need for Help with Daily Activities Increased Info Percent of long-stay residents whose need for help with daily activities has increased 35.3%
49% worse than Maryland average

Maryland average: 23.7%

Walking Ability Worsened Info Percent of long-stay residents whose ability to move independently worsened 35.2%
27% worse than Maryland average

Maryland average: 27.7%

Low Risk Residents with Bowel/Bladder Incontinence Info Percent of low risk long-stay residents who lose control of their bowels or bladder 29.9%
15% worse than Maryland average

Maryland average: 25.9%

Falls with Major Injury Info Percent of long-stay residents experiencing one or more falls with major injury 0.7%
68% better than Maryland average

Maryland average: 2.3%

High Risk Residents with Pressure Ulcers Info Percent of long-stay high risk residents with pressure ulcers 4.2%
35% better than Maryland average

Maryland average: 6.5%

Urinary Tract Infection Info Percent of long-stay residents with a urinary tract infection 0.7%
55% better than Maryland average

Maryland average: 1.6%

Lost Too Much Weight Info Percent of long-stay residents who lose too much weight 5.6%
In line with Maryland average

Maryland average: 5.8%

Depressive Symptoms Info Percent of long-stay residents who have depressive symptoms 39.3%
95% worse than Maryland average

Maryland average: 20.2%

Antipsychotic Use Info Percent of long-stay residents who received an antipsychotic medication 3.3%
74% better than Maryland average

Maryland average: 12.9%

Pneumococcal Vaccine Info Percent of long-stay residents assessed and appropriately given the pneumococcal vaccine 95.3%
In line with Maryland average

Maryland average: 92.0%

Influenza Vaccine Info Percent of long-stay residents assessed and appropriately given the seasonal influenza vaccine 97.4%
In line with Maryland average

Maryland average: 96.6%

Short-stay resident measures
Pneumococcal Vaccine Info Percent of short-stay residents assessed and appropriately given the pneumococcal vaccine 51.5%
34% worse than Maryland average

Maryland average: 78.4%

Antipsychotic medication increase Info Percent of short-stay residents who newly received an antipsychotic medication 2.2%
59% worse than Maryland average

Maryland average: 1.4%

Influenza Vaccine Info Percent of short-stay residents assessed and appropriately given the seasonal influenza vaccine 62.0%
23% worse than Maryland average

Maryland average: 80.6%

Breakdown by payment type

Medicare

39% of new residents, usually for short-term rehab.

Typical stay 30 days

Private pay

41% of new residents, often for short stays.

Typical stay 28 days

Medicaid

20% of new residents, often for long-term daily care.

Typical stay 10 - 11 months

Facility Characteristics

Source: CMS Long-Term Care Facility Characteristics (Data as of Jan 2026)

Total residents 170
Medicare
21
12.4% of residents
Medicaid
113
66.5% of residents
Private pay or other
36
21.2% of residents
Programs & Services
Residents Group

Residents meet regularly to discuss policies, care quality, and activities

Active Resident Council

Organized group of residents that meets regularly to discuss facility policies, quality of life, and activities.

Finances and operations

Based on CMS SNF Cost Report for fiscal year ending in 12/2023.

Privately-owned community
Operated by a single business entity.
Net patient revenue Info Net patient revenue — what the home actually collects for resident care, after contractual allowances, bad debt and discounts are subtracted from its gross charges (CMS cost report, Worksheet G-3). It covers resident care only; money the home earns from other sources is shown separately as "Other income."
$25.1M
Net patient income Info Net patient income: net patient revenue minus the home's total operating expenses. A positive figure means it earns more from resident care than it spends to deliver it; a negative figure means the opposite. It excludes non-operating "other income."
$1.9M
Privately-owned community Operated by a single business entity.
Net patient revenue Info Net patient revenue — what the home actually collects for resident care, after contractual allowances, bad debt and discounts are subtracted from its gross charges (CMS cost report, Worksheet G-3). It covers resident care only; money the home earns from other sources is shown separately as "Other income."
$25.1M
Net patient income Info Net patient income: net patient revenue minus the home's total operating expenses. A positive figure means it earns more from resident care than it spends to deliver it; a negative figure means the opposite. It excludes non-operating "other income."
$1.9M
Other income Info Money the home earns outside of resident care — such as investments, grants, rentals and other non-operating sources (CMS cost report, Worksheet G-3). It is tracked separately from net patient revenue: it is not part of that figure, and it is not included in net patient income.
$61.1K
Payroll costs Info Staff salaries plus wage-related costs — benefits such as payroll taxes, health insurance and retirement — from the home's own accounting records (CMS cost report, Worksheet A). Contract or agency labor is counted separately, under other operating costs.
$1.4M 5.5% of net patient revenue Info Payroll as a share of revenue: staff salaries and wage-related benefits divided by net patient revenue. A higher figure means more of each revenue dollar goes to staff pay.
Other operating costs Info Everything it costs to run the home apart from payroll — food, utilities, supplies, maintenance, contract labor and administration. Calculated as total operating expense minus payroll (staff salaries and wage-related benefits).
$21.9M
Total costs Info The home's total operating expense for the year — all the costs of running it, salaries included (CMS cost report, Worksheet G-3).
$23.2M

Who this home usually serves

TYPE OF STAY

Mix of rehab and long-term care

This home supports both short-term rehab and long-term care, with residents staying for a wide range of durations.

New residents most often arrive under private pay (41% of admissions), and a typical private pay stay runs around 28 days.

Admissions
712 total

Coverage residents most often arrive under.

Medicare 39%
Private pay 41%
Medicaid 20%
Discharges
696 total

Coverage residents most often leave under.

Medicare 30%
Private pay 42%
Medicaid 27%

Places of interest near Autumn Lake Healthcare at Glen Burnie

Address 1.1 miles from city center Info Estimated distance in miles from Glen Burnie's city center to Autumn Lake Healthcare at Glen Burnie's address, calculated via Google Maps. — 2.38 miles to nearest hospital (UM Baltimore Washington Medical Center)

Calculate Travel Distance to Autumn Lake Healthcare at Glen Burnie

Add your location

Address

Compare Nursing Homes around Annapolis

The information below is reported by the Maryland Department of Health, Office of Health Care Quality.

5 facilities compared · CMS & MD Dept. of Health data

Complete Care at Annapolis
NH
HC
PC
RC
Annapolis
97
Facility 97
MD AVG 43
Rank #139 / 697
79.4% -4%3.26 -3%-14%$03210.7-75-
62
Facility 62
MD AVG 43
Rank #286 / 985
Pc Md5 Opco Holdco LLC$12.0M$4.8M39.7%215005
Ginger Cove
NH
AL
HC
IL
MC
Annapolis (River Crescent Drive)
96
Facility 96
MD AVG 43
Rank #140 / 697
66.1% -20%5.57 +25%+47%$0196.3-35A+
51
Facility 51
MD AVG 43
Rank #413 / 985
Phyllis Boulden$5.0M$13.3M265.4%215174
Autumn Lake Healthcare at Crofton
NH
RC
Crofton (Charing Cross)
180
Facility 180
MD AVG 43
Rank #19 / 697
88.0% +7%3.37 +35%-11%$0
27
Facility 27
MD AVG 49.9
Rank #28 / 149
6.8-160-
41
Facility 41
MD AVG 43
Rank #508 / 985
A&R Stern Family Cc Holdings LLC$27.2M$3.0M11.1%215120
Autumn Lake Healthcare at Spa Creek
NH
RC
Annapolis (Milkshake Lane)
130
Facility 130
MD AVG 43
Rank #66 / 697
88.3% +7%3.32 -41%-12%$0
65
Facility 65
MD AVG 49.9
Rank #118 / 149
13.01114-
48
Facility 48
MD AVG 43
Rank #448 / 985
35 Milkshake Holdco LLC$20.1M$1.5M7.2%215258
Autumn Lake Healthcare at Glen Burnie
NH
Glen Burnie (East Furnace Branch Road)
190
Facility 190
MD AVG 43
Rank #13 / 697
88.5% +7%3.15 -71%-17%$0
123
Facility 123
MD AVG 49.9
Rank #146 / 149
30.8-167-
50
Facility 50
MD AVG 43
Rank #419 / 985
7355 Furnace Branch Road East Opco LLC$25.1M$1.4M5.5%215266

Financial Assistance for
Nursing Home in Maryland

Autumn Lake Healthcare at Glen Burnie is located in Glen Burnie, Maryland.
Here are the financial assistance programs available to residents in Maryland.

Get Financial aid guidance

Community Options Waiver

Maryland Medicaid Community Options Waiver

Age 65+ or disabled
General Maryland resident, Medicaid- eligible, nursing home-level care need.
Income Limits (2025) ~$2,829/month 300% FBR, individual
Asset Limits $2,000 (individual), $3,000 (couple) (excludes home, car).
MD

High urban demand; rural outreach efforts.

Benefits
Personal care (5-7 hours/day, e.g., bathing, dressing) Respite care (up to 240 hours/year) Adult day care ($70/day) Home modifications ($1,500 avg.)

Senior Care Program

Maryland Senior Care

Age 65+
General Maryland resident, at risk of nursing home placement.
Income Limits ~$2,000/month individual, varies by county
Asset Limits $11,000 individual
MD

Limited funding; waitlists common in high-demand areas.

Benefits
In-home care (3-5 hours/week) Respite care (up to 10 days/year) Meals (~$6/meal) Transportation (~5 trips/month) Case management

Maryland Nursing Home Medicaid

Maryland Medical Assistance (Medicaid) Nursing Home Program

Age 65+
General Maryland resident, Medicaid-eligible, requires nursing home-level care.
Income Limits (2025) $943/month (individual); most income applied to care costs.
Asset Limits $2,500 (individual), $3,000 (couple); spousal protections up to $155,356.
MD

Home equity limit $636,000; estate recovery applies post-55.

Benefits
24/7 nursing care Meals Therapy Medications (unlimited per medical need)

Senior Assisted Living Subsidy Program

Maryland Senior Assisted Living Group Home Subsidy

Age 62+
General Maryland resident, in or moving to approved assisted living, low/moderate income.
Income Limits (2025) ~$34,000/year individual, varies by county
Asset Limits Not strict; prioritizes low-income.
MD

Not available statewide; facility must be licensed by MDH.

Benefits
Personal care Meals 24-hour supervision (up to $1,500/month subsidy typical)

Veterans Aid and Attendance (A&A) Benefit

Maryland VA Aid and Attendance

Age
General Wartime veteran/spouse, age 65+ or disabled, needs ADL help, Maryland resident.
Income Limits (2025) Net income minus medical expenses < $1,984/month individual with A&A
Asset Limits $155,356 net worth limit
MD

High veteran population in suburban/rural areas.

Benefits
Cash benefit ($1,478-$2,471/month, varies by status) for care costs

Senior Prescription Drug Assistance Program (SPDAP)

Maryland Senior Prescription Drug Assistance Program

Age 65+
General Maryland resident (6+ months), Medicare Part D enrolled.
Income Limits (2025) $48,560/year individual, 300% FPL
Asset Limits None specified.
MD

Supplements Medicare Part D; annual enrollment required.

Benefits
Up to $40/month premium subsidy Reducing drug costs

Medicare Savings Programs (MSP)

Maryland Medicare Savings Programs

Age 65+
General Maryland resident, Medicare Part A/B enrollee.
Income Limits (2025) $2,014/month (QMB), $2,706/month (SLMB/QI, individual).
Asset Limits $9,090 (individual), $13,630 (couple).
MD

Includes QMB, SLMB, QI categories.

Benefits
Covers premiums (up to $174.70/month Part B) Co-pays Deductibles

Community Personal Assistance Services (CPAS)

Maryland Medicaid Community Personal Assistance Services

Age 65+
General Maryland resident, Medicaid-eligible, needs ADL assistance.
Income Limits (2025) $943/month (individual); spend-down available.
Asset Limits $2,500 (individual), $3,000 (couple).
MD

Consumer-directed option allows hiring family caregivers.

Benefits
Personal care (hours vary, typically 20-30/week) Chores Nurse supervision

Frequently Asked Questions about Autumn Lake Healthcare at Glen Burnie

What neighborhood is Autumn Lake Healthcare at Glen Burnie in?

Autumn Lake Healthcare at Glen Burnie is in the East Furnace Branch Road neighborhood of Glen Burnie.

Is Autumn Lake Healthcare at Glen Burnie in a walkable area?

Autumn Lake Healthcare at Glen Burnie has a walk score of 50. Moderately walkable. Some errands can be accomplished on foot, with a mix of nearby amenities.

What is the occupancy rate at Autumn Lake Healthcare at Glen Burnie?

Autumn Lake Healthcare at Glen Burnie's occupancy is 88.5%.

Are there photos of Autumn Lake Healthcare at Glen Burnie?

Yes — there are 2 photos of Autumn Lake Healthcare at Glen Burnie in the photo gallery on this page.

What is the address of Autumn Lake Healthcare at Glen Burnie?

Autumn Lake Healthcare at Glen Burnie is located at 7355 E Furnace Branch Road, Glen Burnie, MD 21060.

What is the phone number of Autumn Lake Healthcare at Glen Burnie?

(410) 766-3460 will put you in contact with the team at Autumn Lake Healthcare at Glen Burnie.

Is Autumn Lake Healthcare at Glen Burnie Medicare or Medicaid certified?

Yes — Autumn Lake Healthcare at Glen Burnie is a CMS-certified provider of Medicare and Medicaid.

Guides for Better Senior Living

Care Cost Calculator: See Prices in Your Area

Nursing Home Data Explorer

Don’t Wait Too Long: 7 Red Flag Signs Your Parent Needs Assisted Living Now

The True Cost of Assisted Living in 2025 – And How Families Are Paying For It

Understanding Senior Living Costs: Pricing Models, Discounts & Financial Assistance