Regency At Bluffs Park
Nursing Home · Ann Arbor, MI
CMS overall rating Info The Overall CMS Rating is scored from 1 to 5 stars and combines results from health inspections, staffing levels, and quality measures. Health inspections carry the most weight. Staffing and quality scores can increase or decrease the final rating based on performance compared to state and national standards.

Regency At Bluffs Park

Nursing Home · Ann Arbor, MI
CMS overall rating Info The Overall CMS Rating is scored from 1 to 5 stars and combines results from health inspections, staffing levels, and quality measures. Health inspections carry the most weight. Staffing and quality scores can increase or decrease the final rating based on performance compared to state and national standards.
Calculator: See prices in your area
Regency At Bluffs Park accepts Medicare and private pay.

Overview of Regency at Bluffs Park

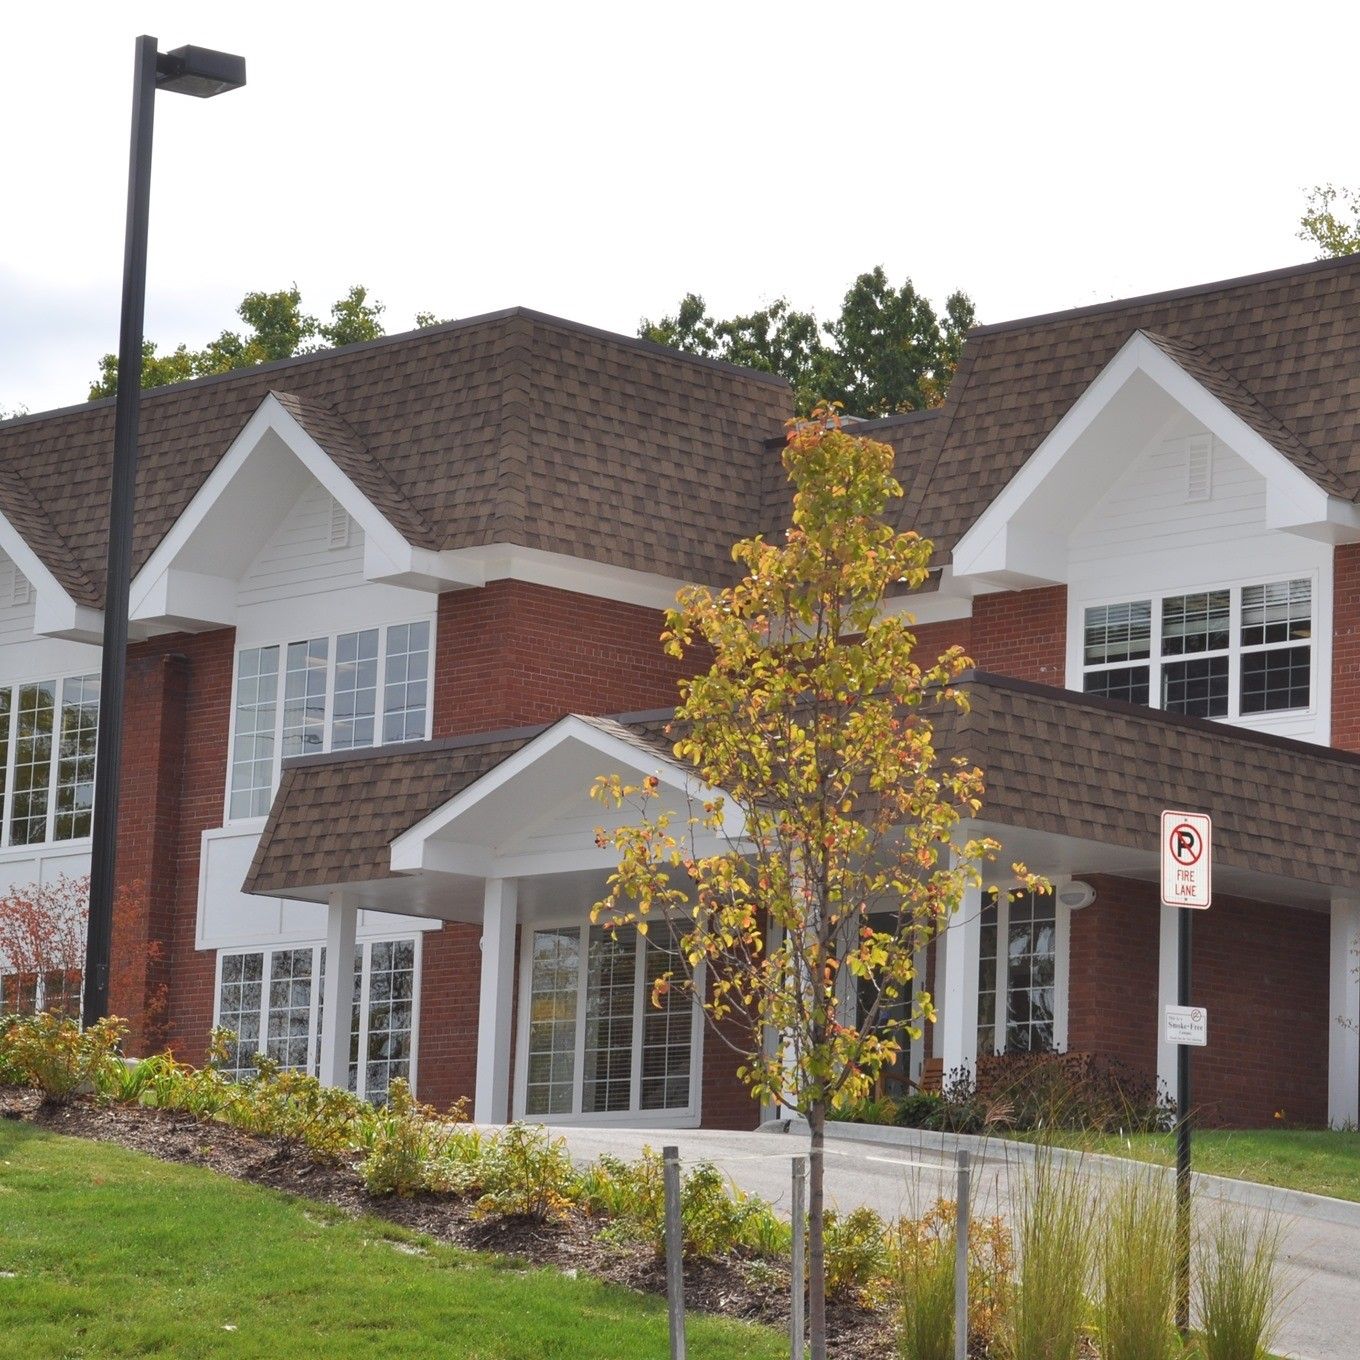
Regency at Bluffs Park is an assisted living community for seniors seeking both long-term care and short-term sub-acute rehabilitative services. Nestled within a state-of-the-art facility adorned with modern-living amenities in Ann Arbor, Michigan, Regency at Bluffs Park stands as a beacon of high-quality care and compassionate support.
Here, residents are enveloped in an environment where personalized care takes center stage, orchestrated by a team of highly qualified, dedicated, and empathetic professionals. Focused attention and innovative best practices are at the heart of our approach, ensuring that each individual’s unique needs are met with unwavering commitment. At Regency at Bluffs Park, the promise of superior care intertwines with the comforts of modern living, creating a space where well-being flourishes and lives are enriched.

(734) 887-8700

Quality ratings

Measured by Centers for Medicare & Medicaid Services (CMS)

Overall rating Info The Overall CMS Rating combines results from health inspections, staffing levels and quality measures. Health inspections carry the most weight. Staffing and quality scores can increase or decrease the final rating based on performance compared to state and national standards.
▼ 36.3% Below MI avg. ▼ 36.3% Below MI avg.Click the badge to see the full State ranking.Click here to see the full State ranking.
Health Inspection Info Based on the results of the facility's three most recent standard inspections and any complaint investigations. CMS reviews the number, scope, and severity of deficiencies, with more recent findings weighted more heavily.
▼ 29.3% Below MI avg. ▼ 29.3% Below MI avg.Click the badge to see the full State ranking.Click here to see the full State ranking.
Staffing Info Measures average nursing staff hours per resident per day, including Registered Nurses (RNs) and total nursing staff. Ratings are adjusted based on the level of care residents require and are compared to state and national benchmarks.
▲ 14.4% Above MI avg. ▲ 14.4% Above MI avg.Click the badge to see the full State ranking.Click here to see the full State ranking.
Quality Measures Info Based on clinical and physical health indicators reported to CMS, such as hospital readmissions, falls, pressure ulcers, and improvements in mobility. These measures reflect how well residents' health needs are being managed.
▲ 6.4% Above MI avg. ▲ 6.4% Above MI avg.Click the badge to see the full State ranking.Click here to see the full State ranking.

Staffing hours breakdown

Info Daily nursing hours per resident by staff type, reported to CMS. Higher is generally better — compare this facility to state and national averages to see where staffing stands.

Hours per resident per day — compared to Michigan state averages

Total nursing care / resident Info This home is ranked 36th out of 103 homes in Michigan.

Total adjusted nursing hours per resident per day, combining RN, LPN, and aide time. CMS adjusts this for case-mix so facilities can be fairly compared.
4h 10m per day
Rank #36 / 103Nurse hours — State benchmarkedThis home is ranked 36th out of 103 homes in Michigan.Shows adjusted nurse hours per resident per day benchmarked to the Michigan average, with a ranking across 103 Michigan SNFs. More hours mean more direct care. The national average is about 3.5 hrs; below 3.0 is a red flag.Click the rank badge to see the full State ranking.Click here to see the full State ranking.
This facility Michigan avg (4h 18m per day)
vs Michigan avg
-3%
Staff typeHours / Day / Residentvs state avg
Total Nursing (Weekend) Info Combined nursing hours (RN + LPN + Nurse Aide) per resident per day on weekends. Staffing often drops on weekends — this figure reveals whether the facility maintains adequate coverage outside of weekday hours. 3h 32m per day

Capacity and availability

This home usually has limited availability

Occupancy between 85% and 95% suggests balanced demand.

Higher occupancy than the Michigan average: 75.8%
Occupancy rate 87.5% Rank #24 / 105Occupancy rate — State benchmarkedThis home is ranked 24th out of 105 homes in Michigan.Shows this facility's occupancy rate versus the Michigan average, with its Statewide rank out of 105. Higher occupancy signals strong local demand and financial stability.Click the rank badge to see the full State ranking.Click here to see the full State ranking.
Avg. Length of Stay 35 days
Occupancy rate
87.5% Rank #24 / 105Occupancy rate — State benchmarkedThis home is ranked 24th out of 105 homes in Michigan.Shows this facility's occupancy rate versus the Michigan average, with its Statewide rank out of 105. Higher occupancy signals strong local demand and financial stability.Click the rank badge to see the full State ranking.Click here to see the full State ranking.
Avg. Length of Stay
35 days

Who this home usually serves

TYPE OF STAY

Primarily short stays

Residents typically stay for brief periods, with frequent admissions and discharges throughout the year.

Breakdown by payment type

Medicare

36% of new residents, usually for short-term rehab.

Typical stay 26 days

Private pay

64% of new residents, often for short stays.

Typical stay 1 - 2 months

Finances and operations

Privately-owned community
Operated by a business corporation.
Home revenue
$17.2M
Operating loss
-$85.4K
Privately-owned community Operated by a business corporation.
Home revenue
$17.2M Rank #51 / 104Revenue — State benchmarkedThis home is ranked 51st out of 104 homes in Michigan.Shows this facility's annual revenue compared to the Michigan SNF average. Higher revenue generally means more resources for staffing and capital — read alongside Payroll %.Click the rank badge to see the full State ranking.Click here to see the full State ranking.
Operating loss
-$85.4K
Payroll costs Info The portion of the home's budget spent on staff, including nurses, caregivers, and other employees who support care and operations. Rank #55 / 104Payroll — State benchmarkedThis home is ranked 55th out of 104 homes in Michigan.Shows total annual staff payroll benchmarked to the Michigan average. Higher payroll investment relative to peers often signals better staffing and less reliance on cheaper contract labor.Click the rank badge to see the full State ranking.Click here to see the full State ranking.
$6.9M
39.9% of revenue Rank #56 / 104Payroll % — State benchmarkedThis home is ranked 56th out of 104 homes in Michigan.Shows payroll as a percentage of revenue versus the Michigan average. Well-run Michigan SNFs typically land around 49–59% — the top third Statewide. Below 25% may signal understaffing or heavy agency use — read with Staffing ratings.Click the rank badge to see the full State ranking.Click here to see the full State ranking.
Other operating costs Info All remaining costs needed to run the home, such as food, utilities, building maintenance, supplies and administrative expenses.
$10.4M
Total costs $17.3M
Walk Score
Walk Score: 21 / 100 Rank #79 / 106Walk Score — State benchmarkedThis home is ranked 79th out of 106 homes in Michigan.Shows how walkable this facility's neighborhood is compared to the average Walk Score across Michigan SNFs. Higher scores benefit residents, families, and staff.Click the rank badge to see the full State ranking.Click here to see the full State ranking.
Car-dependent. Most errands require a car, with limited nearby walkable options.

Contact Regency At Bluffs Park

Health Inspection History

Inspections Since 2023
Total health inspections 5

Michigan average 6.5


Last Health inspection on Apr 2025

Total health citations
48 Rank #85 / 105Health citations — State benchmarkedThis home is ranked 85th out of 105 homes in Michigan.Shows this facility's total health deficiency citations benchmarked to the Michigan State average, with a ranking across all 105 MI SNFs. Lower citation counts earn a better rank.Click the rank badge to see the full State ranking.Click here to see the full State ranking.

Michigan average 33.5

Citations per inspection
9.6 Rank #100 / 105Citations per inspection — State benchmarkedThis home is ranked 100th out of 105 homes in Michigan.Shows average deficiency citations per CMS inspection for this facility versus the Michigan mean across 105 SNFs with citation data. Lower is better.Click the rank badge to see the full State ranking.Click here to see the full State ranking.

Michigan average 5.18


Health citations are formal notices following inspections when they fail to comply with safety and care standards.

37 of 48 citations resulted from standard inspections; 7 of 48 resulted from complaint investigations; and 4 of 48 came from combined inspections (standard and complaint).

Breakdown of citation severity (last 3 years)
Critical Health citations
0
100% better than Michigan average

Michigan average: 0.3


Serious Health citations
5 Rank #55 / 65Serious citations (G–I) — State benchmarkedThis home is ranked 55th out of 65 homes in Michigan.Shows G–I scope serious health citations for this facility versus other Michigan SNFs. Lower counts rank better.Click the rank badge to see the full State ranking.Click here to see the full State ranking.
163% worse than Michigan average

Michigan average: 1.9

0 critical citations Michigan average: 0.3

5 serious citations Michigan average: 1.9

42 moderate citations Michigan average: 30.8

1 minor citation Michigan average: 0.5
Citations history (last 3 years)
Abuse/Neglect moderate citation Apr 23, 2025
Corrected

Abuse/Neglect moderate citation Apr 23, 2025
Corrected

Abuse/Neglect moderate citation Apr 23, 2025
Corrected

Administration minor citation Apr 23, 2025
Corrected

Financial Assistance for
Nursing Home in Michigan

Regency At Bluffs Park is located in Ann Arbor, Michigan.
Here are the financial assistance programs available to residents in Michigan.

Get Financial aid guidance

MI Choice Waiver

Michigan Medicaid MI Choice Waiver

Age 65+ or disabled
General Michigan resident, Medicaid- eligible, nursing home-level care need.
Income Limits (2025) ~$2,829/month 300% FBR, individual
Asset Limits $2,000 (individual), $3,000 (couple).
MI

Delivered through regional waiver agents; waitlists possible.

Benefits
Personal care (5-7 hours/day) Respite care (240 hours/year) Home modifications ($1,500 avg.) Adult day care ($65/day)

Home Help Program

Michigan Home Help

Age 65+ or disabled
General Michigan resident, Medicaid- eligible or low-income.
Income Limits ~$1,732/month individual, Medicaid threshold
Asset Limits $2,000 individual
MI

Can hire family caregivers; less intensive than waiver.

Benefits
Personal care (up to 60 hours/month) Homemaker services Respite (varies)

Program of All-Inclusive Care for the Elderly (PACE)

Michigan PACE

Age 55+
General Michigan resident, nursing home-level care need, safe with PACE support.
Income Limits (2025) ~$2,829/month (Medicaid-eligible); private pay option available.
Asset Limits $2,000 (individual), $3,000 (couple).
MI

16 PACE centers (e.g., Ingham, Wayne counties); expanding slowly.

Benefits
Personal care (5-7 hours/day) Medical care Meals Transportation Therapy Respite

Medicare Savings Program (MSP)

Michigan Medicare Savings Program

Age 65+ or disabled
General Michigan resident, Medicare Part A/B.
Income Limits (2025) ~$2,510/month (QMB), ~$3,380/month (SLMB), ~$3,598/month (QI)—individual.
Asset Limits $9,430 (individual), $14,130 (couple).
MI

Three tiers; no waitlist; includes Extra Help for Part D.

Benefits
Covers Part B premiums ($174.70/month) Deductibles ($240/year) Copays (~20%)

National Family Caregiver Support Program (NFCSP) Respite

Michigan NFCSP Respite Care

Age
General Caregivers of 60+ needing care or 55+ caregivers of others; Michigan resident; functional needs (2+ ADLs).
Income Limits (2025) Prioritizes ~$24,980/year (individual); no strict cap.
Asset Limits Not assessed; need-based.
MI

16 AAAs; prioritizes low-income, rural caregivers.

Benefits
Respite (4-6 hours/week or 5 days/year) Adult day care ($60/day) Caregiver training

VA Aid and Attendance (A&A) and Housebound Benefits

Michigan VA Aid and Attendance/Housebound

Age 65+ or disabled veteran/spouse
General Michigan resident, wartime service, need for ADL help (A&A) or homebound.
Income Limits (2025) Net income < ~$1,984/month (veteran with dependent, A&A); pension offsets income.
Asset Limits ~$155,356 net worth limit
MI

High veteran demand in urban/rural areas.

Benefits
Cash (~$1,433-$2,642/month veteran, ~$951-$1,318 spouse) for care costs

Staffing Data

Reporting period: April 1 – June 30, 2025 (Q2 2025). Source: CMS Payroll-Based Journal report.

Total staff 144
Employees 106
Contractors 38
Staff to resident ratio 2.40:1
37% better than Michigan average
Michigan average ratio: 1.75:1 Michigan average ratio: 1.75:1See full Michigan ranking
Avg staff/day 44
Average shift 7.6 hours
0% compared with Michigan average
Michigan average: 7.9 hours Michigan average shift: 7.9 hoursSee full Michigan ranking
Total staff hours (quarter) 30,471

Nursing staff breakdown

Q2 2025 · Apr 1 – Jun 30 More info This data comes from the CMS Payroll-Based Journal report covering April 1 – June 30, 2025.
Registered Nurse

Manages medical care and health needs.

Total count 15
Average shift length Info Average shift length. Calculated as total hours divided by days worked and average staff per day. 9.1 hours

No contractors work on this role.

Licensed Practical Nurse

Assists with medical care and medications.

Total count 27
Average shift length Info Average shift length. Calculated as total hours divided by days worked and average staff per day. 9.5 hours

No contractors work on this role.

Certified Nursing Assistant

Helps with daily care and mobility.

Total count 42
Average shift length Info Average shift length. Calculated as total hours divided by days worked and average staff per day. 7.4 hours

No contractors work on this role.

Contractor staffing

Q2 2025 · Apr 1 – Jun 30 More info This data comes from the CMS Payroll-Based Journal report covering April 1 – June 30, 2025.

Total hours from contractors

12%

3,653 contractor hours this quarter

Respiratory Therapy Technician: 11 Physical Therapy Assistant: 7 Qualified Social Worker: 7 Speech Language Pathologist: 4 Physical Therapy Aide: 4 Medical Director: 2 Occupational Therapy Assistant: 2 Clinical Nurse Specialist: 1

Staff by category

Q2 2025 · Apr 1 – Jun 30 More info This data comes from the CMS Payroll-Based Journal report covering April 1 – June 30, 2025.
Certified Nursing Assistant4204210,80691100%7.4
Licensed Practical Nurse270277,19591100%9.5
Registered Nurse150152,88991100%9.1
Speech Language Pathologist0441,4718796%7
Physical Therapy Assistant0778968492%7.2
Dental Services Staff2028546976%7.7
Clinical Nurse Specialist4157756066%7.1
Nurse Aide in Training2026637279%6.7
RN Director of Nursing3036566571%7.1
Qualified Activities Professional3035406673%7.4
Administrator1015126470%8
Dietitian2025095560%7.8
Occupational Therapy Aide1015046369%8
Nurse Practitioner1014966268%8
Respiratory Therapy Technician011114877886%4.9
Other Dietary Services Staff3034626875%6.3
Qualified Social Worker0773874853%6.9
Physical Therapy Aide0442735459%5
Medical Director022576875%0.8
Occupational Therapy Assistant022415055%0.8
42 Certified Nursing Assistant
% of Days 100%
27 Licensed Practical Nurse
% of Days 100%
15 Registered Nurse
% of Days 100%
4 Speech Language Pathologist
% of Days 96%
7 Physical Therapy Assistant
% of Days 92%
2 Dental Services Staff
% of Days 76%
5 Clinical Nurse Specialist
% of Days 66%
2 Nurse Aide in Training
% of Days 79%
3 RN Director of Nursing
% of Days 71%
3 Qualified Activities Professional
% of Days 73%
1 Administrator
% of Days 70%
2 Dietitian
% of Days 60%
1 Occupational Therapy Aide
% of Days 69%
1 Nurse Practitioner
% of Days 68%
11 Respiratory Therapy Technician
% of Days 86%
3 Other Dietary Services Staff
% of Days 75%
7 Qualified Social Worker
% of Days 53%
4 Physical Therapy Aide
% of Days 59%
2 Medical Director
% of Days 75%
2 Occupational Therapy Assistant
% of Days 55%

Facility Characteristics

Source: CMS Long-Term Care Facility Characteristics (Data as of Jan 2026)

Total residents 60
Medicare
10
16.7% of residents
Medicaid
23
38.3% of residents
Private pay or other
27
45% of residents
Programs & Services
Residents Group

Residents meet regularly to discuss policies, care quality, and activities

Active Resident Council

Organized group of residents that meets regularly to discuss facility policies, quality of life, and activities.

Quality of care over time

These measures show how residents usually do over time at this home, based on health outcomes and preventive care.

High-risk clinical events score Info A composite score based on pressure ulcers, falls with injury, weight loss, walking ability decline, and activities of daily living decline. 12.0
42% worse than Michigan average

Michigan average: 8.4

Functional decline score Info A composite score based on activities of daily living decline, walking ability decline, and incontinence. 25.5
56% worse than Michigan average

Michigan average: 16.3

Long-stay resident measures
Need for Help with Daily Activities Increased Info Percent of long-stay residents whose need for help with daily activities has increased 18.7%
50% worse than Michigan average

Michigan average: 12.5%

Walking Ability Worsened Info Percent of long-stay residents whose ability to move independently worsened 25.1%
64% worse than Michigan average

Michigan average: 15.3%

Low Risk Residents with Bowel/Bladder Incontinence Info Percent of low risk long-stay residents who lose control of their bowels or bladder 32.7%
55% worse than Michigan average

Michigan average: 21.0%

Falls with Major Injury Info Percent of long-stay residents experiencing one or more falls with major injury 4.7%
48% worse than Michigan average

Michigan average: 3.2%

High Risk Residents with Pressure Ulcers Info Percent of long-stay high risk residents with pressure ulcers 5.7%
In line with Michigan average

Michigan average: 5.7%

Urinary Tract Infection Info Percent of long-stay residents with a urinary tract infection 2.4%
44% worse than Michigan average

Michigan average: 1.7%

Lost Too Much Weight Info Percent of long-stay residents who lose too much weight 5.7%
In line with Michigan average

Michigan average: 5.7%

Depressive Symptoms Info Percent of long-stay residents who have depressive symptoms 2.8%
29% better than Michigan average

Michigan average: 3.9%

Antipsychotic Use Info Percent of long-stay residents who received an antipsychotic medication 14.6%
In line with Michigan average

Michigan average: 15.0%

Pneumococcal Vaccine Info Percent of long-stay residents assessed and appropriately given the pneumococcal vaccine 100.0%
5% better than Michigan average

Michigan average: 94.9%

Influenza Vaccine Info Percent of long-stay residents assessed and appropriately given the seasonal influenza vaccine 100.0%
5% better than Michigan average

Michigan average: 95.0%

Short-stay resident measures
Pneumococcal Vaccine Info Percent of short-stay residents assessed and appropriately given the pneumococcal vaccine 99.6%
21% better than Michigan average

Michigan average: 82.5%

Antipsychotic medication increase Info Percent of short-stay residents who newly received an antipsychotic medication 0.9%
36% better than Michigan average

Michigan average: 1.4%

Influenza Vaccine Info Percent of short-stay residents assessed and appropriately given the seasonal influenza vaccine 90.9%
14% better than Michigan average

Michigan average: 79.5%

Penalties and fines

Federal penalties imposed by CMS for regulatory violations, including civil money penalties (fines) and denials of payment for new Medicare/Medicaid admissions.

Source: CMS Penalties Database (Data as of Jan 2026)

Total fines amount $27K Rank #75 / 106Federal fines — State benchmarkedThis home is ranked 75th out of 106 homes in Michigan.Shows this facility's cumulative CMS federal fine dollars versus the Michigan average among facilities with fines, and where it ranks among 106 skilled nursing facilities in the pool. Lower total dollars mean a better rank.Click the rank badge to see the full State ranking.Click here to see the full State ranking.
65% lower than Michigan average

Michigan average: $76K

Number of fines 1
51% fewer fines than Michigan average

Michigan average: 2.0

Payment Denials Info Serious action where Medicare and/or Medicaid temporarily stops payments for new residents until issues are fixed. 0
100% fewer payment denials than Michigan average

Michigan average: 0.8

Fines amount comparison
This facility $27K
Michigan average $76K
Penalty History

Penalties are imposed by CMS for violations of federal nursing home regulations.

1 penalty in the past 3 years

Nov 28, 2023 · $27K

Civil Money Penalty Info Fines imposed for noncompliance, which can be assessed per day or per instance of violation. Nov 28, 2023
$27K

Last updated: Jan 2026

Guides for Better Senior Living

Care Cost Calculator: See Prices in Your Area

Nursing Home Data Explorer

Don’t Wait Too Long: 7 Red Flag Signs Your Parent Needs Assisted Living Now

The True Cost of Assisted Living in 2025 – And How Families Are Paying For It

Understanding Senior Living Costs: Pricing Models, Discounts & Financial Assistance

Frequently Asked Questions about Regency At Bluffs Park

Is Regency At Bluffs Park in a walkable area?

Regency At Bluffs Park has a walk score of 21. Car-dependent. Most errands require a car, with limited nearby walkable options.

What is the occupancy rate at Regency At Bluffs Park?

Regency At Bluffs Park's occupancy is 87.5%.

What is the phone number of Regency At Bluffs Park?

(734) 887-8700 will put you in contact with the team at Regency At Bluffs Park.

Is Regency At Bluffs Park Medicare or Medicaid certified?

Yes — Regency At Bluffs Park is a CMS-certified provider of Medicare and Medicaid.

Explore Open Rooms
1 Contact details
2 What type of senior care service are you looking for?
3 What budget do you have in mind for senior care?
4 How soon do you need to find care?
5 Additional details

Thank you for your interest!

Our team will be in touch shortly to help with next steps.