Carol Woods
Nursing Home, Assisted Living, Independent Living & Nursing Care · Chapel Hill, NC
CMS overall rating Info CMS (the Centers for Medicare & Medicaid Services) is the federal agency that rates nursing home quality. Its Overall Rating runs from 1 to 5 stars, combining health inspections, staffing, and quality measures, with inspections weighted most heavily.

Carol Woods

Nursing Home, Assisted Living, Independent Living & Nursing Care · Chapel Hill, NC
CMS overall rating Info CMS (the Centers for Medicare & Medicaid Services) is the federal agency that rates nursing home quality. Its Overall Rating runs from 1 to 5 stars, combining health inspections, staffing, and quality measures, with inspections weighted most heavily.
Calculator: See prices in your area
Carol Woods accepts Medicare and private pay.

Overview of Carol Woods

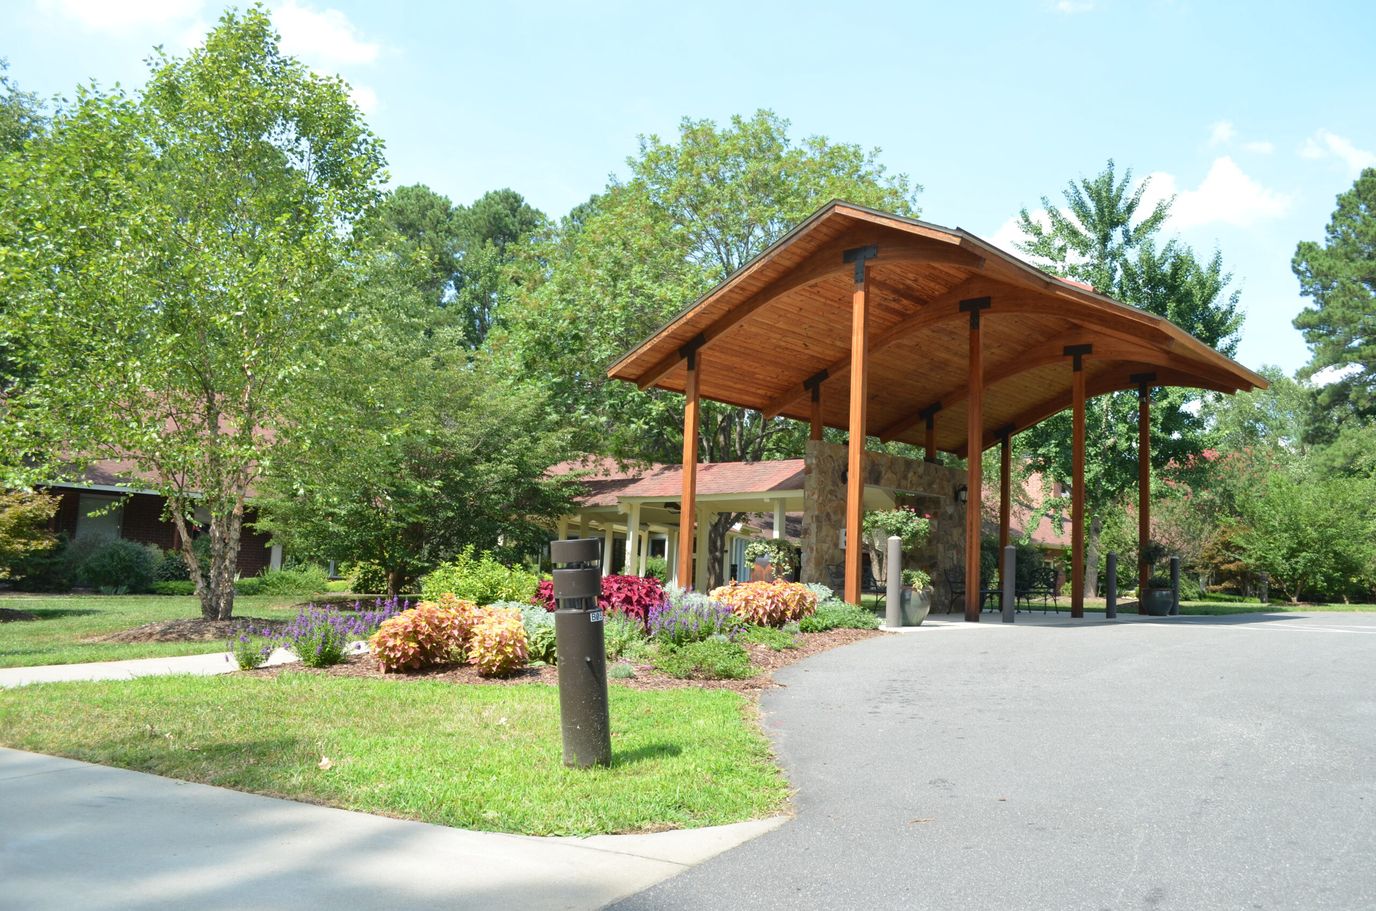
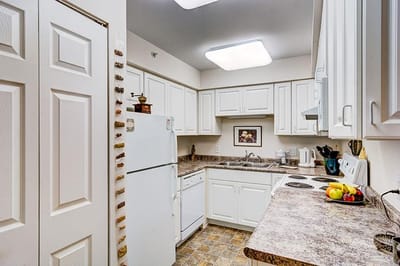
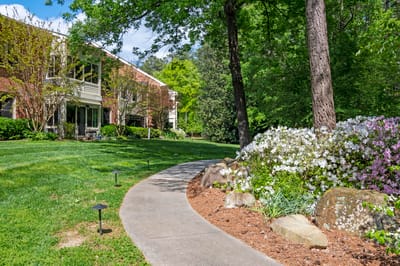
Redefining senior living, Carol Woods is a tight-knit senior living community in Chapel Hill, NC, offering a peaceful environment for a continuum of care. Residents here thrive with access to a multitude of services, including assisted living, short-term rehabilitation, and an array of clinical services. Sprawled within 120 acres of certified natural wildlife backyard habitat, the community guarantees a relaxing living environment, combined with stunning accommodations in variations of apartments, cottages, and townhomes.

An array of traditional and complementary therapies are offered on-site to make sure residents have access to the services they need to maintain their mobility and highest functionality. Residents are also encouraged to participate in the community’s dynamic range of activities and events and enjoy a multitude of amenities, such as a dog park, fitness center, arts studio, and more. A delectable dining experience is also provided to make sure residents’ are always energized and full.

Quality ratings

Measured by Centers for Medicare & Medicaid Services (CMS)

Overall rating Info The Overall CMS Rating combines results from health inspections, staffing levels and quality measures. Health inspections carry the most weight. Staffing and quality scores can increase or decrease the final rating based on performance compared to state and national standards.
▲ 78.8% Above NC avg. ▲ 78.8% Above NC avg.NC average: 2.8Click the badge to see the full State ranking.Click here to see the full State ranking.
Health Inspection Info Based on the results of the facility's three most recent standard inspections and any complaint investigations. CMS reviews the number, scope, and severity of deficiencies, with more recent findings weighted more heavily.
▲ 41.6% Above NC avg. ▲ 41.6% Above NC avg.NC average: 2.8Click the badge to see the full State ranking.Click here to see the full State ranking.
Staffing Info Measures average nursing staff hours per resident per day, including Registered Nurses (RNs) and total nursing staff. Ratings are adjusted based on the level of care residents require and are compared to state and national benchmarks.
▲ 88.0% Above NC avg. ▲ 88.0% Above NC avg.NC average: 2.7Click the badge to see the full State ranking.Click here to see the full State ranking.
Quality Measures Info Based on clinical and physical health indicators reported to CMS, such as hospital readmissions, falls, pressure ulcers, and improvements in mobility. These measures reflect how well residents' health needs are being managed.
▲ 57.5% Above NC avg. ▲ 57.5% Above NC avg.NC average: 3.2Click the badge to see the full State ranking.Click here to see the full State ranking.

Staffing hours breakdown

Info Daily nursing hours per resident by staff type, reported to CMS. Higher is generally better — compare this facility to state and national averages to see where staffing stands.

Hours per resident per day — compared to North Carolina state averages

Total nursing care / resident Info This home is ranked 11th out of 97 homes in North Carolina for nurse hours. Total adjusted nursing hours per resident per day, combining RN, LPN, and aide time. CMS adjusts this for case-mix so facilities can be fairly compared.
5h 56m per day
Rank #11 / 97Nurse hours — State benchmarkedThis home is ranked 11th out of 97 homes in North Carolina. Shows adjusted nurse hours per resident per day benchmarked to the North Carolina average, with a ranking across 97 North Carolina facilities. More hours mean more direct care. The national average is about 3.5 hrs; below 3.0 is a red flag.Rankings are based only on facilities in North Carolina that report data for that category. Facilities without available data are excluded from the ranking.Click the rank badge to see the full State ranking.Click here to see the full State ranking.
This facility North Carolina avg (3h 59m per day)
vs North Carolina avg
+49%

2 of 6 metrics below state avg

Standout metric Weekend RN is +397% above state avg
Staff typeHours / Day / Residentvs state avg
Registered Nurse (RN) Info RNs hold the highest nursing license and can assess residents, interpret test results, and direct care plans. More RN hours per day often signals stronger clinical oversight and faster response to health changes. 2h 15m per day ▲ 284% State avg: 35m per day · National avg: 41m per day
LPN / LVN Info Licensed Practical Nurses (LPNs) or Licensed Vocational Nurses (LVNs) deliver routine hands-on care — medication administration, wound dressing, and monitoring vital signs. They work under RN supervision and make up a large share of daily bedside care. 30m per day ▼ 43% State avg: 52m per day · National avg: 52m per day
Nurse Aide Info Certified Nurse Aides (CNAs) provide the most direct day-to-day assistance: bathing, dressing, feeding, and mobility. Nurse aide hours are typically the largest staffing category and directly affect residents' quality of life. 3h 28m per day ▲ 49% State avg: 2h 20m per day · National avg: 2h 20m per day
Weekend Total Nursing Info Combined nursing hours (RN + LPN + Nurse Aide) per resident per day on weekends. Staffing often drops on weekends — this figure reveals whether the facility maintains adequate coverage outside of weekday hours. 5h 39m per day ▲ 69% State avg: 3h 20m per day · National avg: 3h 26m per day
Physical Therapist Info Hours per resident per day provided by licensed Physical Therapists (PTs) or PT Assistants. PT services help residents recover mobility after injury or illness and are especially important for post-acute (short-stay) rehabilitation. 4m per day ▼ 18% State avg: 5m per day · National avg: 4m per day
Weekend RN Info Registered nurse hours specifically on weekends. Facilities sometimes reduce RN presence on Saturdays and Sundays — a low weekend RN figure compared to weekday hours can indicate reduced clinical oversight when most administrative staff are absent. 1h 54m per day ▲ 397% State avg: 23m per day · National avg: 28m per day

Capacity and availability

This home usually has availability

Higher occupancy than the North Carolina average: 76.4%
Occupancy rate
76.7% Rank #125 / 271Occupancy rate — State benchmarkedThis home is ranked 125th out of 271 homes in North Carolina. Shows this facility's occupancy rate versus the North Carolina average, with its Statewide rank out of 271. Higher occupancy signals strong local demand and financial stability.Rankings are based only on facilities in North Carolina that report data for that category. Facilities without available data are excluded from the ranking.Click the rank badge to see the full State ranking.Click here to see the full State ranking.
Avg. Length of Stay
31 days
Bed community size
30-bed community Rank #329 / 390Bed count — State benchmarkedThis home is ranked 329th out of 390 homes in North Carolina. Shows this facility's certified or reported bed count compared to other North Carolina facilities. Larger communities may offer more amenities, programs, and on-site services for residents and families.Rankings are based only on facilities in North Carolina that report data for that category. Facilities without available data are excluded from the ranking.Click the rank badge to see the full State ranking.Click here to see the full State ranking.
A moderately sized community that may balance personal attention with shared amenities and social activities.
Years in operation
47 years in operation
A longer operating history, which may indicate experience navigating regulations and delivering ongoing care.
Walk Score
Walk Score: 13 / 100 Rank #432 / 572Walk Score — State benchmarkedThis home is ranked 432nd out of 572 homes in North Carolina. Shows how walkable this facility's neighborhood is compared to the average Walk Score across North Carolina facilities. Higher scores benefit residents, families, and staff.Rankings are based only on facilities in North Carolina that report data for that category. Facilities without available data are excluded from the ranking.Click the rank badge to see the full State ranking.Click here to see the full State ranking.
Car-dependent. Most errands require a car, with limited nearby walkable options.

About this community

License Details

AccreditationsGreat Place to Work Certified, Orange County Living Wage, IDD Inclusive Employer Certified, Bird Friendly Habitat Certified, Commute Friendly NC Gold Certified, Medicare Certified, OSHA SHARP Recognition, Best Workplaces for Aging Services Certified, CARF Accreditation, Level II Arboretum Accreditation

Safety & Compliance

Wheelchair Accessible

Staffing

Key information about the people who lead and staff this community.

Leadership

ContactMs. Gretchen Likins, Director & Public Relations

Payment & Insurance

1 service
Accept Medicare

Therapy & Rehabilitation

2 services
Rehabilitation Services
Respite Care

Staffing & Medical

1 service
24-Hour Staffing

Additional Policies & Features

Pets Allowed
HousekeepingYes
Linen ServiceYes
Utilities IncludedYes

Amenities & Lifestyle

Dining
Fitness Programs
Wellness Programs
On-Site Salon
Transportation Services
24-Hour Security
Maintenance-Free Living
Gardening Opportunities
Specific ProgramsCognitive Care
Volunteer Program

Contact Carol Woods

Inspection History

In North Carolina, the Department of Health and Human Services, Division of Health Service Regulation conducts unannounced surveys to ensure nursing and adult care homes meet safety standards.

Since 2023 · 3 years of data 7 deficiencies 3 inspections 0 penalties

Inspection Scorecard Info This scorecard compares key inspection, deficiency, and complaint metrics at this facility against the North Carolina state average. Metrics rated ≥15% worse than average are highlighted in red; those ≥15% better are highlighted in green.

Since 2023 vs. North Carolina state average
Overall vs. NC average 1 Worse Metrics worse than North Carolina average:
• Deficiencies per inspection (5% above)
3 Better Metrics better than North Carolina average:
• Total deficiencies (85% below)
• Deficiencies per year (85% below)
• Total inspections (86% below)
Latest Inspection June 26, 2025 Annual Inspection

Deficiencies Info Deficiencies are formal regulatory issues recorded during state inspections.

This FacilityNC Averagevs. NC Avg
Total deficiencies Info Formal regulatory issues recorded by inspectors across all inspection types. 746 This facility has 85% fewer total deficiencies than a typical North Carolina nursing home (7 vs. NC avg 46).↓ 85% better
Deficiencies per year Info Average deficiencies per year since 2023. 2.315.3 This facility has 85% fewer deficiencies per year than a typical North Carolina nursing home (2.3 vs. NC avg 15.3).↓ 85% better
Deficiencies per inspection Info Average deficiencies per inspection. 2.32.2 This facility has 5% more deficiencies per inspection than a typical North Carolina nursing home (2.3 vs. NC avg 2.2).↑ 5% worse

Inspections Info State inspections evaluate whether the facility meets health and safety standards.

This FacilityNC Averagevs. NC Avg
Total inspections Info Combined count of all routine and focused inspections. Excludes complaint investigations. 321 This facility has 86% fewer total inspections than a typical North Carolina nursing home (3 vs. NC avg 21).↓ 86% better

Health Inspection History

Inspections since 2023
Total health inspections 2

North Carolina average 4


Last Health inspection on Jun 2024

Total health citations
7 Rank #27 / 101Health citations — State benchmarkedThis home is ranked 27th out of 101 homes in North Carolina. Shows this facility's total health deficiency citations benchmarked to the North Carolina State average, with a ranking across all 101 NC facilities. Lower citation counts earn a better rank.Rankings are based only on facilities in North Carolina that report data for that category. Facilities without available data are excluded from the ranking.Click the rank badge to see the full State ranking.Click here to see the full State ranking.

North Carolina average 20.9

Citations per inspection
3.5 Rank #41 / 101Citations per inspection — State benchmarkedThis home is ranked 41st out of 101 homes in North Carolina. Shows average deficiency citations per CMS inspection for this facility versus the North Carolina mean across 101 facilities with citation data. Lower is better.Rankings are based only on facilities in North Carolina that report data for that category. Facilities without available data are excluded from the ranking.Click the rank badge to see the full State ranking.Click here to see the full State ranking.

North Carolina average 4.99


Health citations are formal notices following inspections when they fail to comply with safety and care standards.

All 7 citations resulted from standard inspections.

Breakdown of citation severity (last 3 years)
Critical health citations
0
100% better than North Carolina average

North Carolina average: 1.3


Serious health citations
0
100% better than North Carolina average

North Carolina average: 0.9

0 critical citations North Carolina average: 1.3

0 serious citations North Carolina average: 0.9

5 moderate citations North Carolina average: 17.1

2 minor citations North Carolina average: 1.6
Citations history (last 3 years)
Administration moderate citation Jun 06, 2024
Corrected

Infection Control moderate citation Jun 06, 2024
Corrected

Nutrition moderate citation Jun 06, 2024
Corrected

Care Planning minor citation Jun 06, 2024
Corrected

Staffing Data

Reporting period: October 1 – December 31, 2025 (Q4 2025). Source: CMS Payroll-Based Journal report.

Total staff 142
Employees 142
Contractors 0
Staff to resident ratio 8.35 : 1
364% more staff per resident than North Carolina average
North Carolina average ratio: 1.80 : 1 North Carolina average ratio: 1.80 : 1See full North Carolina ranking
Avg staff/day 23
Average shift 6.5 hours
19% worse than North Carolina average
North Carolina average: 8 hours North Carolina average shift: 8 hoursSee full North Carolina ranking
Total staff hours (quarter) 13,798

Nursing staff breakdown

Q4 2025 · Oct 1 – Dec 31 More info This data comes from the CMS Payroll-Based Journal report covering October 1 – December 31, 2025.
Registered Nurse

Manages medical care and health needs.

RN Staff Info All 44 RN Staff are full-time employees. No contractors work on this role. 44
Average shift length Info Average shift length. Calculated as total hours divided by days worked and average staff per day. 7.8 hours
Licensed Practical Nurse

Assists with medical care and medications.

LPN Staff Info All 15 LPN Staff are full-time employees. No contractors work on this role. 15
Average shift length Info Average shift length. Calculated as total hours divided by days worked and average staff per day. 5.3 hours
Certified Nursing Assistant

Helps with daily care and mobility.

CNA Staff Info All 53 CNA Staff are full-time employees. No contractors work on this role. 53
Average shift length Info Average shift length. Calculated as total hours divided by days worked and average staff per day. 7.7 hours

Contractor staffing

Q4 2025 · Oct 1 – Dec 31 More info This data comes from the CMS Payroll-Based Journal report covering October 1 – December 31, 2025.
Total hours from contractors 0% — all staff are direct employees this quarter

Staff by category

Q4 2025 · Oct 1 – Dec 31 More info This data comes from the CMS Payroll-Based Journal report covering October 1 – December 31, 2025.
Certified Nursing Assistant530536,74192100%7.7
Registered Nurse440443,52292100%7.8
Licensed Practical Nurse150155577177%5.3
Clinical Nurse Specialist2025525964%5.3
RN Director of Nursing1014355459%8
Nurse Practitioner1014245358%8
Physical Therapy Assistant8083676975%2.8
Mental Health Service Worker1013645762%6.4
Medication Aide/Technician4042282628%8.4
Other Social Services Staff1012125155%4.2
Occupational Therapy Aide1011644145%4
Respiratory Therapy Technician4041385358%2.5
Feeding Assistant202283336%0.7
Other Physician303273134%0.9
Therapeutic Recreation Specialist101223639%0.6
Medical Director101171718%1
53 Certified Nursing Assistant
% of Days 100%
44 Registered Nurse
% of Days 100%
15 Licensed Practical Nurse
% of Days 77%
2 Clinical Nurse Specialist
% of Days 64%
1 RN Director of Nursing
% of Days 59%
1 Nurse Practitioner
% of Days 58%
8 Physical Therapy Assistant
% of Days 75%
1 Mental Health Service Worker
% of Days 62%
4 Medication Aide/Technician
% of Days 28%
1 Other Social Services Staff
% of Days 55%
1 Occupational Therapy Aide
% of Days 45%
4 Respiratory Therapy Technician
% of Days 58%
2 Feeding Assistant
% of Days 36%
3 Other Physician
% of Days 34%
1 Therapeutic Recreation Specialist
% of Days 39%
1 Medical Director
% of Days 18%

Penalties and fines

Federal penalties imposed by CMS for regulatory violations, including civil money penalties (fines) and denials of payment for new Medicare/Medicaid admissions.

Source: CMS Penalties Database

No penalties in the past 3 years

No civil money penalties or payment denials were reported in the last 3 years.

Quality of care over time

These measures show how residents usually do over time at this home, based on health outcomes and preventive care.

High-risk clinical events score Info A composite score based on pressure ulcers, falls with injury, weight loss, walking ability decline, and activities of daily living decline. 7.3
36% better than North Carolina average

North Carolina average: 11.5

Functional decline score Info A composite score based on activities of daily living decline, walking ability decline, and incontinence. 17.8
14% better than North Carolina average

North Carolina average: 20.6

Long-stay resident measures
Above average North Carolina avg: 2.9 Info CMS star rating based on long-stay quality measure performance. 5 stars = significantly above average, 1 star = significantly below average.
Need for Help with Daily Activities Increased Info Percent of long-stay residents whose need for help with daily activities has increased 18.8%
7% worse than North Carolina average

North Carolina average: 17.5%

Low Risk Residents with Bowel/Bladder Incontinence Info Percent of low risk long-stay residents who lose control of their bowels or bladder 16.9%
21% better than North Carolina average

North Carolina average: 21.4%

Falls with Major Injury Info Percent of long-stay residents experiencing one or more falls with major injury 0.0%
100% better than North Carolina average

North Carolina average: 3.6%

High Risk Residents with Pressure Ulcers Info Percent of long-stay high risk residents with pressure ulcers 0.0%
100% better than North Carolina average

North Carolina average: 6.3%

Urinary Tract Infection Info Percent of long-stay residents with a urinary tract infection 28.2%
974% worse than North Carolina average

North Carolina average: 2.6%

Lost Too Much Weight Info Percent of long-stay residents who lose too much weight 10.5%
43% worse than North Carolina average

North Carolina average: 7.4%

Depressive Symptoms Info Percent of long-stay residents who have depressive symptoms 2.6%
40% better than North Carolina average

North Carolina average: 4.4%

Antipsychotic Use Info Percent of long-stay residents who received an antipsychotic medication 4.9%
64% better than North Carolina average

North Carolina average: 13.4%

Pneumococcal Vaccine Info Percent of long-stay residents assessed and appropriately given the pneumococcal vaccine 95.1%
In line with North Carolina average

North Carolina average: 91.6%

Short-stay resident measures
Significantly above average North Carolina avg: 2.9 Info CMS star rating based on short-stay quality measure performance. 5 stars = much above average, 1 star = much below average.
Pneumococcal Vaccine Info Percent of short-stay residents assessed and appropriately given the pneumococcal vaccine 90.8%
14% better than North Carolina average

North Carolina average: 79.9%

Antipsychotic medication increase Info Percent of short-stay residents who newly received an antipsychotic medication 0.0%
100% better than North Carolina average

North Carolina average: 1.5%

Influenza Vaccine Info Percent of short-stay residents assessed and appropriately given the seasonal influenza vaccine 99.1%
27% better than North Carolina average

North Carolina average: 78.1%

Re-hospitalized after SNF stay Info Percentage of short-stay residents who were re-hospitalized after their nursing home admission. 9.7%
58% better than North Carolina average

North Carolina average: 22.9%

Emergency department visits Info Percentage of short-stay residents who had an outpatient emergency department visit. 0.0%
100% better than North Carolina average

North Carolina average: 13.2%

Falls with major injury Info Percentage of SNF residents who experience falls with major injury during their stay. 0.0%
100% better than North Carolina average

North Carolina average: 0.8%

Ability to care for self at discharge Info Percentage of residents at or above expected ability to care for themselves at discharge. 62.9%
17% better than North Carolina average

North Carolina average: 53.7%

Successful return to home or community Info Rate of successful return to home or community from a skilled nursing facility. 59.4%
17% better than North Carolina average

North Carolina average: 50.6%

Breakdown by payment type

Medicare

21% of new residents, usually for short-term rehab.

Typical stay 21 days

Private pay

79% of new residents, often for short stays.

Typical stay 6 - 7 months

Facility Characteristics

Source: CMS Long-Term Care Facility Characteristics (Data as of Jan 2026)

Total residents 17
Medicare
2
11.8% of residents
Private pay or other
15
88.2% of residents
Programs & Services
Residents Group

Residents meet regularly to discuss policies, care quality, and activities

Family Member Group

Family members meet regularly to discuss policies, care quality, and activities

CCRC

Part of a Continuing Care Retirement Community offering multiple care levels

Active Family Council

Organized group of family members that meets regularly to discuss facility policies, resident care, and activities.

Active Resident Council

Organized group of residents that meets regularly to discuss facility policies, quality of life, and activities.

Finances and operations

Based on CMS SNF Cost Report for fiscal year ending in 12/2023.

Nonprofit
Nonprofit Corporation
Net patient revenue Info Net patient revenue — what the home actually collects for resident care, after contractual allowances, bad debt and discounts are subtracted from its gross charges (CMS cost report, Worksheet G-3). It covers resident care only; money the home earns from other sources is shown separately as "Other income."
$29.1M
Net patient income Info Net patient income: net patient revenue minus the home's total operating expenses. A positive figure means it earns more from resident care than it spends to deliver it; a negative figure means the opposite. It excludes non-operating "other income."
-$5.2M
Nonprofit Nonprofit Corporation
Net patient revenue Info Net patient revenue — what the home actually collects for resident care, after contractual allowances, bad debt and discounts are subtracted from its gross charges (CMS cost report, Worksheet G-3). It covers resident care only; money the home earns from other sources is shown separately as "Other income."
$29.1M Rank #8 / 104Revenue — State benchmarkedThis home is ranked 8th out of 104 homes in North Carolina. Shows this facility's annual revenue compared to the North Carolina average. Higher revenue generally means more resources for staffing and capital — read alongside Payroll %.Rankings are based only on facilities in North Carolina that report data for that category. Facilities without available data are excluded from the ranking.Click the rank badge to see the full State ranking.Click here to see the full State ranking.
Net patient income Info Net patient income: net patient revenue minus the home's total operating expenses. A positive figure means it earns more from resident care than it spends to deliver it; a negative figure means the opposite. It excludes non-operating "other income."
-$5.2M
Other income Info Money the home earns outside of resident care — such as investments, grants, rentals and other non-operating sources (CMS cost report, Worksheet G-3). It is tracked separately from net patient revenue: it is not part of that figure, and it is not included in net patient income.
$10.4M
Payroll costs Info Staff salaries plus wage-related costs — benefits such as payroll taxes, health insurance and retirement — from the home's own accounting records (CMS cost report, Worksheet A). Contract or agency labor is counted separately, under other operating costs. Rank #8 / 104Payroll — State benchmarkedThis home is ranked 8th out of 104 homes in North Carolina. Shows total annual staff payroll benchmarked to the North Carolina average. Higher payroll investment relative to peers often signals better staffing and less reliance on cheaper contract labor.Rankings are based only on facilities in North Carolina that report data for that category. Facilities without available data are excluded from the ranking.Click the rank badge to see the full State ranking.Click here to see the full State ranking.
$18.0M 61.7% of net patient revenue Info Payroll as a share of revenue: staff salaries and wage-related benefits divided by net patient revenue. A higher figure means more of each revenue dollar goes to staff pay. Rank #83 / 104Payroll % — State benchmarkedThis home is ranked 83rd out of 104 homes in North Carolina. Shows payroll as a percentage of revenue versus the North Carolina average. Well-run North Carolina facilities typically land around 49–62% — the top third Statewide. Below 25% may signal understaffing or heavy agency use — read with Staffing ratings.Rankings are based only on facilities in North Carolina that report data for that category. Facilities without available data are excluded from the ranking.Click the rank badge to see the full State ranking.Click here to see the full State ranking.
Other operating costs Info Everything it costs to run the home apart from payroll — food, utilities, supplies, maintenance, contract labor and administration. Calculated as total operating expense minus payroll (staff salaries and wage-related benefits).
$16.3M
Total costs Info The home's total operating expense for the year — all the costs of running it, salaries included (CMS cost report, Worksheet G-3).
$34.3M

What does this home offer?

Housing options icon

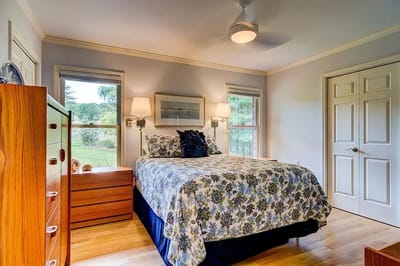
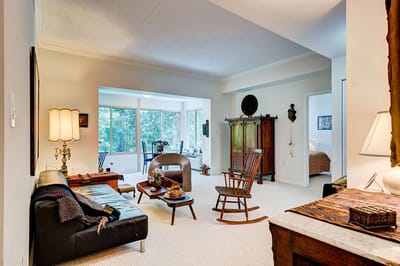
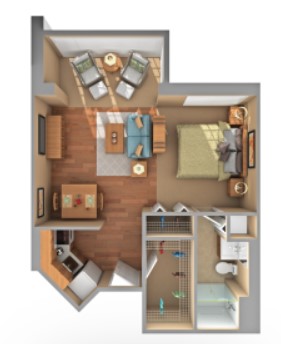
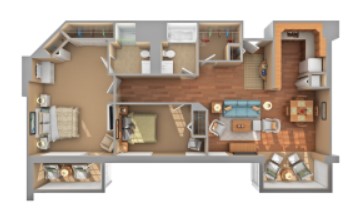
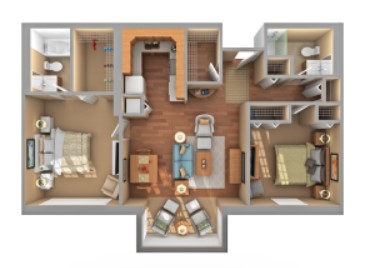
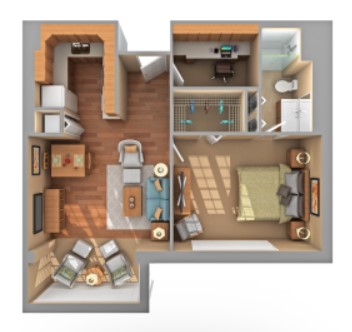
Housing Options: Studio / 1 Bed / 2 Bed

Building type icon
Building type icon

Building Type: Two-story

Fitness and recreation icon

Fitness and Recreation

Who this home usually serves

TYPE OF STAY

Primarily short stays

Residents typically stay for brief periods, with frequent admissions and discharges throughout the year.

Most new residents arrive under private pay (79% of admissions), and a typical private pay stay runs around 6 - 7 months.

Admissions
211 total

Coverage residents most often arrive under.

Medicare 21%
Private pay 79%
Discharges
304 total

Coverage residents most often leave under.

Medicare 13%
Private pay 87%

Living Spaces & Floor Plans for Carol Woods

Places of interest near Carol Woods

Address 4.6 miles from city center Info Estimated distance in miles from Chapel Hill's city center to Carol Woods's address, calculated via Google Maps. — 4.37 miles to nearest hospital (UNC Hospitals)

Calculate Travel Distance to Carol Woods

Add your location

Address

Compare Nursing Homes around Chapel Hill

The information below is reported by the North Carolina Department of Health and Human Services, Division of Health Service Regulation.

2 facilities compared · CMS & NC Dept. of Health data

Carol Woods
NH
AL
IL
NC
Chapel Hill (Carol Woods)
30
Facility 30
NC AVG 72
Rank #329 / 390
76.7%
Facility 76.7%
NC AVG 76.4%
Rank #125 / 271
0%
5.94
Facility 5.94
NC AVG 3.98
Rank #11 / 97
+239%+49%
$0
Facility $0
NC AVG $74.6k
Rank #1 / 105
7
Facility 7
NC AVG 20.9
Rank #27 / 101
3.5
Facility 3.5
NC AVG 5.0
Rank #41 / 101
-22-
13
Facility 13
NC AVG 33
Rank #432 / 572
The Chapel Hill Residential Retirement Center, Inc
$29.1M
Facility $29.1M
NC AVG $13.2M
Rank #8 / 104
$18.0M
Facility $18.0M
NC AVG $4.9M
Rank #8 / 104
61.7%
Facility 61.7%
NC AVG 39.8%
Rank #83 / 104
345199
Signature HealthCARE of Chapel Hill
NH
HC
NC
PC
Chapel Hill (East Franklin Street)
108
Facility 108
NC AVG 72
Rank #65 / 390
82.8%
Facility 82.8%
NC AVG 76.4%
Rank #90 / 271
+8%
3.96
Facility 3.96
NC AVG 3.98
Rank #43 / 97
+62%0%
$0
Facility $0
NC AVG $74.6k
Rank #1 / 105
20
Facility 20
NC AVG 20.9
Rank #67 / 101
5.0
Facility 5.0
NC AVG 5.0
Rank #67 / 101
-98-
74
Facility 74
NC AVG 33
Rank #14 / 572
Moses Muhairwe
$11.3M
Facility $11.3M
NC AVG $13.2M
Rank #67 / 104
$4.4M
Facility $4.4M
NC AVG $4.9M
Rank #76 / 104
39.1%
Facility 39.1%
NC AVG 39.8%
Rank #53 / 104
345225

Financial Assistance for
Nursing Home in North Carolina

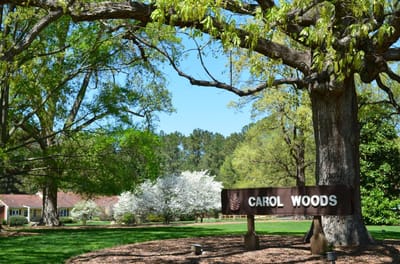
Carol Woods is located in Chapel Hill, North Carolina.
Here are the financial assistance programs available to residents in North Carolina.

Get Financial aid guidance

Community Alternatives Program for Disabled Adults

NC Medicaid CAP/DA

Age 65+ or disabled
General North Carolina resident, Medicaid- eligible, nursing home-level care need.
Income Limits (2025) ~$2,829/month 300% FBR, individual
Asset Limits $2,000 (individual), $3,000 (couple).
NC

High demand; waitlists common in urban areas.

Benefits
Personal care (5-7 hours/day) Respite (240 hours/year) Adult day care ($60/day) Home modifications ($1,500 avg.)

North Carolina Senior Care Options

NC SCO (via NFCSP)

Age Caregiver of someone 60+ (or with dementia)
General North Carolina resident.
Income Limits No strict limit; prioritizes low-income.
Asset Limits Not applicable.
NC

Limited slots; rural/urban balance.

Benefits
In-home respite (4-6 hours/day) Adult day care (~$60/day) Short-term facility care (up to 5 days)

Program of All-Inclusive Care for the Elderly (PACE)

North Carolina PACE (e.g., PACE of the Triad)

Age 55+
General NC resident (specific counties), NFLOC, safe with PACE support.
Income Limits (2025) ~$2,829/month (Medicaid-eligible); private pay option available.
Asset Limits $2,000 (individual), $3,000 (couple) for Medicaid enrollees.
NC

Available in 10+ counties (e.g., Guilford, Wake); multiple providers (e.g., PACE of the Southern Piedmont).

Benefits
Personal care (5-7 hours/day) Medical care Meals Transportation Respite Therapies

In-Home Aide Services

North Carolina In-Home Aide Services

Age 60+
General NC resident, unable to perform 1+ ADL, at risk of nursing home placement.
Income Limits (2025) No strict cap; prioritizes low-income ~$24,980/year
Asset Limits Not assessed; need-based.
NC

Family can be aides; varies by county funding.

Benefits
Personal care (5-20 hours/week) Meal prep Respite (~5 days/year) Errands

Medicare Savings Program (MSP)

North Carolina Medicare Savings Program

Age 65+ or disabled
General NC resident, Medicare Part A/B.
Income Limits (2025) ~$2,510/month (QMB), ~$3,380/month (SLMB), ~$3,598/month (QI)—individual.
Asset Limits $9,430 (individual), $14,130 (couple).
NC

Three tiers; no waitlist; includes Extra Help for Part D.

Benefits
Covers Part B premiums ($174.70/month) Deductibles ($240/year) Copays (~20%)

VA Aid and Attendance (A&A) and Housebound Benefits

North Carolina VA Aid and Attendance/Housebound

Age 65+ or disabled veteran/spouse
General NC resident, wartime service, need for ADL help (A&A) or homebound.
Income Limits (2025) Net income < ~$1,984/month (veteran with dependent, A&A); pension offsets income.
Asset Limits ~$155,356 net worth limit
NC

High veteran demand in rural/urban areas.

Benefits
Cash (~$1,433-$2,642/month veteran, ~$951-$1,318 spouse) for care costs (e.g., in-home, assisted living)

Urgent Repair Program (URP)

North Carolina Urgent Repair Program

Age 60+ prioritized
General NC resident, homeowner, low-income.
Income Limits (2025) ~$30,258/year 50% AMI, varies by county
Asset Limits Not strictly assessed; home value considered.
NC

Forgivable at $2,000/year; statewide via local partners.

Benefits
Repairs (~$8,000-$12,000 avg.) for safety (e.g., roofs, heating, accessibility)

State/County Special Assistance (SA)

North Carolina Special Assistance

Age 65+ (or disabled)
General NC resident, in licensed adult care home, low-income.
Income Limits (2025) ~$1,255/month (individual, 100% FPL); varies by facility rate.
Asset Limits $2,000 individual
NC

Covers assisted living; counties supplement state funds.

Benefits
Cash (~$1,200-$1,500/month) for room/board; Medicaid covers care services

Frequently Asked Questions about Carol Woods

What neighborhood is Carol Woods in?

Carol Woods is in the Carol Woods neighborhood of NC 27514.

Is Carol Woods in a walkable area?

Carol Woods has a walk score of 13. Car-dependent. Most errands require a car, with limited nearby walkable options.

What is the occupancy rate at Carol Woods?

Carol Woods's occupancy is 76.7%.

Does Carol Woods operate as a for-profit or non-profit?

Carol Woods is registered as a non-profit.

Are there photos of Carol Woods?

Yes — there are 8 photos of Carol Woods in the photo gallery on this page.

What is the address of Carol Woods?

Carol Woods is located at 750 Weaver Dairy Rd, Chapel Hill, Nc 27514, Usa.

What is the phone number of Carol Woods?

(919) 968-4511 will put you in contact with the team at Carol Woods.

Guides for Better Senior Living

Care Cost Calculator: See Prices in Your Area

Nursing Home Data Explorer

Don’t Wait Too Long: 7 Red Flag Signs Your Parent Needs Assisted Living Now

The True Cost of Assisted Living in 2025 – And How Families Are Paying For It

Understanding Senior Living Costs: Pricing Models, Discounts & Financial Assistance