Dyersburg Health and Rehabilitation Center
Nursing Home, Memory Care, Respite Care & Hospice Care · Dyersburg, TN
CMS overall rating Info The Overall CMS Rating is scored from 1 to 5 stars and combines results from health inspections, staffing levels, and quality measures. Health inspections carry the most weight. Staffing and quality scores can increase or decrease the final rating based on performance compared to state and national standards.

Dyersburg Health and Rehabilitation Center

Nursing Home, Memory Care, Respite Care & Hospice Care · Dyersburg, TN
CMS overall rating Info The Overall CMS Rating is scored from 1 to 5 stars and combines results from health inspections, staffing levels, and quality measures. Health inspections carry the most weight. Staffing and quality scores can increase or decrease the final rating based on performance compared to state and national standards.

Overview of Dyersburg Health and Rehabilitation Center

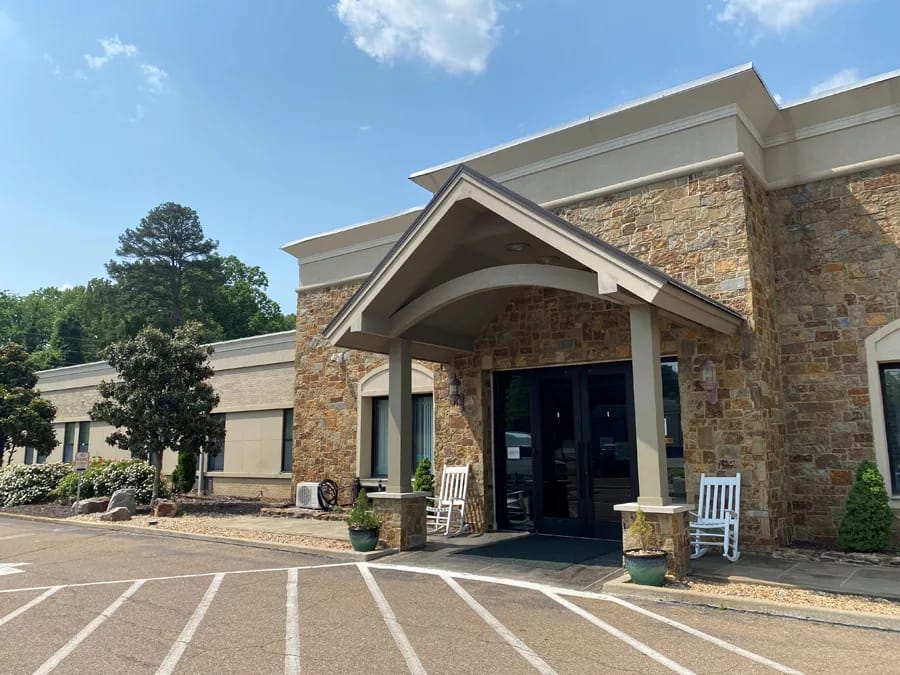
Dyersburg Health and Rehabilitation provides one of Tennessee’s most trusted nursing homes. Specializing in outpatient therapy, skilled nursing, and rehabilitative care, the health center consists of professional staff committed to providing seniors with a safe and comfortable environment. With its professional approach to quality post-acute nursing, Dyersburg Health and Rehab aims to change the meaning of skilled nursing for seniors through the exceptional care of compassionate staff.
They provide state-of-the-art features that cater to short-term or long-term care nursing home residents; they are also guaranteed to feel comfortable and know that they belong in a home that offers 24-hour care with specialized programs such as therapies and memory care services in a resort-like community.

Quality ratings

Measured by Centers for Medicare & Medicaid Services (CMS)

Overall rating Info The Overall CMS Rating combines results from health inspections, staffing levels and quality measures. Health inspections carry the most weight. Staffing and quality scores can increase or decrease the final rating based on performance compared to state and national standards.
▲ 63.4% Above TN avg. ▲ 63.4% Above TN avg.Click the badge to see the full State ranking.Click here to see the full State ranking.
Health Inspection Info Based on the results of the facility's three most recent standard inspections and any complaint investigations. CMS reviews the number, scope, and severity of deficiencies, with more recent findings weighted more heavily.
▲ 37.0% Above TN avg. ▲ 37.0% Above TN avg.Click the badge to see the full State ranking.Click here to see the full State ranking.
Staffing Info Measures average nursing staff hours per resident per day, including Registered Nurses (RNs) and total nursing staff. Ratings are adjusted based on the level of care residents require and are compared to state and national benchmarks.
▲ 104.1% Above TN avg. ▲ 104.1% Above TN avg.Click the badge to see the full State ranking.Click here to see the full State ranking.
Quality Measures Info Based on clinical and physical health indicators reported to CMS, such as hospital readmissions, falls, pressure ulcers, and improvements in mobility. These measures reflect how well residents' health needs are being managed.
▼ 19.6% Below TN avg. ▼ 19.6% Below TN avg.Click the badge to see the full State ranking.Click here to see the full State ranking.

Staffing hours breakdown

Info Daily nursing hours per resident by staff type, reported to CMS. Higher is generally better — compare this facility to state and national averages to see where staffing stands.

Hours per resident per day — compared to Tennessee state averages

Total nursing care / resident Info Total adjusted nursing hours per resident per day, combining RN, LPN, and aide time. CMS adjusts this for case-mix so facilities can be fairly compared.
5h 3m per day
This facility Tennessee avg (3h 40m per day)
vs Tennessee avg
+38%

5 of 6 metrics below state avg

Standout metric Total Nursing (Weekend) is +16% above state avg
Staff typeHours / Day / Residentvs state avg
Registered Nurse (RN) Info RNs hold the highest nursing license and can assess residents, interpret test results, and direct care plans. More RN hours per day often signals stronger clinical oversight and faster response to health changes. 34m per day ▼ 8% State avg: 37m per day · National avg: 41m per day
LPN / LVN Info Licensed Practical Nurses (LPNs) or Licensed Vocational Nurses (LVNs) deliver routine hands-on care — medication administration, wound dressing, and monitoring vital signs. They work under RN supervision and make up a large share of daily bedside care. 1h 0m per day ▼ 9% State avg: 1h 6m per day · National avg: 52m per day
Nurse Aide Info Certified Nurse Aides (CNAs) provide the most direct day-to-day assistance: bathing, dressing, feeding, and mobility. Nurse aide hours are typically the largest staffing category and directly affect residents' quality of life. 1h 52m per day ▼ 13% State avg: 2h 9m per day · National avg: 2h 21m per day
Total Nursing (Weekend) Info Combined nursing hours (RN + LPN + Nurse Aide) per resident per day on weekends. Staffing often drops on weekends — this figure reveals whether the facility maintains adequate coverage outside of weekday hours. 3h 53m per day ▲ 16% State avg: 3h 21m per day · National avg: 3h 26m per day
Physical Therapist Info Hours per resident per day provided by licensed Physical Therapists (PTs) or PT Assistants. PT services help residents recover mobility after injury or illness and are especially important for post-acute (short-stay) rehabilitation. 1m per day ▼ 80% State avg: 5m per day · National avg: 4m per day
RN (Weekend) Info Registered nurse hours specifically on weekends. Facilities sometimes reduce RN presence on Saturdays and Sundays — a low weekend RN figure compared to weekday hours can indicate reduced clinical oversight when most administrative staff are absent. 16m per day ▼ 36% State avg: 25m per day · National avg: 29m per day

Types of Care at Dyersburg Health and Rehabilitation Center

Memory Care Respite Care Nursing Home Hospice Care
Bed community size
123-bed community
A larger shared setting that may offer more common spaces and organized community services.
Years in operation
34 years in operation
A longer operating history, which may indicate experience navigating regulations and delivering ongoing care.
Walk Score
Walk Score: 36 / 100
Somewhat walkable. A few nearby services may be reachable on foot, but most trips require transportation.

About this community

License Details

Facility TypeNursing Home
StatusLicensed
IssuanceJanuary 7, 1992
ExpirationMay 17, 2026
CountyBlount
License Number00000076

Ownership & Operating Entity

Dyersburg Health and Rehabilitation Center is legally operated by The Bay at Dyersburg Health and Rehabili, and administrated by Blaine Miller.

Therapy & Rehabilitation

3 services
Rehabilitation Services
Respite Care
Short-Term Rehab

Memory & Specialized Care

1 service
No Alzheimer's certification

Amenities & Lifestyle

Cable Television
Wireless Internet
Library
Courtyard
Community Garden
Family Visitation Room
Three Delicious And Nutritious Meals Daily
Housekeeping And Laundry Service
Barber/Beauty Salon
Scheduled Transportation
Short-Term Respite Stays
Spiritual Services
Specific ProgramsOutpatient Therapy

Dining & Nutrition

Food DescriptionThree delicious and nutritious meals daily.

Contact Dyersburg Health and Rehabilitation Center

Inspection History

In Tennessee, the Department of Health, Division of Health Care Facilities performs unannounced inspections and investigations to ensure facilities provide high-quality resident care.

Read the full inspection reports for this facility, including detailed findings and corrective actions.

Show Inspection Reports

Residents information

Stay stats

Average length of stay
644 days
Total residents
89
Total admissions (2024)
52
Total discharges (2024)
56

Discharges

  • To Private Residence or Home 3
  • To Nursing Home 7

Demographics

GENDER

  • Female Residents 65.2%
  • Male Residents 34.8%

AGE DISTRIBUTION

  • 60-64 1.1%
  • 65-69 2.2%
  • 70-74 1.1%
  • 75-79 11.2%
  • 80-84 23.6%
  • 85-89 25.8%
  • 90 or more 34.8%

ETHNICITY

  • White Residents 100%

Health Inspection History

Inspections Since 2023
Total health inspections 1

Tennessee average 3.5


Last Health inspection on Aug 2023

Total health citations
3

Tennessee average 15.4

Citations per inspection
3

Tennessee average 4.39


Health citations are formal notices following inspections when they fail to comply with safety and care standards.

All 3 citations resulted from standard inspections.

Breakdown of citation severity (last 3 years)
Critical Health citations
0
100% better than Tennessee average

Tennessee average: 1.1


Serious Health citations
0
100% better than Tennessee average

Tennessee average: 0.6

0 critical citations Tennessee average: 1.1

0 serious citations Tennessee average: 0.6

3 moderate citations Tennessee average: 13.7

0 minor citations Tennessee average: 0.1
Citations history (last 3 years)
Quality of Care moderate citation Aug 09, 2023
Corrected

Care Planning moderate citation Aug 09, 2023
Corrected

Care Planning moderate citation Aug 09, 2023
Corrected

Staffing Data

Reporting period: April 1 – June 30, 2025 (Q2 2025). Source: CMS Payroll-Based Journal report.

Total staff 101
Employees 99
Contractors 2
Staff to resident ratio 1.46:1
18% worse than Tennessee average
Tennessee average ratio: 1.79:1 Tennessee average ratio: 1.79:1See full Tennessee ranking
Avg staff/day 41
Average shift 8.7 hours
5% better than Tennessee average
Tennessee average: 8.3 hours Tennessee average shift: 8.3 hoursSee full Tennessee ranking
Total staff hours (quarter) 32,576

Nursing staff breakdown

Q2 2025 · Apr 1 – Jun 30 More info This data comes from the CMS Payroll-Based Journal report covering April 1 – June 30, 2025.
Registered Nurse

Manages medical care and health needs.

Total count 16
Average shift length Info Average shift length. Calculated as total hours divided by days worked and average staff per day. 10.2 hours

No contractors work on this role.

Licensed Practical Nurse

Assists with medical care and medications.

Total count 12
Average shift length Info Average shift length. Calculated as total hours divided by days worked and average staff per day. 9.6 hours

No contractors work on this role.

Certified Nursing Assistant

Helps with daily care and mobility.

Total count 41
Average shift length Info Average shift length. Calculated as total hours divided by days worked and average staff per day. 9.5 hours

No contractors work on this role.

Contractor staffing

Q2 2025 · Apr 1 – Jun 30 More info This data comes from the CMS Payroll-Based Journal report covering April 1 – June 30, 2025.

Total hours from contractors

0.1%

41 contractor hours this quarter

Medical Director: 1 Occupational Therapy Assistant: 1

Staff by category

Q2 2025 · Apr 1 – Jun 30 More info This data comes from the CMS Payroll-Based Journal report covering April 1 – June 30, 2025.
Certified Nursing Assistant4104114,91891100%9.5
Registered Nurse160166,79691100%10.2
Licensed Practical Nurse120124,62591100%9.6
Clinical Nurse Specialist4041,1156571%6.1
Other Dietary Services Staff3031,0577481%7.3
Physical Therapy Assistant5059247886%5.7
Respiratory Therapy Technician8086937380%4.5
Nurse Practitioner2025436369%8.4
Occupational Therapy Aide1014966369%7.9
Mental Health Service Worker1014725965%8
Administrator1014565965%7.7
Speech Language Pathologist3032512527%6.1
Qualified Social Worker2021914044%4.8
Occupational Therapy Assistant0112633%8.5
Medical Director0111533%5
41 Certified Nursing Assistant
% of Days 100%
16 Registered Nurse
% of Days 100%
12 Licensed Practical Nurse
% of Days 100%
4 Clinical Nurse Specialist
% of Days 71%
3 Other Dietary Services Staff
% of Days 81%
5 Physical Therapy Assistant
% of Days 86%
8 Respiratory Therapy Technician
% of Days 80%
2 Nurse Practitioner
% of Days 69%
1 Occupational Therapy Aide
% of Days 69%
1 Mental Health Service Worker
% of Days 65%
1 Administrator
% of Days 65%
3 Speech Language Pathologist
% of Days 27%
2 Qualified Social Worker
% of Days 44%
1 Occupational Therapy Assistant
% of Days 3%
1 Medical Director
% of Days 3%

Penalties and fines

Federal penalties imposed by CMS for regulatory violations, including civil money penalties (fines) and denials of payment for new Medicare/Medicaid admissions.

Source: CMS Penalties Database

No penalties in the past 3 years

No civil money penalties or payment denials were reported in the last 3 years.

Quality of care over time

These measures show how residents usually do over time at this home, based on health outcomes and preventive care.

High-risk clinical events score Info A composite score based on pressure ulcers, falls with injury, weight loss, walking ability decline, and activities of daily living decline. 9.9
6% better than Tennessee average

Tennessee average: 10.5

Functional decline score Info A composite score based on activities of daily living decline, walking ability decline, and incontinence. 16.9
13% better than Tennessee average

Tennessee average: 19.5

Long-stay resident measures
Below average Info CMS star rating based on long-stay quality measure performance. 5 stars = significantly above average, 1 star = significantly below average.
Need for Help with Daily Activities Increased Info Percent of long-stay residents whose need for help with daily activities has increased 13.9%
13% better than Tennessee average

Tennessee average: 16.0%

Walking Ability Worsened Info Percent of long-stay residents whose ability to move independently worsened 18.5%
15% better than Tennessee average

Tennessee average: 21.7%

Low Risk Residents with Bowel/Bladder Incontinence Info Percent of low risk long-stay residents who lose control of their bowels or bladder 18.3%
12% better than Tennessee average

Tennessee average: 20.7%

Falls with Major Injury Info Percent of long-stay residents experiencing one or more falls with major injury 5.2%
41% worse than Tennessee average

Tennessee average: 3.7%

High Risk Residents with Pressure Ulcers Info Percent of long-stay high risk residents with pressure ulcers 6.4%
17% worse than Tennessee average

Tennessee average: 5.4%

Urinary Tract Infection Info Percent of long-stay residents with a urinary tract infection 2.4%
15% worse than Tennessee average

Tennessee average: 2.1%

Lost Too Much Weight Info Percent of long-stay residents who lose too much weight 5.5%
13% better than Tennessee average

Tennessee average: 6.3%

Depressive Symptoms Info Percent of long-stay residents who have depressive symptoms 1.2%
89% better than Tennessee average

Tennessee average: 11.0%

Antipsychotic Use Info Percent of long-stay residents who received an antipsychotic medication 9.9%
40% better than Tennessee average

Tennessee average: 16.5%

Pneumococcal Vaccine Info Percent of long-stay residents assessed and appropriately given the pneumococcal vaccine 99.5%
11% better than Tennessee average

Tennessee average: 89.9%

Influenza Vaccine Info Percent of long-stay residents assessed and appropriately given the seasonal influenza vaccine 98.3%
In line with Tennessee average

Tennessee average: 94.5%

Hospitalizations per 1,000 days Info Number of hospitalizations per 1,000 long-stay resident days. 2.01
27% worse than Tennessee average

Tennessee average: 1.58

ED visits per 1,000 days Info Number of outpatient emergency department visits per 1,000 long-stay resident days. 3.26
108% worse than Tennessee average

Tennessee average: 1.57

Short-stay resident measures
Significantly below average Info CMS star rating based on short-stay quality measure performance. 5 stars = much above average, 1 star = much below average.
Pneumococcal Vaccine Info Percent of short-stay residents assessed and appropriately given the pneumococcal vaccine 90.8%
14% better than Tennessee average

Tennessee average: 79.7%

Antipsychotic medication increase Info Percent of short-stay residents who newly received an antipsychotic medication 1.4%
21% better than Tennessee average

Tennessee average: 1.7%

Influenza Vaccine Info Percent of short-stay residents assessed and appropriately given the seasonal influenza vaccine 87.1%
9% better than Tennessee average

Tennessee average: 79.8%

Re-hospitalized after SNF stay Info Percentage of short-stay residents who were re-hospitalized after their nursing home admission. 23.4%
5% worse than Tennessee average

Tennessee average: 22.2%

Emergency department visits Info Percentage of short-stay residents who had an outpatient emergency department visit. 10.8%
In line with Tennessee average

Tennessee average: 11.2%

Falls with major injury Info Percentage of SNF residents who experience falls with major injury during their stay. 6.1%
687% worse than Tennessee average

Tennessee average: 0.8%

Ability to care for self at discharge Info Percentage of residents at or above expected ability to care for themselves at discharge. 34.2%
36% worse than Tennessee average

Tennessee average: 53.7%

Successful return to home or community Info Rate of successful return to home or community from a skilled nursing facility. 44.2%
13% worse than Tennessee average

Tennessee average: 50.6%

Facility Characteristics

Source: CMS Long-Term Care Facility Characteristics (Data as of Jan 2026)

Total residents 69
Medicaid
42
60.9% of residents
Private pay or other
27
39.1% of residents
Programs & Services
Residents Group

Residents meet regularly to discuss policies, care quality, and activities

Nurse Aide Training

State-approved Nurse Aide Training and Competency Evaluation Program on-site

Active Resident Council

Organized group of residents that meets regularly to discuss facility policies, quality of life, and activities.

Finances and operations

Governmental community
Operated by a subsidized facility district.
Home revenue
$8.2M
Surplus of revenue
$2.6M
Governmental community Operated by a subsidized facility district.
Home revenue
$8.2M
Surplus of revenue
$2.6M
Payroll costs Info The portion of the home's budget spent on staff, including nurses, caregivers, and other employees who support care and operations.
$2.3M
28.4% of revenue
Other operating costs Info All remaining costs needed to run the home, such as food, utilities, building maintenance, supplies and administrative expenses.
$3.3M
Total costs $5.6M

Places of interest near Dyersburg Health and Rehabilitation Center

Address 1.1 miles from city center Info Estimated distance in miles from Dyersburg's city center to Dyersburg Health and Rehabilitation Center's address, calculated via Google Maps. — 0.05 miles to nearest hospital (Tennova Cardiology - Dyersburg)

Calculate Travel Distance to Dyersburg Health and Rehabilitation Center

Add your location

Address

Financial Assistance for
Nursing Home in Tennessee

Dyersburg Health and Rehabilitation Center is located in Dyersburg, Tennessee.
Here are the financial assistance programs available to residents in Tennessee.

Get Financial aid guidance

CHOICES Program

TN Medicaid CHOICES

Age 65+ or disabled
General Tennessee resident, Medicaid-eligible, nursing home-level care need.
Income Limits (2025) ~$2,829/month 300% FBR, individual
Asset Limits $2,000 (individual), $3,000 (couple).
TN

Managed care model; high rural demand.

Benefits
Personal care (5-7 hours/day) Respite (240 hours/year) Adult day care ($65/day) Home modifications ($1,500 avg.)

Tennessee Options for Community Living

TN Options

Age 60+
General Tennessee resident, at risk of nursing home.
Income Limits ~$2,000/month individual, varies
Asset Limits $5,000 individual
TN

Limited funding; rural/urban balance.

Benefits
In-home care (3-5 hours/week) Respite (up to 10 days/year) Transportation (~5 trips/month)

Medicare Savings Program (MSP)

Tennessee Medicare Savings Program

Age 65+ or disabled
General TN resident, Medicare Part A/B.
Income Limits (2025) ~$2,510/month (QMB), ~$3,380/month (SLMB), ~$3,598/month (QI)—individual.
Asset Limits $9,430 (individual), $14,130 (couple).
TN

Three tiers; includes Extra Help for Part D; no waitlist.

Benefits
Covers Part B premiums ($174.70/month) Deductibles ($240/year) Copays (~20%)

Family Caregiver Support Program (FCSP)

Tennessee Family Caregiver Support Program

Age
General Caregivers of 60+ needing care or 55+ caregivers of others; TN resident; functional needs (2+ ADLs).
Income Limits (2025) No strict cap; prioritizes low-income ~$24,980/year
Asset Limits Not assessed; need-based.
TN

Includes grandparent caregivers; high rural demand.

Benefits
Respite (4-6 hours/week or 5 days/year) Adult day care ($60/day) Training Supplies (~$500/year)

VA Aid and Attendance (A&A) and Housebound Benefits

Tennessee VA Aid and Attendance/Housebound

Age 65+ or disabled veteran/spouse
General TN resident, wartime service, need for ADL help (A&A) or homebound.
Income Limits (2025) Net income < ~$1,984/month (veteran with dependent, A&A); pension offsets income.
Asset Limits ~$155,356 net worth limit
TN

High veteran population; supports rural/urban care needs.

Benefits
Cash (~$1,433-$2,642/month veteran, ~$951-$1,318 spouse) for care costs (e.g., in-home, assisted living)

Elderly Nutrition Program

Tennessee Elderly Nutrition Program

Age 60+
General TN resident; no income limit but prioritizes low-income.
Income Limits (2025) None; donations encouraged.
Asset Limits Not assessed.
TN

Serves ~50,000 annually; 200+ congregate sites plus Meals on Wheels.

Benefits
Congregate meals ($5-$7/meal value) at senior centers Home-delivered meals ($5-$7/meal)

Property Tax Relief Program

Tennessee Property Tax Relief Program

Age 65+
General TN resident, homeowner/renter (or widow/er 50+, disabled 18+).
Income Limits (2025) ~$45,000/year household, excludes half of Social Security
Asset Limits Not assessed; income-focused.
TN

Rebates up to $1,000; serves ~100,000 annually.

Benefits
Tax rebates (~$250-$1,000 based on income; e.g., $1,000 if income < $8,000)

Compare Nursing Home around Dyersburg

The information below is reported by the Tennessee Department of Health, Division of Health Care Facilities.

2 facilities compared · CMS & TN Dept. of Health data

Filter by care type
Dyersburg Health and Rehabilitation Center
NH

Nursing Home Licensed facility providing 24/7 skilled nursing care for residents with complex, ongoing medical needs. Staffed by RNs, LPNs, and CNAs. Inspected and star-rated annually by CMS. Accepts Medicare (short-term rehab) and Medicaid (long-term care).

AL

Assisted Living A licensed, long-term care setting for seniors or individuals with disabilities who need help with daily activities — like bathing, dressing, and medication management — but not 24-hour skilled nursing. Offers housing, meals, and around-the-clock support while aiming to maximize resident independence.

Dyersburg123--5.06 +81%+39%$033.0-66 36 The Bay At Dyersburg Health And Rehabili---445071
AHC Dyersburg
NH

Nursing Home Licensed facility providing 24/7 skilled nursing care for residents with complex, ongoing medical needs. Staffed by RNs, LPNs, and CNAs. Inspected and star-rated annually by CMS. Accepts Medicare (short-term rehab) and Medicaid (long-term care).

AL

Assisted Living A licensed, long-term care setting for seniors or individuals with disabilities who need help with daily activities — like bathing, dressing, and medication management — but not 24-hour skilled nursing. Offers housing, meals, and around-the-clock support while aiming to maximize resident independence.

Dyersburg130 75.8% +4%3.21 -7%-11%$0217.0-93 34 Stephanie Burkett$17.0M$5.0M29.6%445446

Frequently Asked Questions about Dyersburg Health and Rehabilitation Center

Who is the owner of Dyersburg Health and Rehabilitation Center?

The legal owner and operator of Dyersburg Health and Rehabilitation Center is The Bay at Dyersburg Health and Rehabili.

Is Dyersburg Health and Rehabilitation Center in a walkable area?

Dyersburg Health and Rehabilitation Center has a walk score of 36. Somewhat walkable. A few nearby services may be reachable on foot, but most trips require transportation.

What is the license number of Dyersburg Health and Rehabilitation Center?

According to TN state health department records, Dyersburg Health and Rehabilitation Center's license number is 00000076.

When does Dyersburg Health and Rehabilitation Center's license expire?

According to TN state health department records, Dyersburg Health and Rehabilitation Center's license expires on May 17, 2026.

Who is the administrator of Dyersburg Health and Rehabilitation Center?

Blaine Miller is the administrator of Dyersburg Health and Rehabilitation Center.

How many beds does Dyersburg Health and Rehabilitation Center have?

Dyersburg Health and Rehabilitation Center has 123 beds.

Are there photos of Dyersburg Health and Rehabilitation Center?

Yes — there are 6 photos of Dyersburg Health and Rehabilitation Center in the photo gallery on this page.

Guides for Better Senior Living

Care Cost Calculator: See Prices in Your Area

Nursing Home Data Explorer

Don’t Wait Too Long: 7 Red Flag Signs Your Parent Needs Assisted Living Now

The True Cost of Assisted Living in 2025 – And How Families Are Paying For It

Understanding Senior Living Costs: Pricing Models, Discounts & Financial Assistance

Explore Open Rooms
1 Contact details
2 What type of senior care service are you looking for?
3 What budget do you have in mind for senior care?
4 How soon do you need to find care?
5 Additional details

Thank you for your interest!

Our team will be in touch shortly to help with next steps.