Mcgregor at Overlook
Nursing Home, Assisted Living, Hospice Care, Independent Living, Nursing Care & Respite Care · East Cleveland, OH
CMS overall rating Info CMS (the Centers for Medicare & Medicaid Services) is the federal agency that rates nursing home quality. Its Overall Rating runs from 1 to 5 stars, combining health inspections, staffing, and quality measures, with inspections weighted most heavily.

Mcgregor at Overlook

Nursing Home, Assisted Living, Hospice Care, Independent Living, Nursing Care & Respite Care · East Cleveland, OH
CMS overall rating Info CMS (the Centers for Medicare & Medicaid Services) is the federal agency that rates nursing home quality. Its Overall Rating runs from 1 to 5 stars, combining health inspections, staffing, and quality measures, with inspections weighted most heavily.
Calculator: See prices in your area
Mcgregor at Overlook accepts Medicare and private pay.

Overview of Mcgregor at Overlook

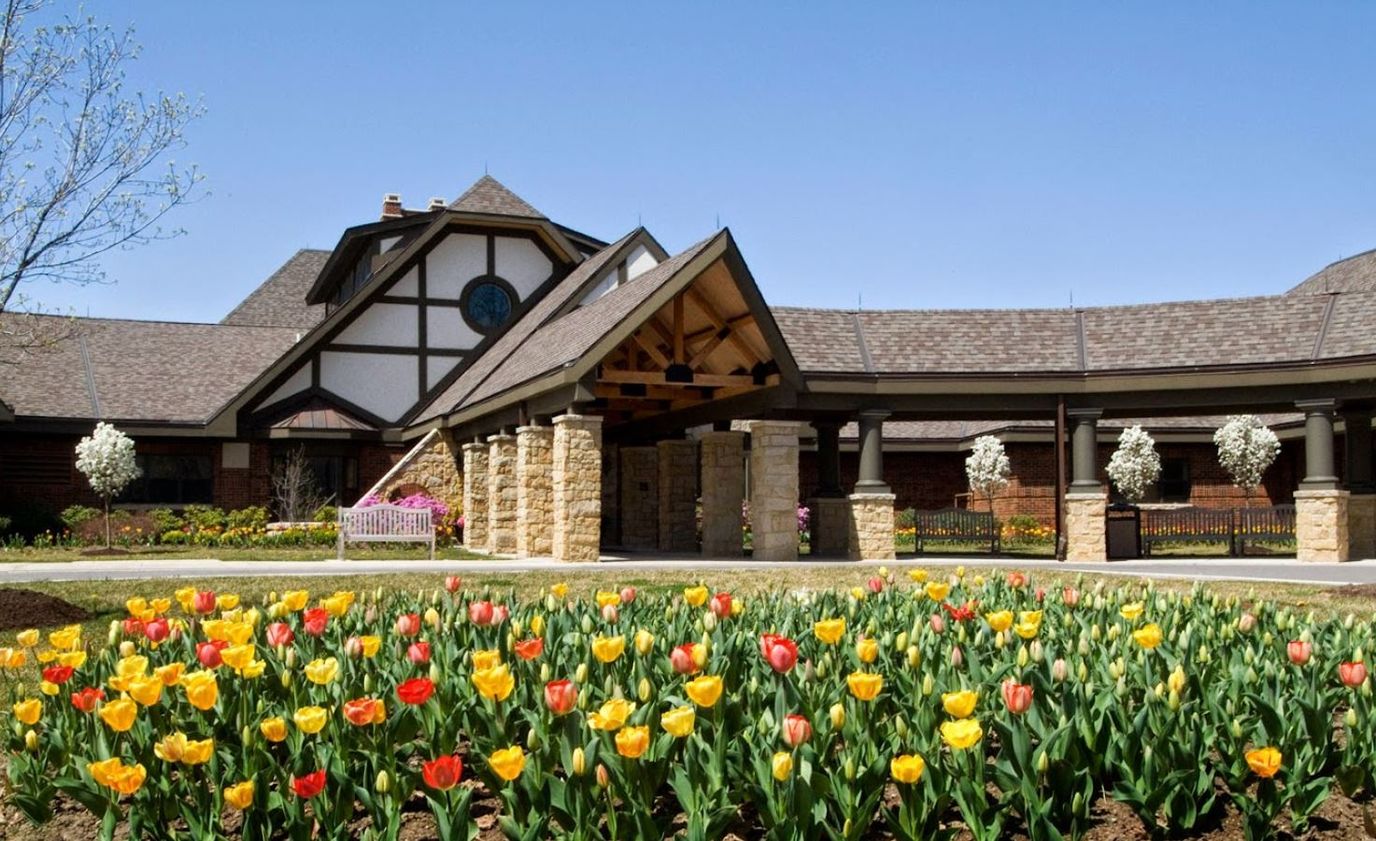
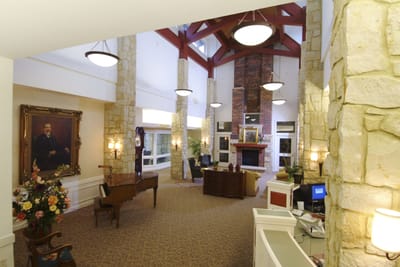
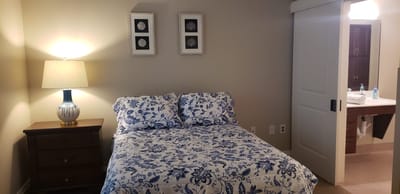
McGregor at Overlook in Cleveland, Ohio, prioritizes successful aging. Their focus on holistic wellness empowers residents to thrive and embrace a fulfilling new lifestyle. Gracious senior living practices ensure a comfortable and enriching environment. Residents enjoy a variety of amenities, including an activity center, outdoor areas, and housekeeping services. The convenient location near healthcare facilities, retail stores, and houses of worship provides easy access to everyday needs.

McGregor at Overlook takes a comprehensive approach to resident well-being. Their philosophy goes beyond basic care, incorporating programs and services that nurture the mind, body, and spirit. McGregor at Overlook offers a variety of living options to suit individual needs. These include assisted living, independent living, memory care, and nursing care. With costs ranging from $2,190 to $7,189 per month, they have a variety of budgets.

Quality ratings

Measured by Centers for Medicare & Medicaid Services (CMS)

Overall rating Info The Overall CMS Rating combines results from health inspections, staffing levels and quality measures. Health inspections carry the most weight. Staffing and quality scores can increase or decrease the final rating based on performance compared to state and national standards.
▲ 25.7% Above OH avg. ▲ 25.7% Above OH avg.OH average: 3.2Click the badge to see the full State ranking.Click here to see the full State ranking.
Health Inspection Info Based on the results of the facility's three most recent standard inspections and any complaint investigations. CMS reviews the number, scope, and severity of deficiencies, with more recent findings weighted more heavily.
▲ 42.8% Above OH avg. ▲ 42.8% Above OH avg.OH average: 2.8Click the badge to see the full State ranking.Click here to see the full State ranking.
Staffing Info Measures average nursing staff hours per resident per day, including Registered Nurses (RNs) and total nursing staff. Ratings are adjusted based on the level of care residents require and are compared to state and national benchmarks.
▼ 59.1% Below OH avg. ▼ 59.1% Below OH avg.OH average: 2.4Click the badge to see the full State ranking.Click here to see the full State ranking.
Quality Measures Info Based on clinical and physical health indicators reported to CMS, such as hospital readmissions, falls, pressure ulcers, and improvements in mobility. These measures reflect how well residents' health needs are being managed.
▲ 14.7% Above OH avg. ▲ 14.7% Above OH avg.OH average: 4.4Click the badge to see the full State ranking.Click here to see the full State ranking.

Staffing hours breakdown

Info Daily nursing hours per resident by staff type, reported to CMS. Higher is generally better — compare this facility to state and national averages to see where staffing stands.

Hours per resident per day — compared to Ohio state averages

Total nursing care / resident Info This home is ranked 35th out of 210 homes in Ohio for nurse hours. Total adjusted nursing hours per resident per day, combining RN, LPN, and aide time. CMS adjusts this for case-mix so facilities can be fairly compared.
4h 10m per day
Rank #35 / 210Nurse hours — State benchmarkedThis home is ranked 35th out of 210 homes in Ohio. Shows adjusted nurse hours per resident per day benchmarked to the Ohio average, with a ranking across 210 Ohio facilities. More hours mean more direct care. The national average is about 3.5 hrs; below 3.0 is a red flag.Rankings are based only on facilities in Ohio that report data for that category. Facilities without available data are excluded from the ranking.Click the rank badge to see the full State ranking.Click here to see the full State ranking.
This facility Ohio avg (3h 32m per day)
vs Ohio avg
+18%

0 of 1 metrics below state avg

Standout metric Weekend Total Nursing is +9% above state avg
Staff typeHours / Day / Residentvs state avg
Weekend Total Nursing Info Combined nursing hours (RN + LPN + Nurse Aide) per resident per day on weekends. Staffing often drops on weekends — this figure reveals whether the facility maintains adequate coverage outside of weekday hours. 3h 38m per day ▲ 9% State avg: 3h 20m per day · National avg: 3h 27m per day

Capacity and availability

This home usually has limited availability

Higher occupancy than the Ohio average: 78.7%
Occupancy rate
93.2% Rank #46 / 211Occupancy rate — State benchmarkedThis home is ranked 46th out of 211 homes in Ohio. Shows this facility's occupancy rate versus the Ohio average, with its Statewide rank out of 211. Higher occupancy signals strong local demand and financial stability.Rankings are based only on facilities in Ohio that report data for that category. Facilities without available data are excluded from the ranking.Click the rank badge to see the full State ranking.Click here to see the full State ranking.
Avg. Length of Stay
122 days
Bed community size
148-bed community Rank #20 / 323Bed count — State benchmarkedThis home is ranked 20th out of 323 homes in Ohio. Shows this facility's certified or reported bed count compared to other Ohio facilities. Larger communities may offer more amenities, programs, and on-site services for residents and families.Rankings are based only on facilities in Ohio that report data for that category. Facilities without available data are excluded from the ranking.Click the rank badge to see the full State ranking.Click here to see the full State ranking.
A larger shared setting that may offer more common spaces and organized community services.
Walk Score
Walk Score: 52 / 100 Rank #229 / 705Walk Score — State benchmarkedThis home is ranked 229th out of 705 homes in Ohio. Shows how walkable this facility's neighborhood is compared to the average Walk Score across Ohio facilities. Higher scores benefit residents, families, and staff.Rankings are based only on facilities in Ohio that report data for that category. Facilities without available data are excluded from the ranking.Click the rank badge to see the full State ranking.Click here to see the full State ranking.
Moderately walkable. Some errands can be accomplished on foot, with a mix of nearby amenities.

Safety & Compliance

Emergency SystemsEmergency call system.

Therapy & Rehabilitation

2 services
Rehabilitation Services
Respite Care

Staffing & Medical

1 service
24-Hour Staffing

Amenities & Lifestyle

Weekly Housekeeping
Laundry
Daily Trash Removal
Salon Services
Gardens
Patio
Walking Paths
Activity Areas
Private Spa Bathing Area
Main Dining Room
Multi-Purpose Room With Kitchen
Specific ProgramsSenior Housing

Contact Mcgregor at Overlook

Staffing Data

Reporting period: October 1 – December 31, 2025 (Q4 2025). Source: CMS Payroll-Based Journal report.

Total staff 305
Employees 182
Contractors 123
Staff to resident ratio 2.26 : 1
11% more staff per resident than Ohio average
Ohio average ratio: 2.04 : 1 Ohio average ratio: 2.04 : 1See full Ohio ranking
Avg staff/day 83
Average shift 7.5 hours
7% worse than Ohio average
Ohio average: 8.1 hours Ohio average shift: 8.1 hoursSee full Ohio ranking
Total staff hours (quarter) 57,374

Nursing staff breakdown

Q4 2025 · Oct 1 – Dec 31 More info This data comes from the CMS Payroll-Based Journal report covering October 1 – December 31, 2025.
Registered Nurse

Manages medical care and health needs.

RN Staff Info All 7 RN Staff are full-time employees. No contractors work on this role. 7
Average shift length Info Average shift length. Calculated as total hours divided by days worked and average staff per day. 8.4 hours
Licensed Practical Nurse

Assists with medical care and medications.

LPN Staff Info 85 total: 43 full-time employees and 42 contractors. 85
Average shift length Info Average shift length. Calculated as total hours divided by days worked and average staff per day. 7.8 hours
Certified Nursing Assistant

Helps with daily care and mobility.

CNA Staff Info 163 total: 103 full-time employees and 60 contractors. 163
Average shift length Info Average shift length. Calculated as total hours divided by days worked and average staff per day. 7.5 hours

Contractor staffing

Q4 2025 · Oct 1 – Dec 31 More info This data comes from the CMS Payroll-Based Journal report covering October 1 – December 31, 2025.

Total hours from contractors

14.6%

8,402 contractor hours this quarter

Certified Nursing Assistant: 60 Licensed Practical Nurse: 42 Physical Therapy Aide: 5 Speech Language Pathologist: 4 Qualified Social Worker: 3 Occupational Therapy Aide: 2 Respiratory Therapy Technician: 2 Physical Therapy Assistant: 2 Occupational Therapy Assistant: 2 Medical Director: 1

Staff by category

Q4 2025 · Oct 1 – Dec 31 More info This data comes from the CMS Payroll-Based Journal report covering October 1 – December 31, 2025.
Certified Nursing Assistant1036016329,77392100%7.5
Licensed Practical Nurse43428513,13892100%7.8
Clinical Nurse Specialist100102,3598087%7.9
RN Director of Nursing4041,6479199%9.4
Other Dietary Services Staff4041,47292100%7.4
Speech Language Pathologist0441,2217885%6.1
Physical Therapy Aide0551,0589199%6.6
Dental Services Staff2029426368%8
Registered Nurse7079187784%8.4
Qualified Social Worker0339046773%7.2
Respiratory Therapy Technician0227066874%6.4
Occupational Therapy Aide1237067278%6.1
Nurse Practitioner1014886166%8
Mental Health Service Worker1014856166%8
Administrator1014485661%8
Physical Therapy Assistant0224436368%7
Dietitian1014295459%7.9
Occupational Therapy Assistant0221102426%4.2
Medication Aide/Technician303821213%6.9
Medical Director011361213%3
Nurse Aide in Training1011111%10.5
163 Certified Nursing Assistant
% of Days 100%
85 Licensed Practical Nurse
% of Days 100%
10 Clinical Nurse Specialist
% of Days 87%
4 RN Director of Nursing
% of Days 99%
4 Other Dietary Services Staff
% of Days 100%
4 Speech Language Pathologist
% of Days 85%
5 Physical Therapy Aide
% of Days 99%
2 Dental Services Staff
% of Days 68%
7 Registered Nurse
% of Days 84%
3 Qualified Social Worker
% of Days 73%
2 Respiratory Therapy Technician
% of Days 74%
3 Occupational Therapy Aide
% of Days 78%
1 Nurse Practitioner
% of Days 66%
1 Mental Health Service Worker
% of Days 66%
1 Administrator
% of Days 61%
2 Physical Therapy Assistant
% of Days 68%
1 Dietitian
% of Days 59%
2 Occupational Therapy Assistant
% of Days 26%
3 Medication Aide/Technician
% of Days 13%
1 Medical Director
% of Days 13%
1 Nurse Aide in Training
% of Days 1%

Penalties and fines

Includes penalties issued in 2023

Federal penalties imposed by CMS for regulatory violations, including civil money penalties (fines) and denials of payment for new Medicare/Medicaid admissions.

Source: CMS Penalties Database (Data as of Jan 2026)

Total fines amount $16K Rank #161 / 211Federal fines — State benchmarkedThis home is ranked 161st out of 211 homes in Ohio. Shows this facility's cumulative CMS federal fine dollars versus the Ohio average among facilities with fines, and where it ranks among 211 facilities in the pool. Lower total dollars mean a better rank.Rankings are based only on facilities in Ohio that report data for that category. Facilities without available data are excluded from the ranking.Click the rank badge to see the full State ranking.Click here to see the full State ranking.
77% lower than Ohio average

Ohio average: $69K

Number of fines 1
46% fewer fines than Ohio average

Ohio average: 1.9

Payment Denials Info Serious action where Medicare and/or Medicaid temporarily stops payments for new residents until issues are fixed. 0
100% fewer payment denials than Ohio average

Ohio average: 0.5

Fines amount comparison
This facility $16K
Ohio average $69K
Penalty History

Penalties are imposed by CMS for violations of federal nursing home regulations.

1 penalty in the past 3 years

Aug 10, 2023 · $16K

Civil Money Penalty Info Fines imposed for noncompliance, which can be assessed per day or per instance of violation. Aug 10, 2023
$16K

Last updated: Jan 2026

Quality of care over time

These measures show how residents usually do over time at this home, based on health outcomes and preventive care.

High-risk clinical events score Info A composite score based on pressure ulcers, falls with injury, weight loss, walking ability decline, and activities of daily living decline. 5.0
15% better than Ohio average

Ohio average: 5.8

Functional decline score Info A composite score based on activities of daily living decline, walking ability decline, and incontinence. 12.0
5% better than Ohio average

Ohio average: 12.7

Long-stay resident measures
Need for Help with Daily Activities Increased Info Percent of long-stay residents whose need for help with daily activities has increased 6.9%
In line with Ohio average

Ohio average: 6.8%

Walking Ability Worsened Info Percent of long-stay residents whose ability to move independently worsened 9.8%
10% worse than Ohio average

Ohio average: 8.9%

Low Risk Residents with Bowel/Bladder Incontinence Info Percent of low risk long-stay residents who lose control of their bowels or bladder 19.4%
12% better than Ohio average

Ohio average: 22.0%

Falls with Major Injury Info Percent of long-stay residents experiencing one or more falls with major injury 0.7%
81% better than Ohio average

Ohio average: 3.4%

High Risk Residents with Pressure Ulcers Info Percent of long-stay high risk residents with pressure ulcers 5.6%
45% worse than Ohio average

Ohio average: 3.9%

Urinary Tract Infection Info Percent of long-stay residents with a urinary tract infection 0.9%
60% worse than Ohio average

Ohio average: 0.5%

Lost Too Much Weight Info Percent of long-stay residents who lose too much weight 2.0%
67% better than Ohio average

Ohio average: 6.2%

Depressive Symptoms Info Percent of long-stay residents who have depressive symptoms 7.5%
69% better than Ohio average

Ohio average: 24.0%

Antipsychotic Use Info Percent of long-stay residents who received an antipsychotic medication 4.6%
45% better than Ohio average

Ohio average: 8.4%

Pneumococcal Vaccine Info Percent of long-stay residents assessed and appropriately given the pneumococcal vaccine 99.6%
8% better than Ohio average

Ohio average: 92.4%

Influenza Vaccine Info Percent of long-stay residents assessed and appropriately given the seasonal influenza vaccine 99.2%
5% better than Ohio average

Ohio average: 94.5%

Short-stay resident measures
Pneumococcal Vaccine Info Percent of short-stay residents assessed and appropriately given the pneumococcal vaccine 95.6%
22% better than Ohio average

Ohio average: 78.0%

Antipsychotic medication increase Info Percent of short-stay residents who newly received an antipsychotic medication 0.2%
83% better than Ohio average

Ohio average: 1.3%

Influenza Vaccine Info Percent of short-stay residents assessed and appropriately given the seasonal influenza vaccine 91.5%
21% better than Ohio average

Ohio average: 75.6%

Breakdown by payment type

Medicare

14% of new residents, usually for short-term rehab.

Typical stay 28 days

Private pay

85% of new residents, often for short stays.

Typical stay 1 - 2 months

Facility Characteristics

Source: CMS Long-Term Care Facility Characteristics (Data as of Jan 2026)

Total residents 135
Medicare
2
1.5% of residents
Medicaid
99
73.3% of residents
Private pay or other
34
25.2% of residents
Programs & Services
Residents Group

Residents meet regularly to discuss policies, care quality, and activities

CCRC

Part of a Continuing Care Retirement Community offering multiple care levels

Active Resident Council

Organized group of residents that meets regularly to discuss facility policies, quality of life, and activities.

Finances and operations

Based on CMS SNF Cost Report for fiscal year ending in 04/2024.

Nonprofit
Nonprofit Corporation
Net patient revenue Info Net patient revenue — what the home actually collects for resident care, after contractual allowances, bad debt and discounts are subtracted from its gross charges (CMS cost report, Worksheet G-3). It covers resident care only; money the home earns from other sources is shown separately as "Other income."
$15.7M
Net patient income Info Net patient income: net patient revenue minus the home's total operating expenses. A positive figure means it earns more from resident care than it spends to deliver it; a negative figure means the opposite. It excludes non-operating "other income."
-$16.2M
Nonprofit Nonprofit Corporation
Net patient revenue Info Net patient revenue — what the home actually collects for resident care, after contractual allowances, bad debt and discounts are subtracted from its gross charges (CMS cost report, Worksheet G-3). It covers resident care only; money the home earns from other sources is shown separately as "Other income."
$15.7M Rank #3 / 210Revenue — State benchmarkedThis home is ranked 3rd out of 210 homes in Ohio. Shows this facility's annual revenue compared to the Ohio average. Higher revenue generally means more resources for staffing and capital — read alongside Payroll %.Rankings are based only on facilities in Ohio that report data for that category. Facilities without available data are excluded from the ranking.Click the rank badge to see the full State ranking.Click here to see the full State ranking.
Net patient income Info Net patient income: net patient revenue minus the home's total operating expenses. A positive figure means it earns more from resident care than it spends to deliver it; a negative figure means the opposite. It excludes non-operating "other income."
-$16.2M
Other income Info Money the home earns outside of resident care — such as investments, grants, rentals and other non-operating sources (CMS cost report, Worksheet G-3). It is tracked separately from net patient revenue: it is not part of that figure, and it is not included in net patient income.
$24.9M
Payroll costs Info Staff salaries plus wage-related costs — benefits such as payroll taxes, health insurance and retirement — from the home's own accounting records (CMS cost report, Worksheet A). Contract or agency labor is counted separately, under other operating costs. Rank #8 / 210Payroll — State benchmarkedThis home is ranked 8th out of 210 homes in Ohio. Shows total annual staff payroll benchmarked to the Ohio average. Higher payroll investment relative to peers often signals better staffing and less reliance on cheaper contract labor.Rankings are based only on facilities in Ohio that report data for that category. Facilities without available data are excluded from the ranking.Click the rank badge to see the full State ranking.Click here to see the full State ranking.
$12.0M 76.3% of net patient revenue Info Payroll as a share of revenue: staff salaries and wage-related benefits divided by net patient revenue. A higher figure means more of each revenue dollar goes to staff pay. Rank #206 / 210Payroll % — State benchmarkedThis home is ranked 206th out of 210 homes in Ohio. Shows payroll as a percentage of revenue versus the Ohio average. Well-run Ohio facilities typically land around 54–64% — the top third Statewide. Below 25% may signal understaffing or heavy agency use — read with Staffing ratings.Rankings are based only on facilities in Ohio that report data for that category. Facilities without available data are excluded from the ranking.Click the rank badge to see the full State ranking.Click here to see the full State ranking.
Other operating costs Info Everything it costs to run the home apart from payroll — food, utilities, supplies, maintenance, contract labor and administration. Calculated as total operating expense minus payroll (staff salaries and wage-related benefits).
$19.9M
Total costs Info The home's total operating expense for the year — all the costs of running it, salaries included (CMS cost report, Worksheet G-3).
$31.8M

What does this home offer?

Housing options icon

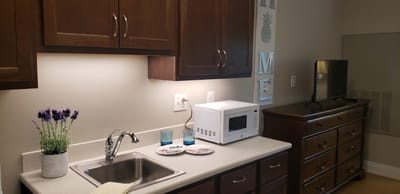
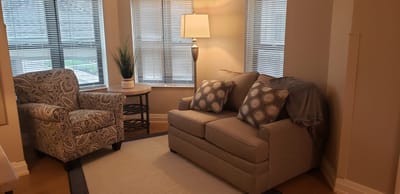
Housing Options: Studio / 1 Bed

Building type icon
Building type icon

Building Type: 3-story

Transportation services icon

Transportation Services

Fitness and recreation icon

Fitness and Recreation

Who this home usually serves

TYPE OF STAY

Primarily short stays

Residents typically stay for brief periods, with frequent admissions and discharges throughout the year.

Most new residents arrive under private pay (85% of admissions), and a typical private pay stay runs around 1 - 2 months.

Admissions
369 total

Coverage residents most often arrive under.

Medicare 14%
Private pay 85%
Discharges
413 total

Coverage residents most often leave under.

Medicare 13%
Private pay 86%
Medicaid 1%

Managed by Phyllis Tabbs

Administrator, the Gardens

Places of interest near Mcgregor at Overlook

Address 0.2 miles from city center Info Estimated distance in miles from East Cleveland's city center to Mcgregor at Overlook's address, calculated via Google Maps.

Calculate Travel Distance to Mcgregor at Overlook

Add your location

Address

Compare Nursing Homes around Cleveland

The information below is reported by the Ohio Department of Health, Bureau of Survey and Certification.

5 facilities compared · CMS & OH Dept. of Health data

Algart Health Care
NH
AL
HC
MC
RC
Cleveland (Edgewater)
36
Facility 36
OH AVG 78
Rank #273 / 323
100.0%
Facility 100.0%
OH AVG 78.7%
Rank #1 / 211
+27%
4.17
Facility 4.17
OH AVG 3.54
Rank #35 / 210
-44%+18%
$0
Facility $0
OH AVG $74.0k
Rank #1 / 211
11
Facility 11
OH AVG 30.9
Rank #29 / 210
5.5
Facility 5.5
OH AVG 4.6
Rank #167 / 210
-67-
62
Facility 62
OH AVG 40
Rank #136 / 705
Garth Ireland
$7.0M
Facility $7.0M
OH AVG $10.1M
Rank #109 / 210
$3.1M
Facility $3.1M
OH AVG $3.9M
Rank #171 / 210
44.1%
Facility 44.1%
OH AVG 40.2%
Rank #205 / 210
366308
O‘Neill Healthcare Fairview Park
NH
HC
Fairview Park
118
Facility 118
OH AVG 78
Rank #54 / 323
77.1%
Facility 77.1%
OH AVG 78.7%
Rank #139 / 211
-2%
3.20
Facility 3.20
OH AVG 3.54
Rank #150 / 210
-22%-10%
$0
Facility $0
OH AVG $74.0k
Rank #1 / 211
11
Facility 11
OH AVG 30.9
Rank #29 / 210
1.8
Facility 1.8
OH AVG 4.6
Rank #9 / 210
-99A+
66
Facility 66
OH AVG 40
Rank #94 / 705
Jenna Elliott
$11.7M
Facility $11.7M
OH AVG $10.1M
Rank #58 / 210
$5.3M
Facility $5.3M
OH AVG $3.9M
Rank #109 / 210
45%
Facility 45%
OH AVG 40.2%
Rank #198 / 210
366428
Mcgregor at Overlook
NH
AL
HC
IL
NC
RC
East Cleveland
148
Facility 148
OH AVG 78
Rank #20 / 323
93.2%
Facility 93.2%
OH AVG 78.7%
Rank #46 / 211
+18%
4.17
Facility 4.17
OH AVG 3.54
Rank #35 / 210
-75%+18%
$15.7k
Facility $15.7k
OH AVG $74.0k
Rank #161 / 211
15
Facility 15
OH AVG 30.9
Rank #48 / 210
3.0
Facility 3.0
OH AVG 4.6
Rank #45 / 210
1137-
52
Facility 52
OH AVG 40
Rank #229 / 705
Susan Althans
$15.7M
Facility $15.7M
OH AVG $10.1M
Rank #3 / 210
$12.0M
Facility $12.0M
OH AVG $3.9M
Rank #8 / 210
76.3%
Facility 76.3%
OH AVG 40.2%
Rank #206 / 210
366350
The Slovene Home Skilled Care & Rehabilitation
NH
AL
Cleveland (North Collinwood)
104
Facility 104
OH AVG 78
Rank #68 / 323
45.2%
Facility 45.2%
OH AVG 78.7%
Rank #204 / 211
-43%
4.54
Facility 4.54
OH AVG 3.54
Rank #22 / 210
-36%+28%
$0
Facility $0
OH AVG $74.0k
Rank #1 / 211
31
Facility 31
OH AVG 30.9
Rank #117 / 210
4.4
Facility 4.4
OH AVG 4.6
Rank #124 / 210
-76A+
67
Facility 67
OH AVG 40
Rank #84 / 705
Anthony Hiti
$6.6M
Facility $6.6M
OH AVG $10.1M
Rank #148 / 210
$4.5M
Facility $4.5M
OH AVG $3.9M
Rank #117 / 210
68.9%
Facility 68.9%
OH AVG 40.2%
Rank #23 / 210
365567
Crawford Manor Health Care Center
NH
AL
Cleveland (Hough)
50
Facility 50
OH AVG 78
Rank #227 / 323
68.0%
Facility 68.0%
OH AVG 78.7%
Rank #170 / 211
-14%
3.72
Facility 3.72
OH AVG 3.54
Rank #72 / 210
-54%+5%
$25.4k
Facility $25.4k
OH AVG $74.0k
Rank #168 / 211
45
Facility 45
OH AVG 30.9
Rank #168 / 210
5.6
Facility 5.6
OH AVG 4.6
Rank #171 / 210
235F
70
Facility 70
OH AVG 40
Rank #67 / 705
Gregory Hall
$3.9M
Facility $3.9M
OH AVG $10.1M
Rank #198 / 210
$2.4M
Facility $2.4M
OH AVG $3.9M
Rank #193 / 210
60.1%
Facility 60.1%
OH AVG 40.2%
Rank #22 / 210
366110

Financial Assistance for
Nursing Home in Ohio

Mcgregor at Overlook is located in East Cleveland, Ohio.
Here are the financial assistance programs available to residents in Ohio.

Get Financial aid guidance

PASSPORT Waiver

Ohio Medicaid PASSPORT

Age 60+
General Ohio resident, Medicaid-eligible, nursing home-level care need.
Income Limits (2025) ~$2,829/month 300% FBR, individual
Asset Limits $2,000 (individual), $3,000 (couple).
OH

Administered through regional agencies; waitlists possible.

Benefits
Personal care (5-7 hours/day) Respite (240 hours/year) Adult day care ($65/day) Home modifications ($1,500 avg.)

Ohio Home Care Program (non-Medicaid)

OH HCP

Age 60+
General Ohio resident, at risk of decline.
Income Limits ~$2,000/month individual, varies
Asset Limits $5,000 individual
OH

Limited funding; regional variation.

Benefits
In-home care (3-5 hours/week) Respite (up to 10 days/year) Transportation (~5 trips/month)

Assisted Living Waiver (ALW)

Ohio Assisted Living Waiver

Age 21+ (65+ prioritized)
General OH resident, Medicaid-eligible, NFLOC.
Income Limits (2025) ~$2,829/month (individual); QIT required.
Asset Limits $2,000 (individual), $3,000 (couple).
OH

Covers ~300 facilities; room/board not included (separate cost).

Benefits
Personal care Meals Medication management Transportation (~$3,000-$4,000/month value)

Program of All-Inclusive Care for the Elderly (PACE)

Ohio PACE (e.g., McGregor PACE)

Age 55+
General OH resident (specific counties), NFLOC, safe with PACE support.
Income Limits (2025) ~$2,829/month (Medicaid-eligible); private pay option available.
Asset Limits $2,000 (individual), $3,000 (couple) for Medicaid enrollees.
OH

Available in 9 counties (e.g., Cuyahoga, Franklin); expanding via Healthy Aging Grants.

Benefits
Personal care (5-7 hours/day) Medical care Meals Transportation Respite Therapies

Medicare Savings Program (MSP)

Ohio Medicare Savings Program

Age 65+ or disabled
General OH resident, Medicare Part A/B.
Income Limits (2025) ~$2,510/month (QMB), ~$3,380/month (SLMB), ~$3,598/month (QI)—individual.
Asset Limits $9,430 (individual), $14,130 (couple).
OH

Three tiers; includes Extra Help for Part D; no waitlist.

Benefits
Covers Part B premiums ($174.70/month) Deductibles ($240/year) Copays (~20%)

Home Energy Assistance Program (HEAP)

Ohio HEAP

Age 60+ prioritized
General OH resident, low-income household.
Income Limits (2025) ~$3,970/month individual, 185% FPL
Asset Limits Not assessed; income-focused.
OH

Covers gas, electric, oil; emergency aid via Winter/Summer Crisis Programs.

Benefits
Heating/cooling aid ($300-$1,000/season) Emergency aid ($500 max)

Family Caregiver Support Program (FCSP)

Ohio Family Caregiver Support Program

Age
General Caregivers of 60+ needing care or 55+ caregivers of others; OH resident; functional needs (2+ ADLs).
Income Limits (2025) Prioritizes ~$24,980/year (individual); no strict cap.
Asset Limits Not assessed; need-based.
OH

12 AAAs; rural/low-income priority; volunteer respite option.

Benefits
Respite (4-6 hours/week or 5 days/year) Adult day care ($60/day) Training Supplies (~$500/year)

VA Aid and Attendance (A&A) and Housebound Benefits

Ohio VA Aid and Attendance/Housebound

Age 65+ or disabled veteran/spouse
General OH resident, wartime service, need for ADL help (A&A) or homebound.
Income Limits (2025) Net income < ~$1,984/month (veteran with dependent, A&A); pension offsets income.
Asset Limits ~$155,356 net worth limit
OH

High veteran demand; supports care in multiple settings.

Benefits
Cash (~$1,433-$2,642/month veteran, ~$951-$1,318 spouse) for care costs (e.g., in-home, assisted living)

Homestead Exemption

Ohio Homestead Exemption

Age 65+ (or disabled)
General OH resident, homeowner, low-income.
Income Limits (2025) ~$38,500/year individual, adjusted annually
Asset Limits Not assessed; home ownership required.
OH

Reduces taxable value by $25,000; applies to primary residence.

Benefits
Tax reduction (~$400-$800/year avg., varies by county)

Save the Dream Ohio (Homeowner Assistance Fund)

Ohio Save the Dream

Age 60+ prioritized
General OH resident, homeowner, hardship post-Jan 21, 2020.
Income Limits (2025) ~$147,600/year family of 4, 150% AMI; varies by county
Asset Limits Not assessed; hardship-focused.
OH

Covers delinquent mortgages, utilities, taxes; max $25,000 mortgage aid.

Benefits
Mortgage aid ($25,000 max) Utility/property tax aid ($5,000 avg.)

Frequently Asked Questions about Mcgregor at Overlook

Is Mcgregor at Overlook in a walkable area?

Mcgregor at Overlook has a walk score of 52. Moderately walkable. Some errands can be accomplished on foot, with a mix of nearby amenities.

What is the occupancy rate at Mcgregor at Overlook?

Mcgregor at Overlook's occupancy is 93.2%.

Does Mcgregor at Overlook operate as a for-profit or non-profit?

Mcgregor at Overlook is registered as a non-profit.

Are there photos of Mcgregor at Overlook?

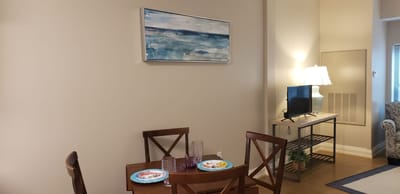
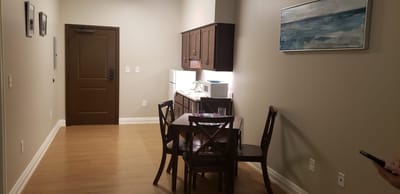
Yes — there are 8 photos of Mcgregor at Overlook in the photo gallery on this page.

What is the address of Mcgregor at Overlook?

Mcgregor at Overlook is located at 14900 Private Dr, East Cleveland, OH 44112.

What is the phone number of Mcgregor at Overlook?

(216) 721-0935 will put you in contact with the team at Mcgregor at Overlook.

Is Mcgregor at Overlook Medicare or Medicaid certified?

Yes — Mcgregor at Overlook is a CMS-certified provider of Medicare and Medicaid.

Guides for Better Senior Living

Care Cost Calculator: See Prices in Your Area

Nursing Home Data Explorer

Don’t Wait Too Long: 7 Red Flag Signs Your Parent Needs Assisted Living Now

The True Cost of Assisted Living in 2025 – And How Families Are Paying For It

Understanding Senior Living Costs: Pricing Models, Discounts & Financial Assistance