The Slovene Home Skilled Care & Rehabilitation
Nursing Home & Assisted Living · Cleveland, OH
CMS overall rating Info CMS (the Centers for Medicare & Medicaid Services) is the federal agency that rates nursing home quality. Its Overall Rating runs from 1 to 5 stars, combining health inspections, staffing, and quality measures, with inspections weighted most heavily.

The Slovene Home Skilled Care & Rehabilitation

Nursing Home & Assisted Living · Cleveland, OH
CMS overall rating Info CMS (the Centers for Medicare & Medicaid Services) is the federal agency that rates nursing home quality. Its Overall Rating runs from 1 to 5 stars, combining health inspections, staffing, and quality measures, with inspections weighted most heavily.
Calculator: See prices in your area
The Slovene Home Skilled Care & Rehabilitation accepts Medicare, Medicaid, and private pay.

Overview of The Slovene Home Skilled Care & Rehabilitation

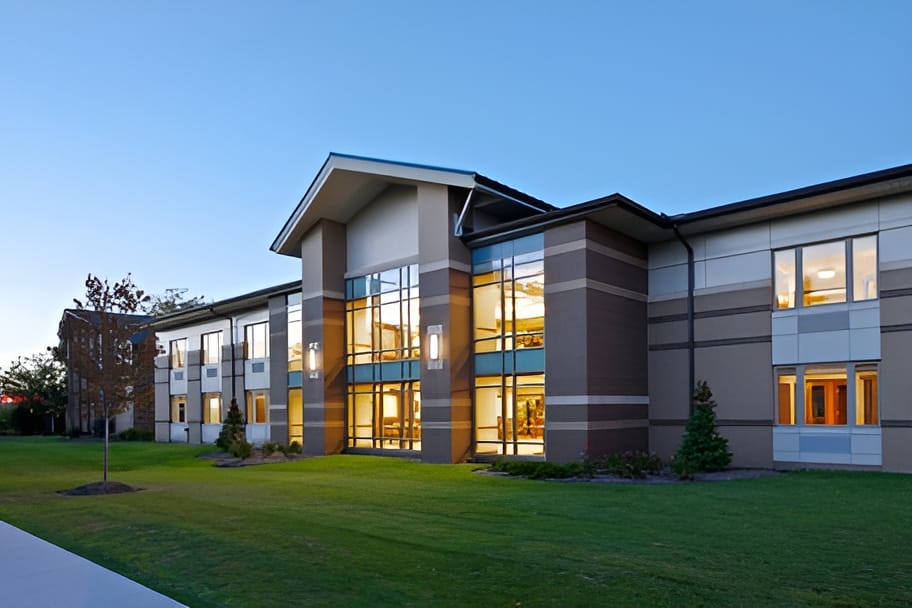
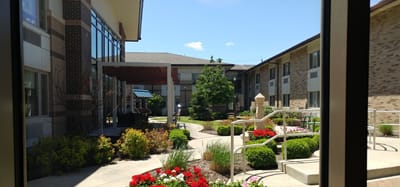
Find the care you need at The Slovene Home Skilled Care and Rehabilitation, an exceptional community set in the rich cultural and historic neighborhood of Cleveland, OH. The community offers assisted living, long-term care, skilled care rehabilitation, respite care, and hospice care. Residents can keep their peace of mind with a respectful and well-trained team attending to their needs 24/7. The community also handles the meals, housekeeping and linen services, so residents have a maintenance-free lifestyle. All residents have their own private suites.

The Slovene Home Skilled Care and Rehabilitation has been serving the community for over 60 years and is proud of their excellent reputation. Dedicated to residents’ happiness and wellness, a well-thought-out calendar of fun recreational activities and enriching programs is conducted. Residents enjoy a delightful dining experience with delectable and healthy meals that cater to their dietary needs and preferences. Emergency call systems and medication administration are also available for older adults’ healthcare needs. Residents make the most of their golden years amidst the community’s nurturing and welcoming environment, especially with its wide range of care options and top-notch amenities.

Quality ratings

Measured by Centers for Medicare & Medicaid Services (CMS)

Overall rating Info The Overall CMS Rating combines results from health inspections, staffing levels and quality measures. Health inspections carry the most weight. Staffing and quality scores can increase or decrease the final rating based on performance compared to state and national standards.
▼ 5.7% Below OH avg. ▼ 5.7% Below OH avg.OH average: 3.2Click the badge to see the full State ranking.Click here to see the full State ranking.
Health Inspection Info Based on the results of the facility's three most recent standard inspections and any complaint investigations. CMS reviews the number, scope, and severity of deficiencies, with more recent findings weighted more heavily.
▼ 28.6% Below OH avg. ▼ 28.6% Below OH avg.OH average: 2.8Click the badge to see the full State ranking.Click here to see the full State ranking.
Staffing Info Measures average nursing staff hours per resident per day, including Registered Nurses (RNs) and total nursing staff. Ratings are adjusted based on the level of care residents require and are compared to state and national benchmarks.
▲ 63.8% Above OH avg. ▲ 63.8% Above OH avg.OH average: 2.4Click the badge to see the full State ranking.Click here to see the full State ranking.
Quality Measures Info Based on clinical and physical health indicators reported to CMS, such as hospital readmissions, falls, pressure ulcers, and improvements in mobility. These measures reflect how well residents' health needs are being managed.
▲ 14.7% Above OH avg. ▲ 14.7% Above OH avg.OH average: 4.4Click the badge to see the full State ranking.Click here to see the full State ranking.

Staffing hours breakdown

Info Daily nursing hours per resident by staff type, reported to CMS. Higher is generally better — compare this facility to state and national averages to see where staffing stands.

Hours per resident per day — compared to Ohio state averages

Total nursing care / resident Info This home is ranked 22nd out of 210 homes in Ohio for nurse hours. Total adjusted nursing hours per resident per day, combining RN, LPN, and aide time. CMS adjusts this for case-mix so facilities can be fairly compared.
4h 33m per day
Rank #22 / 210Nurse hours — State benchmarkedThis home is ranked 22nd out of 210 homes in Ohio. Shows adjusted nurse hours per resident per day benchmarked to the Ohio average, with a ranking across 210 Ohio facilities. More hours mean more direct care. The national average is about 3.5 hrs; below 3.0 is a red flag.Ranking totals vary by category as each rank only includes facilities that report data for that metric. Homes missing that data point aren't included in the ranking.Click the rank badge to see the full State ranking.Click here to see the full State ranking.
This facility Ohio avg (3h 32m per day)
vs Ohio avg
+28%

2 of 6 metrics below state avg

Standout metric LPN / LVN is +39% above state avg
Staff typeHours / Day / Residentvs state avg
Registered Nurse (RN) Info RNs hold the highest nursing license and can assess residents, interpret test results, and direct care plans. More RN hours per day often signals stronger clinical oversight and faster response to health changes. 37m per day ▼ 4% State avg: 38m per day · National avg: 41m per day
LPN / LVN Info Licensed Practical Nurses (LPNs) or Licensed Vocational Nurses (LVNs) deliver routine hands-on care — medication administration, wound dressing, and monitoring vital signs. They work under RN supervision and make up a large share of daily bedside care. 1h 21m per day ▲ 39% State avg: 58m per day · National avg: 52m per day
Nurse Aide Info Certified Nurse Aides (CNAs) provide the most direct day-to-day assistance: bathing, dressing, feeding, and mobility. Nurse aide hours are typically the largest staffing category and directly affect residents' quality of life. 2h 38m per day ▲ 24% State avg: 2h 7m per day · National avg: 2h 20m per day
Weekend Total Nursing Info Combined nursing hours (RN + LPN + Nurse Aide) per resident per day on weekends. Staffing often drops on weekends — this figure reveals whether the facility maintains adequate coverage outside of weekday hours. 4h 10m per day ▲ 25% State avg: 3h 20m per day · National avg: 3h 27m per day
Physical Therapist Info Hours per resident per day provided by licensed Physical Therapists (PTs) or PT Assistants. PT services help residents recover mobility after injury or illness and are especially important for post-acute (short-stay) rehabilitation. 4m per day ▲ 10% State avg: 3m per day · National avg: 4m per day
Weekend RN Info Registered nurse hours specifically on weekends. Facilities sometimes reduce RN presence on Saturdays and Sundays — a low weekend RN figure compared to weekday hours can indicate reduced clinical oversight when most administrative staff are absent. 23m per day ▼ 9% State avg: 25m per day · National avg: 29m per day

Capacity and availability

This home usually has availability

Lower occupancy than the Ohio average: 78.7%
Occupancy rate
45.2% Rank #204 / 211Occupancy rate — State benchmarkedThis home is ranked 204th out of 211 homes in Ohio. Shows this facility's occupancy rate versus the Ohio average, with its Statewide rank out of 211. Higher occupancy signals strong local demand and financial stability.Ranking totals vary by category as each rank only includes facilities that report data for that metric. Homes missing that data point aren't included in the ranking.Click the rank badge to see the full State ranking.Click here to see the full State ranking.
Avg. Length of Stay
204 days
Bed community size
104-bed community Rank #68 / 323Bed count — State benchmarkedThis home is ranked 68th out of 323 homes in Ohio. Shows this facility's certified or reported bed count compared to other Ohio facilities. Larger communities may offer more amenities, programs, and on-site services for residents and families.Ranking totals vary by category as each rank only includes facilities that report data for that metric. Homes missing that data point aren't included in the ranking.Click the rank badge to see the full State ranking.Click here to see the full State ranking.
A larger shared setting that may offer more common spaces and organized community services.
Walk Score
Walk Score: 67 / 100 Rank #84 / 705Walk Score — State benchmarkedThis home is ranked 84th out of 705 homes in Ohio. Shows how walkable this facility's neighborhood is compared to the average Walk Score across Ohio facilities. Higher scores benefit residents, families, and staff.Ranking totals vary by category as each rank only includes facilities that report data for that metric. Homes missing that data point aren't included in the ranking.Click the rank badge to see the full State ranking.Click here to see the full State ranking.
Moderately walkable. Some errands can be accomplished on foot, with a mix of nearby amenities.
BBB Rating
BBB Rating: A+ (Not Accredited)
An independent rating from the Better Business Bureau based on factors such as complaint history, transparency, and business practices.
How BBB ratings work

About this community

Staffing

Key information about the people who lead and staff this community.

Leadership

ContactDarla Young, Director of Human Resources

Contact The Slovene Home Skilled Care & Rehabilitation

Health Inspection History

Inspections since 2019
Total health inspections 7

Ohio average 6.7


Last Health inspection on Aug 2025

Total health citations
31 Rank #117 / 210Health citations — State benchmarkedThis home is ranked 117th out of 210 homes in Ohio. Shows this facility's total health deficiency citations benchmarked to the Ohio State average, with a ranking across all 210 OH facilities. Lower citation counts earn a better rank.Ranking totals vary by category as each rank only includes facilities that report data for that metric. Homes missing that data point aren't included in the ranking.Click the rank badge to see the full State ranking.Click here to see the full State ranking.

Ohio average 30.9

Citations per inspection
4.43 Rank #124 / 210Citations per inspection — State benchmarkedThis home is ranked 124th out of 210 homes in Ohio. Shows average deficiency citations per CMS inspection for this facility versus the Ohio mean across 210 facilities with citation data. Lower is better.Ranking totals vary by category as each rank only includes facilities that report data for that metric. Homes missing that data point aren't included in the ranking.Click the rank badge to see the full State ranking.Click here to see the full State ranking.

Ohio average 4.59


Health citations are formal notices following inspections when they fail to comply with safety and care standards.

22 of 31 citations resulted from standard inspections; and 9 of 31 resulted from complaint investigations.

Breakdown of citation severity (last 7 years)
Critical health citations
0
100% better than Ohio average

Ohio average: 0.3


Serious health citations
0
100% better than Ohio average

Ohio average: 0.9

0 critical citations Ohio average: 0.3

0 serious citations Ohio average: 0.9

31 moderate citations Ohio average: 29

0 minor citations Ohio average: 0.7
Citations history (last 7 years)
Nutrition moderate citation Aug 20, 2025
Corrected

Care Planning moderate citation May 23, 2025
Corrected

Nutrition moderate citation Sep 26, 2024
Corrected

Nutrition moderate citation Sep 26, 2024
Corrected

Staffing Data

Reporting period: October 1 – December 31, 2025 (Q4 2025). Source: CMS Payroll-Based Journal report.

Total staff 337
Employees 108
Contractors 229
Staff to resident ratio 4.06 : 1
99% more staff per resident than Ohio average
Ohio average ratio: 2.04 : 1 Ohio average ratio: 2.04 : 1See full Ohio ranking
Avg staff/day 50
Average shift 8 hours
0% compared with Ohio average
Ohio average: 8.1 hours Ohio average shift: 8.1 hoursSee full Ohio ranking
Total staff hours (quarter) 36,624

Nursing staff breakdown

Q4 2025 · Oct 1 – Dec 31 More info This data comes from the CMS Payroll-Based Journal report covering October 1 – December 31, 2025.
Registered Nurse

Manages medical care and health needs.

RN Staff Info 20 total: 17 full-time employees and 3 contractors. 20
Average shift length Info Average shift length. Calculated as total hours divided by days worked and average staff per day. 8.3 hours
Licensed Practical Nurse

Assists with medical care and medications.

LPN Staff Info 111 total: 33 full-time employees and 78 contractors. 111
Average shift length Info Average shift length. Calculated as total hours divided by days worked and average staff per day. 8.3 hours
Certified Nursing Assistant

Helps with daily care and mobility.

CNA Staff Info 181 total: 47 full-time employees and 134 contractors. 181
Average shift length Info Average shift length. Calculated as total hours divided by days worked and average staff per day. 8.4 hours

Contractor staffing

Q4 2025 · Oct 1 – Dec 31 More info This data comes from the CMS Payroll-Based Journal report covering October 1 – December 31, 2025.

Total hours from contractors

15.9%

5,807 contractor hours this quarter

Certified Nursing Assistant: 134 Licensed Practical Nurse: 78 Registered Nurse: 3 Qualified Social Worker: 3 Physical Therapy Aide: 3 Speech Language Pathologist: 3 Physical Therapy Assistant: 2 Respiratory Therapy Technician: 1 Medical Director: 1 Physician Assistant: 1

Staff by category

Q4 2025 · Oct 1 – Dec 31 More info This data comes from the CMS Payroll-Based Journal report covering October 1 – December 31, 2025.
Certified Nursing Assistant4713418118,31092100%8.4
Licensed Practical Nurse33781118,89692100%8.3
Registered Nurse173202,36092100%8.3
Clinical Nurse Specialist3031,3677076%7.7
Other Dietary Services Staff2029818592%8
Administrator1015126368%8.1
Nurse Practitioner1015126368%8.1
Occupational Therapy Aide1015126368%8.1
Physical Therapy Aide0334786975%6.9
RN Director of Nursing1014475762%7.8
Dietitian1014245358%8
Qualified Social Worker0334166267%6.7
Respiratory Therapy Technician0114076368%6.5
Mental Health Service Worker1014005054%8
Physical Therapy Assistant0222936571%4.5
Speech Language Pathologist0331794852%3.6
Medical Director011995358%1.9
Physician Assistant0113378%4.6
181 Certified Nursing Assistant
% of Days 100%
111 Licensed Practical Nurse
% of Days 100%
20 Registered Nurse
% of Days 100%
3 Clinical Nurse Specialist
% of Days 76%
2 Other Dietary Services Staff
% of Days 92%
1 Administrator
% of Days 68%
1 Nurse Practitioner
% of Days 68%
1 Occupational Therapy Aide
% of Days 68%
3 Physical Therapy Aide
% of Days 75%
1 RN Director of Nursing
% of Days 62%
1 Dietitian
% of Days 58%
3 Qualified Social Worker
% of Days 67%
1 Respiratory Therapy Technician
% of Days 68%
1 Mental Health Service Worker
% of Days 54%
2 Physical Therapy Assistant
% of Days 71%
3 Speech Language Pathologist
% of Days 52%
1 Medical Director
% of Days 58%
1 Physician Assistant
% of Days 8%

Penalties and fines

Federal penalties imposed by CMS for regulatory violations, including civil money penalties (fines) and denials of payment for new Medicare/Medicaid admissions.

Source: CMS Penalties Database

No penalties in the past 3 years

No civil money penalties or payment denials were reported in the last 3 years.

Quality of care over time

These measures show how residents usually do over time at this home, based on health outcomes and preventive care.

High-risk clinical events score Info A composite score based on pressure ulcers, falls with injury, weight loss, walking ability decline, and activities of daily living decline. 5.4
7% better than Ohio average

Ohio average: 5.8

Functional decline score Info A composite score based on activities of daily living decline, walking ability decline, and incontinence. 9.2
27% better than Ohio average

Ohio average: 12.7

Long-stay resident measures
Need for Help with Daily Activities Increased Info Percent of long-stay residents whose need for help with daily activities has increased 8.4%
23% worse than Ohio average

Ohio average: 6.8%

Walking Ability Worsened Info Percent of long-stay residents whose ability to move independently worsened 5.0%
44% better than Ohio average

Ohio average: 8.9%

Low Risk Residents with Bowel/Bladder Incontinence Info Percent of low risk long-stay residents who lose control of their bowels or bladder 14.4%
34% better than Ohio average

Ohio average: 22.0%

Falls with Major Injury Info Percent of long-stay residents experiencing one or more falls with major injury 2.1%
38% better than Ohio average

Ohio average: 3.4%

High Risk Residents with Pressure Ulcers Info Percent of long-stay high risk residents with pressure ulcers 4.6%
17% worse than Ohio average

Ohio average: 3.9%

Urinary Tract Infection Info Percent of long-stay residents with a urinary tract infection 0.0%
100% better than Ohio average

Ohio average: 0.5%

Lost Too Much Weight Info Percent of long-stay residents who lose too much weight 7.0%
14% worse than Ohio average

Ohio average: 6.2%

Depressive Symptoms Info Percent of long-stay residents who have depressive symptoms 12.5%
48% better than Ohio average

Ohio average: 24.0%

Antipsychotic Use Info Percent of long-stay residents who received an antipsychotic medication 11.2%
33% worse than Ohio average

Ohio average: 8.4%

Pneumococcal Vaccine Info Percent of long-stay residents assessed and appropriately given the pneumococcal vaccine 98.9%
7% better than Ohio average

Ohio average: 92.4%

Influenza Vaccine Info Percent of long-stay residents assessed and appropriately given the seasonal influenza vaccine 98.7%
In line with Ohio average

Ohio average: 94.5%

Short-stay resident measures
Pneumococcal Vaccine Info Percent of short-stay residents assessed and appropriately given the pneumococcal vaccine 95.5%
22% better than Ohio average

Ohio average: 78.0%

Antipsychotic medication increase Info Percent of short-stay residents who newly received an antipsychotic medication 0.0%
100% better than Ohio average

Ohio average: 1.3%

Influenza Vaccine Info Percent of short-stay residents assessed and appropriately given the seasonal influenza vaccine 80.6%
7% better than Ohio average

Ohio average: 75.6%

Breakdown by payment type

Medicare

40% of new residents, usually for short-term rehab.

Typical stay 1 - 2 months

Private pay

51% of new residents, often for short stays.

Typical stay 1 - 2 years

Medicaid

8% of new residents, often for long-term daily care.

Typical stay 1 - 2 years

Facility Characteristics

Source: CMS Long-Term Care Facility Characteristics (Data as of Jan 2026)

Total residents 83
Medicare
6
7.2% of residents
Medicaid
40
48.2% of residents
Private pay or other
37
44.6% of residents
Programs & Services
Residents Group

Residents meet regularly to discuss policies, care quality, and activities

Active Resident Council

Organized group of residents that meets regularly to discuss facility policies, quality of life, and activities.

Finances and operations

Based on CMS SNF Cost Report for fiscal year ending in 12/2023.

Governmental community
Operated by a subsidized facility district.
Net patient revenue Info Net patient revenue — what the home actually collects for resident care, after contractual allowances, bad debt and discounts are subtracted from its gross charges (CMS cost report, Worksheet G-3). It covers resident care only; money the home earns from other sources is shown separately as "Other income."
$6.6M
Net patient income Info Net patient income: net patient revenue minus the home's total operating expenses. A positive figure means it earns more from resident care than it spends to deliver it; a negative figure means the opposite. It excludes non-operating "other income."
-$2.5M
Governmental community Operated by a subsidized facility district.
Net patient revenue Info Net patient revenue — what the home actually collects for resident care, after contractual allowances, bad debt and discounts are subtracted from its gross charges (CMS cost report, Worksheet G-3). It covers resident care only; money the home earns from other sources is shown separately as "Other income."
$6.6M Rank #148 / 210Revenue — State benchmarkedThis home is ranked 148th out of 210 homes in Ohio. Shows this facility's annual revenue compared to the Ohio average. Higher revenue generally means more resources for staffing and capital — read alongside Payroll %.Ranking totals vary by category as each rank only includes facilities that report data for that metric. Homes missing that data point aren't included in the ranking.Click the rank badge to see the full State ranking.Click here to see the full State ranking.
Net patient income Info Net patient income: net patient revenue minus the home's total operating expenses. A positive figure means it earns more from resident care than it spends to deliver it; a negative figure means the opposite. It excludes non-operating "other income."
-$2.5M
Other income Info Money the home earns outside of resident care — such as investments, grants, rentals and other non-operating sources (CMS cost report, Worksheet G-3). It is tracked separately from net patient revenue: it is not part of that figure, and it is not included in net patient income.
$1.4M
Payroll costs Info Staff salaries plus wage-related costs — benefits such as payroll taxes, health insurance and retirement — from the home's own accounting records (CMS cost report, Worksheet A). Contract or agency labor is counted separately, under other operating costs. Rank #117 / 210Payroll — State benchmarkedThis home is ranked 117th out of 210 homes in Ohio. Shows total annual staff payroll benchmarked to the Ohio average. Higher payroll investment relative to peers often signals better staffing and less reliance on cheaper contract labor.Ranking totals vary by category as each rank only includes facilities that report data for that metric. Homes missing that data point aren't included in the ranking.Click the rank badge to see the full State ranking.Click here to see the full State ranking.
$4.5M 68.9% of net patient revenue Info Payroll as a share of revenue: staff salaries and wage-related benefits divided by net patient revenue. A higher figure means more of each revenue dollar goes to staff pay. Rank #23 / 210Payroll % — State benchmarkedThis home is ranked 23rd out of 210 homes in Ohio. Shows payroll as a percentage of revenue versus the Ohio average. Well-run Ohio facilities typically land around 54–64% — the top third Statewide. Below 25% may signal understaffing or heavy agency use — read with Staffing ratings.Ranking totals vary by category as each rank only includes facilities that report data for that metric. Homes missing that data point aren't included in the ranking.Click the rank badge to see the full State ranking.Click here to see the full State ranking.
Other operating costs Info Everything it costs to run the home apart from payroll — food, utilities, supplies, maintenance, contract labor and administration. Calculated as total operating expense minus payroll (staff salaries and wage-related benefits).
$4.6M
Total costs Info The home's total operating expense for the year — all the costs of running it, salaries included (CMS cost report, Worksheet G-3).
$9.1M

What does this home offer?

Housing options icon

Housing Options: Private Rooms

Building type icon
Building type icon

Building Type: 2-story

Beauty services icon

Beauty Services

Housekeeping icon
Housekeeping icon

Housekeeping Services

Social and recreational activities icon

Social and Recreational Activities

Exercise program icon

Exercise Programs

Health Programs icon

Health Programs

Who this home usually serves

TYPE OF STAY

Mix of rehab and long-term care

This home supports both short-term rehab and long-term care, with residents staying for a wide range of durations.

Most new residents arrive under private pay (51% of admissions), and a typical private pay stay runs around 1 - 2 years.

Admissions
84 total

Coverage residents most often arrive under.

Medicare 40%
Private pay 51%
Medicaid 8%
Discharges
121 total

Coverage residents most often leave under.

Medicare 41%
Private pay 53%
Medicaid 6%

Places of interest near The Slovene Home Skilled Care & Rehabilitation

Address 11.0 miles from city center Info Estimated distance in miles from Cleveland's city center to The Slovene Home Skilled Care & Rehabilitation's address, calculated via Google Maps.

Calculate Travel Distance to The Slovene Home Skilled Care & Rehabilitation

Add your location

Address

Compare Nursing Home around Cleveland

The information below is reported by the Ohio Department of Health, Bureau of Survey and Certification.

5 facilities compared · CMS & OH Dept. of Health data

Algart Health Care
NH
AL
HC
MC
RC
Cleveland (Edgewater)
36
Facility 36
OH AVG 78
Rank #273 / 323
100.0%
Facility 100.0%
OH AVG 78.7%
Rank #1 / 211
+27%
4.17
Facility 4.17
OH AVG 3.54
Rank #35 / 210
-44%+18%
$0
Facility $0
OH AVG $74.0k
Rank #1 / 211
11
Facility 11
OH AVG 30.9
Rank #29 / 210
5.5
Facility 5.5
OH AVG 4.6
Rank #167 / 210
-67-
62
Facility 62
OH AVG 40
Rank #136 / 705
Garth Ireland
$7.0M
Facility $7.0M
OH AVG $10.1M
Rank #109 / 210
$3.1M
Facility $3.1M
OH AVG $3.9M
Rank #171 / 210
44.1%
Facility 44.1%
OH AVG 40.2%
Rank #205 / 210
366308
Mcgregor at Overlook
NH
AL
HC
IL
NC
RC
East Cleveland
148
Facility 148
OH AVG 78
Rank #20 / 323
93.2%
Facility 93.2%
OH AVG 78.7%
Rank #46 / 211
+18%
4.17
Facility 4.17
OH AVG 3.54
Rank #35 / 210
-75%+18%
$15.7k
Facility $15.7k
OH AVG $74.0k
Rank #161 / 211
15
Facility 15
OH AVG 30.9
Rank #48 / 210
3.0
Facility 3.0
OH AVG 4.6
Rank #45 / 210
1137-
52
Facility 52
OH AVG 40
Rank #229 / 705
Susan Althans
$15.7M
Facility $15.7M
OH AVG $10.1M
Rank #3 / 210
$12.0M
Facility $12.0M
OH AVG $3.9M
Rank #8 / 210
76.3%
Facility 76.3%
OH AVG 40.2%
Rank #206 / 210
366350
The Slovene Home Skilled Care & Rehabilitation
NH
AL
Cleveland (North Collinwood)
104
Facility 104
OH AVG 78
Rank #68 / 323
45.2%
Facility 45.2%
OH AVG 78.7%
Rank #204 / 211
-43%
4.54
Facility 4.54
OH AVG 3.54
Rank #22 / 210
-36%+28%
$0
Facility $0
OH AVG $74.0k
Rank #1 / 211
31
Facility 31
OH AVG 30.9
Rank #117 / 210
4.4
Facility 4.4
OH AVG 4.6
Rank #124 / 210
-76A+
67
Facility 67
OH AVG 40
Rank #84 / 705
Anthony Hiti
$6.6M
Facility $6.6M
OH AVG $10.1M
Rank #148 / 210
$4.5M
Facility $4.5M
OH AVG $3.9M
Rank #117 / 210
68.9%
Facility 68.9%
OH AVG 40.2%
Rank #23 / 210
365567
Franklin Plaza Extended Care
NH
AL
HC
MC
RC
Cleveland (Ohio City)
178
Facility 178
OH AVG 78
Rank #5 / 323
92.7%
Facility 92.7%
OH AVG 78.7%
Rank #51 / 211
+18%
3.10
Facility 3.10
OH AVG 3.54
Rank #165 / 210
+4%-13%
$0
Facility $0
OH AVG $74.0k
Rank #1 / 211
31
Facility 31
OH AVG 30.9
Rank #117 / 210
3.4
Facility 3.4
OH AVG 4.6
Rank #64 / 210
-163-
87
Facility 87
OH AVG 40
Rank #5 / 705
-
$14.9M
Facility $14.9M
OH AVG $10.1M
Rank #25 / 210
$8.6M
Facility $8.6M
OH AVG $3.9M
Rank #28 / 210
57.6%
Facility 57.6%
OH AVG 40.2%
Rank #115 / 210
365388
Crawford Manor Health Care Center
NH
AL
Cleveland (Hough)
50
Facility 50
OH AVG 78
Rank #227 / 323
68.0%
Facility 68.0%
OH AVG 78.7%
Rank #170 / 211
-14%
3.72
Facility 3.72
OH AVG 3.54
Rank #72 / 210
-54%+5%
$25.4k
Facility $25.4k
OH AVG $74.0k
Rank #168 / 211
45
Facility 45
OH AVG 30.9
Rank #168 / 210
5.6
Facility 5.6
OH AVG 4.6
Rank #171 / 210
235F
70
Facility 70
OH AVG 40
Rank #67 / 705
Gregory Hall
$3.9M
Facility $3.9M
OH AVG $10.1M
Rank #198 / 210
$2.4M
Facility $2.4M
OH AVG $3.9M
Rank #193 / 210
60.1%
Facility 60.1%
OH AVG 40.2%
Rank #22 / 210
366110

Frequently Asked Questions about The Slovene Home Skilled Care & Rehabilitation

What neighborhood is The Slovene Home Skilled Care & Rehabilitation in?

The Slovene Home Skilled Care & Rehabilitation is in the North Collinwood neighborhood of Cleveland.

Is The Slovene Home Skilled Care & Rehabilitation in a walkable area?

The Slovene Home Skilled Care & Rehabilitation has a walk score of 67. Moderately walkable. Some errands can be accomplished on foot, with a mix of nearby amenities.

What is the occupancy rate at The Slovene Home Skilled Care & Rehabilitation?

The Slovene Home Skilled Care & Rehabilitation's occupancy is 45.2%.

Are there photos of The Slovene Home Skilled Care & Rehabilitation?

Yes — there are 4 photos of The Slovene Home Skilled Care & Rehabilitation in the photo gallery on this page.

What is the address of The Slovene Home Skilled Care & Rehabilitation?

The Slovene Home Skilled Care & Rehabilitation is located at 18621 Neff Rd, Cleveland, OH 44119, United States.

What is the phone number of The Slovene Home Skilled Care & Rehabilitation?

(216) 486-0268 will put you in contact with the team at The Slovene Home Skilled Care & Rehabilitation.

Is The Slovene Home Skilled Care & Rehabilitation Medicare or Medicaid certified?

Yes — The Slovene Home Skilled Care & Rehabilitation is a CMS-certified provider of Medicare and Medicaid.

Guides for Better Senior Living

Care Cost Calculator: See Prices in Your Area

Nursing Home Data Explorer

Don’t Wait Too Long: 7 Red Flag Signs Your Parent Needs Assisted Living Now

The True Cost of Assisted Living in 2025 – And How Families Are Paying For It

Understanding Senior Living Costs: Pricing Models, Discounts & Financial Assistance